Equalities analysis of grades awarded for VTQs in spring and summer 2021
Updated 12 August 2021
Applies to England

© Crown copyright 2021
This publication is licensed under the terms of the Open Government Licence v3.0 except where otherwise stated. To view this licence, visit nationalarchives.gov.uk/doc/open-government-licence/version/3 or write to the Information Policy Team, The National Archives, Kew, London TW9 4DU, or email: psi@nationalarchives.gov.uk.
Where we have identified any third party copyright information you will need to obtain permission from the copyright holders concerned.
This publication is available at https://www.gov.uk/government/publications/analysis-of-results-vtqs-2021/equalities-analysis-of-grades-awarded-for-vtqs-in-spring-and-summer-2021
Authors
- Ben Cuff
- Dovile Rama
Executive summary
The coronavirus (COVID-19) pandemic has continued to cause disruption to learning and assessments in 2021, as it did in 2020. The purpose of this report is to analyse the grades that were awarded in light of these circumstances for a number of vocational and technical qualifications (VTQs), to monitor the relative results gaps between different groups of learners, according to their demographic and socio-economic characteristics (including protected characteristics).
We specifically focus on Applied General qualifications as well as other qualifications included in the Department for Education’s 2020 performance tables, and ‘Other General’ qualifications.
Data was collected from awarding organisations on all learners in England awarded a grade this spring or summer for exams and other assessments (collectively referred to as ‘assessments’ in this report) taken for the above qualifications between 24 March 2021 and 31 July 2021 (chosen to be consistent with data collected for previous years). Similar data for 2018, 2019, and 2020, that was collected in 2020, is also used for context.
A logistic regression model was used to establish the relationship between a number of different learner characteristics and the probability of achieving a ‘top grade’ (the single highest or best grade that can be achieved in each qualification, which will depend upon the particular grading structure that has been adopted). Learner characteristics included ethnicity, gender, special educational needs and disabilities status, free school meal eligibility (a measure of deprivation), Income Deprivation Affecting Children Index (IDACI) score, and prior attainment. Through this model, we were able to explore the effect of each learner characteristic, while holding all other characteristics fixed.
In the majority of cases, no notable changes over time in the relative probabilities of achieving top grades between different groups of learners were observed. One particular effect was observed: that females became increasingly more likely to achieve top grades compared to males in 2021 relative to previous years for Level 1/2 Other General qualifications, and for Level 3 Applied General and other Performance Table qualifications. For Level 1/2 Performance Table qualifications and Level 3 Other General qualifications, females had been increasingly more likely to achieve top grades compared to males between 2019 and 2020, but this decreased slightly in 2021.
Some other possible effects are also discussed within the report relating to learners with special educational needs and disabilities and free school meal eligibility at Level 1/2, but these were small, possibly reflecting normal levels of fluctuation between years, and only affecting a small number of learners in any particular cohort. Some possible effects relating to some ethnic groups at Level 3 are also discussed, but there was a high degree of unreliability around these estimates that make drawing firm conclusions difficult.
It is important to note that using the methodology presented in the report we are only able to describe the changes that appear to have occurred. It is not possible to attribute a cause to any of these changes, and many possible causal factors may be at play, not just those related to the pandemic or assessment arrangements. These findings might also have differed had we been able to focus on different points in the grade scale and/or for a different period of time within the year.
Some continued monitoring around the difference in attainment between males and females may be needed to understand this further. Otherwise, a degree of change is expected in any given year, and the majority of findings reported here are likely to reflect normal fluctuations in outcomes from one year to the next. We shall continue to monitor the system in the months to come.
Introduction
Purpose
COVID-19 has continued to cause disruption to learning and assessments in 2021, as it did in 2020. Similar to last year, a number of mitigation measures have been put in place for VTQs.
The purpose of this report is to analyse the grades that were awarded in light of these circumstances for a number of VTQs, to monitor the relative results gaps between different groups of learners, according to their demographic and socio-economic characteristics (including protected characteristics).
We specifically focus on VTQs that tend to be used for progression to further or higher education, or for progression straight into employment. These are Applied General qualifications or qualifications otherwise included in the Department for Education’s performance tables (listed separately for Key Stage 4 qualifications and 16 to 18 qualifications, excluding Project qualifications, Advanced Extension Awards, GCSE, AS and A levels), and/or those having a qualification type of ‘Other General Qualification’.
The focus of this report is on issues related to equalities. We have also published a separate analysis of grades awarded for VTQs in spring and summer 2021 focussing on the volumes and grade distributions of grades issued for the 2021 VTQ cohort. Note that while this separate report also contained an analysis of grades for Functional Skills qualifications, we were not able to include those qualifications in the current report (see the ‘Awards data’ section to follow). An analysis of VTQ grades awarded in spring and summer 2020 covering both equalities and volumes or grade distributions, focussing on 2020 results, was published last year. However, due to improvements made to the methodology for the equalities analysis this year, the current report should be seen as the more up to date version for the 2020 results.
Equivalent reports have also been published for:
- summer 2021 results and student-level qualities analyses of GCSE, AS and A level
- 2021 VTQ results analysis
For more background information on how VTQs were awarded in 2021, please refer to the analysis of grades awarded for VTQs in spring and summer 2021.
Data source and methodology
Awards data
For the analyses contained within this report we used data collected from 26 awarding organisations for 737 qualifications (not including any separate routes or pathways within those qualifications). These were qualifications that were an:
- Applied General qualification
- other type of Performance Table qualification, excluding Project qualifications, Advanced Extension Awards, GCSE, AS and A levels
- Other General qualification
Awarding organisations (AOs) were asked to provide to Ofqual the qualification-level grades awarded to all learners in centres in England who took or would have taken assessments for these qualifications between 24 March 2021 and 31 July 2021. This period of time was chosen to be consistent with data collected for previous years (which was based on the period covered by the ERF). Where grades had not been fully finalised at the point of data submission, provisional grades were accepted.
For historical context, we used data relating to awards issued for the same types of qualifications in 2018, 2019, and 2020, which was collected in 2020. The specifics of that data has been described previously in the analysis of VTQ grades awarded in spring and summer 2020, although the details are much the same as described for the 2021 data (previous data covered the period of 20 March to 31 July, and the numbers of awarding organisations and qualifications slightly differed).
While we did also collect data on Functional Skills qualifications for use in our related report on volumes and grade distributions, several AOs were not able to provide fail grades to us. As many Functional Skills qualifications are graded on a pass or fail basis, this precluded their inclusion in the current report. Other qualifications graded pass or fail were also excluded.
We also focus only on Level 1/2 (including Level 1, Level 1/2, and Level 2) and Level 3 qualifications for these analyses. For Entry Level, because most grades were pass grades – also the top grade – and because few fail grades were present in the dataset, no meaningful analysis could be carried out.
Learner characteristics data
In order for us to conduct an analysis of equalities, we required more information on the demographic and socio-economic characteristics of learners than was present in the awards data collected from AOs. We therefore obtained supplementary datasets on prior attainment, also from AOs, and the Individualised Learner Record (ILR; maintained by the Education and Skills Funding Agency) and extracts of the National Pupil Database (NPD, controlled by the Department for Education).
These additional datasets were matched with the awards data. We used a series of match keys comprising of each learner’s first name, last name, date of birth, gender, qualification number and/or Unique Learners Number (ULN) to match records for the same leaner across the data sets. Cases from the awards data which could not be uniquely matched with cases in the supplementary datasets, and those which could be uniquely matched but had no relevant information available on learners’ characteristics of interest, had missing values reported in the corresponding fields of the combined data sets.
Data obtained from the AO prior attainment datasets included:
- a normalised mean Key Stage 2 score, which can range from 0 to 100, used as the prior attainment measure for Level 1, Level 1/2 and Level 2 qualifications
- a normalised mean GCSE score, which can range from 0 to 100, used as the prior attainment measure for Level 3 qualifications
For the purposes of our modelling, learners were divided into quintiles: ‘very low’, ‘low’, ‘medium’, ‘high’, and ‘very high’. Learners were assigned an ‘unknown’ prior attainment where they did not have matching records.
Data obtained from the ILR and NPD included information on the following learner characteristics. Gender was also obtained as part of the awards dataset. The list of learner characteristics therefore included:
- gender: Male, Female, other or unknown.
- ethnicity: categorisations were harmonised between the NPD and ILR for consistency and to align with the Government Statistical Service guidancewhere possible (some groups had to be merged into one of the ‘other’ groups, as numbers were too small to include as a separate category – for example, ‘Gypsy orIrish Traveller’ learners had to be merged into the ‘Any Other White Background’ group). We used 5 main ethnicity groups: White, Asian, Black, Mixed or Multiple ethnicity and any other ethnic group (AOEG). These were further broken down into:
- White: British, Irish, any other White background (AOWB),
- Asian: Indian, Pakistani, Bangladeshi, Chinese, any other Asian background (AOAB),
- Black: African, Caribbean, any other Black, African or Caribbean background (AOBACB),
- Mixed or Multiple: White and Black Caribbean, White and Black African, White and Asian, any other Mixed or Multiple ethnic background (AOMMB),
- any Other Ethnic Group (AOEG).
- Special Educational Needs and Disabilities (SEND) status: learner with or without SEND
- free school meals (FSM) eligibility: learner eligible or not eligible for free school meals – used as a measure of deprivation
- a measure of deprivation known as the Income Deprivation Affecting Children Index (IDACI) score, where higher scores indicate higher levels of local deprivation and lower scores indicate lower levels of local deprivation. For the purpose of our modelling, these scores were divided into quintiles: ‘very low’, ‘low’, ‘medium’, ‘high’, and ‘very high’
In each case, an ‘unknown’ category was applied for learners that did not have matching records.
Breakdowns of the frequencies of each of these categories can be found in the appendix.
Methodology
We will evaluate the impact of each demographic and socio-economic characteristic on learners’ results this year, once other factors are controlled for; the purpose being to examine the relationship of these characteristics and learners’ results (once other factors are controlled for) and how it has changed over several consecutive years.
It should be noted that any differences in attainment between groups of learners can have complex causes. Therefore, while we aim to report differences in attainment associated with gender, ethnicity and socio-economic status where they appear to exist, analyses of the underlying causes of any differences in attainment is outside the scope of this report.
We performed multivariable analyses, in which the effect of a variable on the achievement of ‘top grades’ can be examined while holding other variables constant. (By ‘top grades’ we mean the single highest or best grade that can be achieved in each qualification, which will depend upon the particular grading structure that has been adopted.) For example, we can compare the effect of being female vs being male on the achievement of ‘top grades’, while holding prior attainment and ethnicity constant. If there are no differences in female vs male effects, we can conclude that it was other factors – such as higher ability and/or ethnicity – and not their gender that led to learners’ differential performance.
We focus on the achievement of top grades rather than other points of the grading scale due to the variety of grading scales used in VTQs, making it difficult to select a suitable mid-point. If we were to break the analysis down into different grading scales, numbers would also likely become too small to allow for regression modelling. The lack of many fail grades in our data precluded the analysis of proportions of passing grades issued.
A mixed effect modelling approach was adopted whereby the learner characteristics described previously (including their prior attainment) were treated as fixed effects, and the learner’s centre was treated as a random effect. This is because there may be factors affecting results that only learners from the same centre have in common, such as teaching materials used at their school or college.
The logistic regression specification (available separately in an accessible document) used for modelling takes the form:
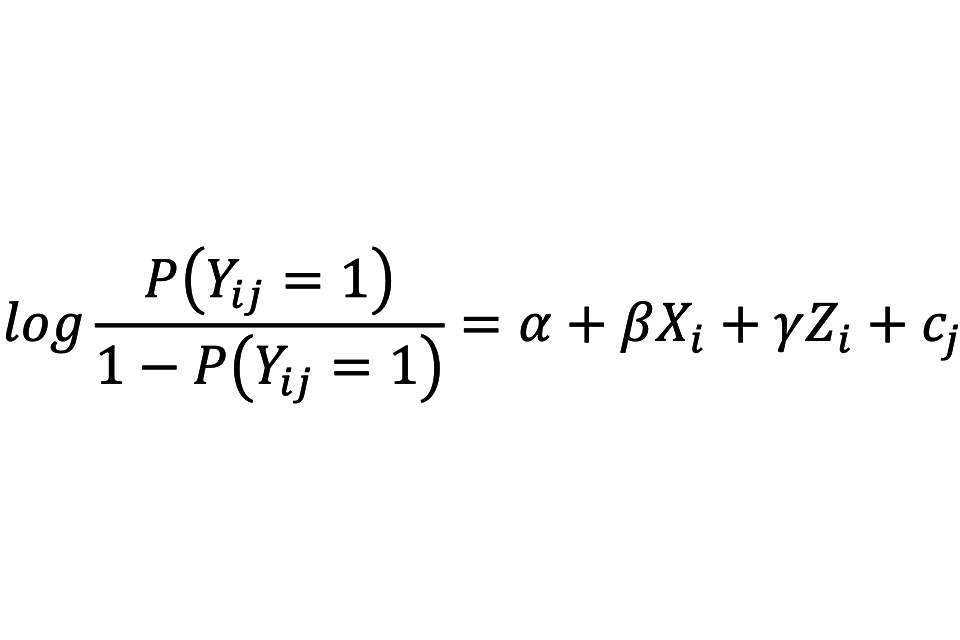
Accessible version of this equation is available as an OpenDocument file.
where:
- P(Yij = 1) is the dependant variable. It determines the probability of achieving a top grade for candidate i at centre j
- Xi is a set of independent fixed effect variables summarising the demographic and socio-economic characteristics of the candidate (see list of variables described above)
- Zi is an independent fixed effect variable determining the highest level of prior attainment of candidate i. It is an additional variable that is controlled for in the logistic regression analysis
- cj is a random effect determined by centre-level characteristics. It is also an additional variable that is controlled for in the logistic regression analysis
- α, β, γ are the regression coefficients
Within the above logistic regression specification, it is the estimate of the parameter β giving the relationship between each demographic or socio-economic characteristic and the dependant variable that is of most interest. We will also report the estimates of the parameter γ showing the relationship between learners’ prior attainment and the likelihood of achieving top grades. Prior attainment is a strong predictor of grades and should be presented along the demographic or socio-economic characteristics to facilitate a more accurate interpretation of effect size of variables. Multi-way interactions between the demographic and socio-economic variables listed above as well as prior attainment were not included in the analysis due to small sample sizes making the results less meaningful.
Logistic regression models were run for each year individually. We then evaluated their outputs to identify which effects have changed between 2021 and previous years. We considered both the statistical significance and the meaningfulness of the effects by:
- identifying which groups of learners were statistically significantly more or less likely to achieve top grades than the reference category in 2021, 2020 or 2019 (i.e. where the average marginal effects – the average difference in the probability of achieving top grades between two categories of learner characteristics – were statistically significantly different than 0)
- comparing the size of the average marginal effects of those variables between different years to evaluate how the relationship between each variable and the probability of achieving top grades differed between years – Changes in 2021 were considered ‘notable’ if:
- a. the difference between 2020 and 2021 was greater than the difference between 2018 and 2019, or
- b. the difference between 2019 and 2021 was larger than the difference between 2018 and 2019; and
- c. the difference between 2020 and 2021 or between 2019 and 2021 was larger than plus or minus 5 percentage points.
The purpose of these criteria is to ensure that changes are only interpreted as being ‘notable’ if they appear to be larger than the normal fluctuations that might be expected in any year. However, smaller changes will also be discussed in the sections to follow where apparent in the graphs.
Reporting
The impact of demographic and socio-economic characteristics on achieving top grades is reported in the graphs and tables to follow (and also in the appendix). For each year separately, these show a measure of effect size of each variable on the probability of achieving top grades. This is expressed in the form of the average marginal effect, representing an average difference in the probability of achieving top grades between two categories of a demographic or socio-economic characteristic.
For example, the marginal effect for gender shows how the probability of achieving top grades is predicted to differ for male learners (category of interest) compared to female learners (reference category) when the remaining variables (other categories) are held constant. Through these measures, we can assess the difference in relative achievement of top grades between different demographic groups.
The different reference categories are as follows: males are compared to females, minority ethnicity learners are compared to white British ethnicity learners, learners with SEND or FSM eligibility are compared to learners without SEND or FSM eligibility and low and high IDACI score learners are compared to medium IDACI score learners. These reference categories were chosen mostly on the basis of frequency, with the most frequent group being the reference category.
Asterisks in the graphs show which categories of demographic and socio-economic characteristic were statistically significant from its respective reference category in 2021, where *** = p<0.001; ** = p<0.01; * = p<0.05.
Readers should note that results are presented differently to our analysis of VTQ grades awarded in spring and summer 2020. In that report, we presented results in terms of odds ratios, which are less easily interpretable than average marginal effects. We have changed our approach this year for ease of presentation.
In the graphs, confidence intervals are also reported as horizontal lines around the points. Confidence intervals show the degree of possible error around the estimates, giving a range of plausible values rather than a definitive value.
Findings
While there are certain patterns of demographic differences in any year, the purpose of this analysis is to focus on whether there were any changes to these patterns, with a particular focus on 2021, including the possible introduction of sudden bias against any particular group of learners. The focus of these discussions is therefore on changes over time, not on any pre-existing differences in attainment.
Top grades over time for Level 1/2 qualifications
By ‘Level 1/2’, we include all qualifications in scope of this work at Level 1, Level 1/2, and Level 2. By ‘top grade’ we mean the single highest grade that a learner could have achieved in the qualification that learner has taken.
Table 1 shows the proportions of top grades each year for each qualification group. For both Other General and Performance Table qualifications, proportions increased between 2019 and 2020, and remained relatively stable between 2020 and 2021.
Table 1. Proportions of top grades achieved each year for Level 1/2 qualifications
| Qualification level | Qualification group | 2018, % | 2019, % | 2020, % | 2021, % |
|---|---|---|---|---|---|
| Level 1/2 | Other General qualifications | 9 | 12 | 22 | 22 |
| Level 1/2 | Performance Table qualifications | 11 | 8 | 13 | 11 |
Figure 1 and Table 2 show the results of the logistic regression analysis for Level 1/2 qualifications when considered as a single group. Only one change was ‘notable’ according to the criteria we previously outlined. Specifically, males were on average 2.2% less likely to achieve top grades than females in 2019, but this difference increased to 7.7% in 2020 and reduced slightly to 7.4% in 2021.
Three other changes did not meet our previous criteria – because the differences between years were small, meaning they could reflect some ‘normal’ levels of fluctuation between years and are likely to only affect a small number of learners in any particular cohort – but are nevertheless worth commenting upon:
- Learners with SEND were on average 3.6% less likely than learners without special educational needs or disabilities to achieve top grades in 2018 and 2.9% less likely in 2019, with this difference increasing to 5.8% in 2020, reducing to 5.3% in 2021.
- For learners eligible for Free School Meals, the average difference in probabilities increased from 2.3% in 2018 and 2.2% in 2019, to 4.0% in 2020, remaining the same in 2021.
- While not a main focus of the analysis, attainment gaps for very high prior attainment learners has also grown relative to medium prior attainment learners over the past 3 years. (Prior attainment is used as a measure of general ability.) Again, however, these trends exist in the difference between 2019 and 2020, with there being no difference between 2020 and 2021. It is worth noting that these effects are independent from other effects, such as ethnicity and the measures of deprivation.
No notable changes in 2021 were apparent for the other learner characteristics included in the model.
Figure 1. Equalities analysis for Level 1/2 qualifications


Notes: The vertical dashed line shows the point at which one can say that there is no difference in the average probability of achieving top grades between the category being observed and the reference category. Asterisks show which groups were statistically significant from their respective reference category in 2021, where *** = p<0.001; ** = p<0.01; * = p<0.05.
Table 2. Average marginal effects on the probability of achieving top grades with standard errors in brackets - Level 1/2 qualifications
| Factor | 2018 AME | 2018 p | 2019 AME | 2019 p | 2020 AME | 2020 p | 2021 AME | 2021 p |
|---|---|---|---|---|---|---|---|---|
| Ethnicity: White Irish | -0.024 (0.014) | 0.098 | 0.005 (0.012) | 0.635 | -0.015 (0.011) | 0.186 | -0.002 (0.011) | 0.848 |
| Ethnicity: AOWB | 0.001 (0.003) | 0.643 | 0.001 (0.002) | 0.56 | 0 (0.002) | 0.889 | 0.003 (0.002) | 0.161 |
| Ethnicity: White and Black Caribbean | -0.012 (0.006) | 0.036 | -0.012 (0.004) | 0.005 | -0.008 (0.004) | 0.063 | -0.009 (0.004) | 0.014 |
| Ethnicity: White and Black African | 0 (0.01) | 0.961 | 0.006 (0.007) | 0.388 | 0.006 (0.007) | 0.414 | 0.004 (0.006) | 0.493 |
| Ethnicity: White and Asian | 0.016 (0.008) | 0.047 | 0.013 (0.006) | 0.03 | 0.018 (0.005) | 0.001 | 0.011 (0.005) | 0.016 |
| Ethnicity: AOMMB | 0.01 (0.006) | 0.113 | 0.007 (0.005) | 0.119 | 0.009 (0.004) | 0.037 | 0.011 (0.004) | 0.006 |
| Ethnicity: Indian | 0.015 (0.006) | 0.013 | 0.01 (0.004) | 0.024 | 0.029 (0.004) | <0.001 | 0.033 (0.004) | <0.001 |
| Ethnicity: Pakistani | -0.006 (0.004) | 0.206 | -0.009 (0.003) | 0.005 | -0.003 (0.003) | 0.315 | 0.001 (0.003) | 0.674 |
| Ethnicity: Bangladeshi | 0.014 (0.007) | 0.049 | 0.015 (0.006) | 0.007 | 0.024 (0.005) | <0.001 | 0.019 (0.005) | <0.001 |
| Ethnicity: Chinese | 0.078 (0.017) | <0.001 | 0.025 (0.012) | 0.032 | 0.081 (0.011) | <0.001 | 0.075 (0.012) | <0.001 |
| Ethnicity: AOAB | 0.015 (0.007) | 0.029 | -0.005 (0.005) | 0.267 | 0.024 (0.005) | <0.001 | 0.025 (0.005) | <0.001 |
| Ethnicity: African | -0.01 (0.005) | 0.024 | -0.006 (0.003) | 0.071 | -0.009 (0.003) | 0.003 | -0.001 (0.003) | 0.66 |
| Ethnicity: Caribbean | -0.018 (0.006) | 0.005 | -0.012 (0.005) | 0.016 | -0.018 (0.005) | <0.001 | -0.009 (0.005) | 0.043 |
| Ethnicity: AOBACB | -0.011 (0.008) | 0.194 | -0.014 (0.006) | 0.027 | 0.009 (0.007) | 0.166 | -0.01 (0.005) | 0.076 |
| Ethnicity: AOEG | -0.009 (0.006) | 0.166 | -0.005 (0.005) | 0.276 | 0.005 (0.004) | 0.241 | 0.006 (0.004) | 0.151 |
| Ethnicity: Unknown | -0.011 (0.007) | 0.091 | -0.018 (0.005) | <0.001 | -0.014 (0.004) | 0.002 | -0.012 (0.004) | 0.002 |
| Gender: Male | -0.036 (0.001) | <0.001 | -0.022 (0.001) | <0.001 | -0.077 (0.001) | <0.001 | -0.074 (0.001) | <0.001 |
| Gender: Unknown | 0.121 (0.027) | <0.001 | 0.204 (0.02) | <0.001 | -0.015 (0.02) | 0.451 | 0.067 (0.012) | <0.001 |
| SEND: Yes | -0.036 (0.002) | <0.001 | -0.029 (0.001) | <0.001 | -0.058 (0.002) | <0.001 | -0.053 (0.001) | <0.001 |
| SEND: Unknown | 0.145 (0.007) | <0.001 | 0.164 (0.007) | <0.001 | 0.095 (0.008) | <0.001 | 0.082 (0.008) | <0.001 |
| FSM: Yes | -0.023 (0.002) | <0.001 | -0.022 (0.001) | <0.001 | -0.039 (0.001) | <0.001 | -0.04 (0.001) | <0.001 |
| FSM: Unknown | 0.062 (0.007) | <0.001 | 0.048 (0.006) | <0.001 | 0.006 (0.005) | 0.259 | -0.044 (0.012) | <0.001 |
| IDACI: Very low | 0.025 (0.003) | <0.001 | 0.022 (0.002) | <0.001 | 0.024 (0.002) | <0.001 | 0.027 (0.002) | <0.001 |
| IDACI: Low | 0.01 (0.002) | <0.001 | 0.012 (0.002) | <0.001 | 0.01 (0.002) | <0.001 | 0.011 (0.002) | <0.001 |
| IDACI: High | -0.01 (0.002) | <0.001 | -0.006 (0.002) | 0.001 | -0.013 (0.002) | <0.001 | -0.009 (0.002) | <0.001 |
| IDACI: Very high | -0.016 (0.003) | <0.001 | -0.012 (0.002) | <0.001 | -0.02 (0.002) | <0.001 | -0.018 (0.002) | <0.001 |
| IDACI: Unknown | -0.08 (0.005) | <0.001 | -0.057 (0.004) | <0.001 | -0.031 (0.006) | <0.001 | 0.003 (0.014) | 0.81 |
| Prior attainment: Very low | -0.041 (0.002) | <0.001 | -0.029 (0.002) | <0.001 | -0.063 (0.002) | <0.001 | -0.057 (0.002) | <0.001 |
| Prior attainment: Low | -0.03 (0.002) | <0.001 | -0.02 (0.002) | <0.001 | -0.036 (0.002) | <0.001 | -0.033 (0.002) | <0.001 |
| Prior attainment: High | 0.042 (0.003) | <0.001 | 0.038 (0.002) | <0.001 | 0.061 (0.002) | <0.001 | 0.053 (0.002) | <0.001 |
| Prior attainment: Very high | 0.148 (0.004) | <0.001 | 0.128 (0.003) | <0.001 | 0.171 (0.002) | <0.001 | 0.177 (0.003) | <0.001 |
| Prior attainment: Unknown | 0.016 (0.002) | <0.001 | 0.015 (0.002) | <0.001 | 0.018 (0.002) | <0.001 | 0.007 (0.002) | <0.001 |
For Level 1/2 Other General qualifications (Figure 2 and Table 3), the change for male learners did not meet our criteria, but males were on average 2.9% less likely to achieve top grades in 2020 compared to females, changing to 5.3% less likely in 2021. While learners with SEND were increasingly less likely to achieve top grades relative to learners with no special educational needs or disabilities between 2019 and 2020, the attainment gap in 2021 returned to similar levels as those present in 2019. There were similar changes for Bangladeshi, Chinese, and ‘White and Asian’ mixed ethnicity learners, albeit in the opposite direction, whereby these learners were increasingly more likely to achieve top grades than white British learners in 2020, but returned back to 2018 and 2019 levels in 2021. However, the wide confidence intervals for these groups cast uncertainty over these findings.
For Level 1/2 Performance Table qualifications (Figure 3 and Table 4), only the difference between males and females was notable according to our earlier criteria. On average, males in 2019 were 2.0% less likely than females to achieve top grades, which increased to 8.3% less likely in 2020, reducing to 7.5% less likely in 2021.
It is important to note that all the observations made above focus only on the differences that have occurred between years. Attainment gaps with respect to most other learner characteristics, such as most of the different ethnic groups and between learners with different IDACI scores, have not changed in any meaningful way between years. This is true both when Level 1/2 qualifications are treated as a single group and when broken down into Performance Table and Other General qualifications.
Figure 2. Equalities analysis for Level 1/2 Other General qualifications


Notes: The vertical dashed line shows the point at which one can say that there is no difference in the average probability of achieving top grades between the category being observed and the reference category. Asterisks show which groups were statistically significant from their respective reference category in 2021, where *** = p<0.001; ** = p<0.01; * = p<0.05.
Table 3. Average marginal effects on the probability of achieving top grades with standard errors in brackets - Level 1/2 Other General qualifications
| Factor | 2018 AME | 2018 p | 2019 AME | 2019 p | 2020 AME | 2020 p | 2021 AME | 2021 p |
|---|---|---|---|---|---|---|---|---|
| Ethnicity: White Irish | -0.026 (0.023) | 0.257 | 0 (0.031) | 0.991 | -0.026 (0.034) | 0.446 | -0.044 (0.034) | 0.204 |
| Ethnicity: AOWB | 0.011 (0.006) | 0.068 | 0.014 (0.008) | 0.079 | 0.042 (0.009) | <0.001 | 0.023 (0.009) | 0.014 |
| Ethnicity: White and Black Caribbean | -0.01 (0.011) | 0.367 | -0.026 (0.013) | 0.039 | -0.01 (0.019) | 0.573 | -0.036 (0.014) | 0.013 |
| Ethnicity: White and Black African | -0.008 (0.016) | 0.622 | 0.01 (0.024) | 0.66 | 0.035 (0.026) | 0.186 | 0.026 (0.026) | 0.327 |
| Ethnicity: White and Asian | 0.001 (0.012) | 0.93 | 0.005 (0.017) | 0.747 | 0.035 (0.016) | 0.032 | -0.018 (0.019) | 0.339 |
| Ethnicity: AOMMB | 0.004 (0.01) | 0.717 | 0.015 (0.014) | 0.277 | 0.031 (0.014) | 0.029 | -0.015 (0.015) | 0.304 |
| Ethnicity: Indian | 0.031 (0.011) | 0.006 | 0.021 (0.014) | 0.118 | 0.044 (0.01) | <0.001 | 0.032 (0.021) | 0.128 |
| Ethnicity: Pakistani | 0.009 (0.008) | 0.256 | 0.017 (0.011) | 0.12 | 0.012 (0.012) | 0.355 | 0.012 (0.015) | 0.436 |
| Ethnicity: Bangladeshi | 0.016 (0.013) | 0.201 | 0.001 (0.016) | 0.937 | 0.047 (0.018) | 0.008 | -0.013 (0.023) | 0.583 |
| Ethnicity: Chinese | 0.062 (0.028) | 0.027 | 0 (0.034) | 0.998 | 0.114 (0.022) | <0.001 | 0.025 (0.042) | 0.553 |
| Ethnicity: AOAB | 0.023 (0.012) | 0.048 | 0.009 (0.015) | 0.552 | 0.07 (0.013) | <0.001 | 0.057 (0.02) | 0.004 |
| Ethnicity: African | 0.002 (0.008) | 0.789 | -0.007 (0.01) | 0.483 | -0.013 (0.011) | 0.263 | -0.015 (0.012) | 0.181 |
| Ethnicity: Caribbean | 0 (0.011) | 0.993 | -0.035 (0.013) | 0.007 | -0.051 (0.021) | 0.016 | -0.063 (0.014) | <0.001 |
| Ethnicity: AOBACB | -0.003 (0.014) | 0.84 | -0.032 (0.017) | 0.063 | -0.023 (0.026) | 0.384 | -0.028 (0.018) | 0.107 |
| Ethnicity: AOEG | 0.003 (0.01) | 0.739 | 0.009 (0.014) | 0.528 | 0.028 (0.015) | 0.057 | -0.001 (0.014) | 0.966 |
| Ethnicity: Unknown | 0.006 (0.011) | 0.561 | -0.01 (0.014) | 0.482 | 0.025 (0.016) | 0.126 | -0.014 (0.016) | 0.378 |
| Gender: Male | -0.022 (0.002) | <0.001 | -0.033 (0.003) | <0.001 | -0.029 (0.004) | <0.001 | -0.053 (0.005) | <0.001 |
| Gender: Unknown | 0 (0.032) | 0.996 | 0.011 (0.029) | 0.695 | -0.027 (0.033) | 0.416 | -0.071 (0.019) | <0.001 |
| SEND: Yes | -0.01 (0.004) | 0.01 | -0.012 (0.005) | 0.009 | -0.063 (0.006) | <0.001 | -0.016 (0.008) | 0.05 |
| SEND: Unknown | 0.023 (0.009) | 0.006 | 0.035 (0.011) | 0.001 | 0.107 (0.019) | <0.001 | 0.106 (0.017) | <0.001 |
| FSM: Yes | -0.002 (0.004) | 0.536 | -0.007 (0.005) | 0.118 | -0.027 (0.008) | 0.001 | -0.021 (0.006) | <0.001 |
| FSM: Unknown | 0 (0.008) | 0.95 | 0.028 (0.011) | 0.012 | 0 (0.012) | 0.991 | 0.068 (0.145) | 0.64 |
| IDACI: Very low | 0.019 (0.005) | <0.001 | 0.016 (0.006) | 0.006 | 0.025 (0.007) | <0.001 | 0.023 (0.008) | 0.003 |
| IDACI: Low | 0.011 (0.004) | 0.009 | 0.004 (0.005) | 0.447 | 0.015 (0.007) | 0.026 | 0.004 (0.007) | 0.569 |
| IDACI: High | 0.001 (0.004) | 0.886 | 0.003 (0.006) | 0.556 | -0.007 (0.008) | 0.4 | -0.011 (0.007) | 0.115 |
| IDACI: Very high | 0.001 (0.005) | 0.895 | -0.003 (0.006) | 0.574 | -0.019 (0.009) | 0.035 | -0.02 (0.007) | 0.008 |
| IDACI: Unknown | -0.011 (0.012) | 0.353 | -0.003 (0.016) | 0.863 | -0.052 (0.021) | 0.015 | -0.104 (0.051) | 0.041 |
| Prior attainment: Very low | -0.003 (0.004) | 0.373 | -0.005 (0.005) | 0.272 | -0.001 (0.008) | 0.865 | 0.007 (0.008) | 0.335 |
| Prior attainment: Low | -0.01 (0.004) | 0.008 | -0.006 (0.005) | 0.222 | -0.012 (0.008) | 0.151 | 0.006 (0.008) | 0.458 |
| Prior attainment: High | 0.012 (0.004) | 0.006 | 0.016 (0.005) | 0.002 | 0.005 (0.008) | 0.521 | 0.035 (0.011) | 0.002 |
| Prior attainment: Very high | 0.076 (0.005) | <0.001 | 0.105 (0.007) | <0.001 | 0.129 (0.008) | <0.001 | 0.123 (0.016) | <0.001 |
| Prior attainment: Unknown | 0.016 (0.004) | <0.001 | 0.018 (0.004) | <0.001 | 0.065 (0.007) | <0.001 | 0.021 (0.008) | 0.005 |
Figure 3. Equalities analysis for Level 1/2 Performance Table qualifications


Notes: The vertical dashed line shows the point at which one can say that there is no difference in the average probability of achieving top grades between the category being observed and the reference category. Asterisks show which groups were statistically significant from their respective reference category in 2021, where *** = p<0.001; ** = p<0.01; * = p<0.05.
Table 4. Average marginal effects on the probability of achieving top grades with standard errors in brackets - Level 1/2 Performance Table qualifications
| Factor | 2018 AME | 2018 p | 2019 AME | 2019 p | 2020 AME | 2020 p | 2021 AME | 2021 p |
|---|---|---|---|---|---|---|---|---|
| Ethnicity: White Irish | -0.02 (0.017) | 0.252 | 0.007 (0.012) | 0.564 | -0.009 (0.012) | 0.422 | 0.002 (0.011) | 0.889 |
| Ethnicity: AOWB | 0.001 (0.004) | 0.796 | 0.001 (0.003) | 0.793 | 0 (0.003) | 0.934 | 0.001 (0.002) | 0.515 |
| Ethnicity: White and Black Caribbean | -0.011 (0.007) | 0.093 | -0.008 (0.005) | 0.075 | -0.007 (0.004) | 0.079 | -0.008 (0.004) | 0.053 |
| Ethnicity: White and Black African | 0.007 (0.012) | 0.533 | 0.008 (0.008) | 0.284 | 0.002 (0.007) | 0.792 | 0.003 (0.006) | 0.673 |
| Ethnicity: White and Asian | 0.026 (0.01) | 0.01 | 0.015 (0.006) | 0.019 | 0.017 (0.006) | 0.002 | 0.013 (0.005) | 0.007 |
| Ethnicity: AOMMB | 0.015 (0.008) | 0.043 | 0.006 (0.005) | 0.186 | 0.007 (0.004) | 0.081 | 0.012 (0.004) | 0.002 |
| Ethnicity: Indian | 0.016 (0.007) | 0.026 | 0.009 (0.004) | 0.037 | 0.032 (0.004) | <0.001 | 0.033 (0.004) | <0.001 |
| Ethnicity: Pakistani | -0.007 (0.005) | 0.17 | -0.01 (0.003) | 0.002 | -0.001 (0.003) | 0.63 | 0.001 (0.003) | 0.663 |
| Ethnicity: Bangladeshi | 0.025 (0.009) | 0.005 | 0.02 (0.006) | 0.001 | 0.022 (0.005) | <0.001 | 0.02 (0.005) | <0.001 |
| Ethnicity: Chinese | 0.085 (0.02) | <0.001 | 0.032 (0.012) | 0.009 | 0.077 (0.013) | <0.001 | 0.079 (0.012) | <0.001 |
| Ethnicity: AOAB | 0.018 (0.008) | 0.027 | -0.006 (0.005) | 0.246 | 0.019 (0.005) | <0.001 | 0.022 (0.005) | <0.001 |
| Ethnicity: African | -0.009 (0.006) | 0.096 | -0.004 (0.004) | 0.26 | -0.005 (0.003) | 0.091 | 0 (0.003) | 0.982 |
| Ethnicity: Caribbean | -0.02 (0.007) | 0.007 | -0.007 (0.005) | 0.16 | -0.012 (0.005) | 0.013 | -0.004 (0.005) | 0.395 |
| Ethnicity: AOBACB | -0.012 (0.01) | 0.249 | -0.01 (0.007) | 0.134 | 0.015 (0.007) | 0.024 | -0.008 (0.006) | 0.151 |
| Ethnicity: AOEG | -0.01 (0.008) | 0.206 | -0.004 (0.005) | 0.437 | 0.006 (0.005) | 0.168 | 0.008 (0.004) | 0.081 |
| Ethnicity: Unknown | -0.02 (0.008) | 0.014 | -0.022 (0.005) | <0.001 | -0.021 (0.004) | <0.001 | -0.013 (0.004) | 0.002 |
| Gender: Male | -0.043 (0.002) | <0.001 | -0.02 (0.001) | <0.001 | -0.083 (0.001) | <0.001 | -0.075 (0.001) | <0.001 |
| Gender: Unknown | 0.274 (0.05) | <0.001 | 0.252 (0.025) | <0.001 | 0.015 (0.031) | 0.626 | 0.13 (0.016) | <0.001 |
| SEND: Yes | -0.045 (0.002) | <0.001 | -0.032 (0.002) | <0.001 | -0.053 (0.002) | <0.001 | -0.052 (0.001) | <0.001 |
| SEND: Unknown | 0.181 (0.008) | <0.001 | 0.197 (0.008) | <0.001 | 0.094 (0.01) | <0.001 | 0.117 (0.011) | <0.001 |
| FSM: Yes | -0.03 (0.002) | <0.001 | -0.023 (0.001) | <0.001 | -0.037 (0.001) | <0.001 | -0.041 (0.001) | <0.001 |
| FSM: Unknown | 0.145 (0.011) | <0.001 | 0.092 (0.009) | <0.001 | 0.07 (0.009) | <0.001 | -0.061 (0.01) | <0.001 |
| IDACI: Very low | 0.026 (0.003) | <0.001 | 0.021 (0.002) | <0.001 | 0.024 (0.002) | <0.001 | 0.027 (0.002) | <0.001 |
| IDACI: Low | 0.01 (0.003) | 0.001 | 0.012 (0.002) | <0.001 | 0.009 (0.002) | <0.001 | 0.011 (0.002) | <0.001 |
| IDACI: High | -0.013 (0.003) | <0.001 | -0.007 (0.002) | <0.001 | -0.013 (0.002) | <0.001 | -0.009 (0.002) | <0.001 |
| IDACI: Very high | -0.02 (0.003) | <0.001 | -0.012 (0.002) | <0.001 | -0.019 (0.002) | <0.001 | -0.018 (0.002) | <0.001 |
| IDACI: Unknown | -0.104 (0.005) | <0.001 | -0.068 (0.003) | <0.001 | -0.061 (0.005) | <0.001 | 0.008 (0.015) | 0.578 |
| Prior attainment: Very low | -0.065 (0.003) | <0.001 | -0.037 (0.002) | <0.001 | -0.067 (0.002) | <0.001 | -0.065 (0.002) | <0.001 |
| Prior attainment: Low | -0.039 (0.003) | <0.001 | -0.023 (0.002) | <0.001 | -0.037 (0.002) | <0.001 | -0.035 (0.002) | <0.001 |
| Prior attainment: High | 0.055 (0.003) | <0.001 | 0.041 (0.002) | <0.001 | 0.064 (0.002) | <0.001 | 0.052 (0.002) | <0.001 |
| Prior attainment: Very high | 0.18 (0.004) | <0.001 | 0.13 (0.003) | <0.001 | 0.182 (0.003) | <0.001 | 0.176 (0.003) | <0.001 |
| Prior attainment: Unknown | 0.011 (0.003) | <0.001 | 0.013 (0.002) | <0.001 | 0.003 (0.002) | 0.039 | 0.006 (0.002) | <0.001 |
Top grades over time for Level 3 qualifications
Table 5 shows the proportions of top grades each year for each qualification group. The proportion of top grades increased slightly across all qualification groups in 2021 compared to 2020.
Table 5. Proportions of top grades achieved each year for breakdowns by qualifications group – Level 3 qualifications.
| Qualification level | Qualification group | 2018, % | 2019, % | 2020, % | 2021, % |
|---|---|---|---|---|---|
| Level 3 | Other General qualifications | 24 | 25 | 27 | 30 |
| Level 3 | Applied General Qualifications | 5 | 6 | 16 | 17 |
| Level 3 | Other Performance Table qualifications | 18 | 18 | 21 | 26 |
The results of the logistic regression for Level 3 qualifications overall are reported in Figure 4 and Table 6. When Level 3 qualifications are treated as a single group, none of the changes were flagged as being notable according to our earlier criteria. However, some similar trends to those reported for Level 1/2 are apparent, albeit in a smaller way.
Firstly, males were on average 1.1% and 1.5% less likely to achieve top grades than females in 2018 and 2019 respectively, which increased to 4.2% in 2020, and increased again to 5.9% in 2021.
Secondly, learners assigned to the ‘very low’ prior attainment group were on average 4.0% less likely to achieve top grades compared to their middle ability peers in 2019. This difference increased to 7.2% in 2020, increasingly slightly again to 8.5% in 2021. Some small increase in the attainment gap over time between high and medium prior attainment learners was also observed.
Figure 4. Equalities analysis for Level 3 qualifications


Notes: The vertical dashed line shows the point at which one can say that there is no difference in the average probability of achieving top grades between the category being observed and the reference category. Asterisks show which groups were statistically significant from their respective reference category in 2021, where *** = p<0.001; ** = p<0.01; * = p<0.05.
Table 6. Average marginal effects on the probability of achieving top grades with standard errors in brackets - Level 3 qualifications
| Factor | 2018 AME | 2018 p | 2019 AME | 2019 p | 2020 AME | 2020 p | 2021 AME | 2021 p |
|---|---|---|---|---|---|---|---|---|
| Ethnicity: White Irish | 0.027 (0.022) | 0.228 | 0.006 (0.018) | 0.724 | -0.002 (0.02) | 0.938 | -0.012 (0.014) | 0.407 |
| Ethnicity: AOWB | -0.005 (0.005) | 0.386 | -0.005 (0.005) | 0.268 | -0.01 (0.005) | 0.043 | -0.01 (0.004) | 0.005 |
| Ethnicity: White and Black Caribbean | -0.023 (0.011) | 0.026 | -0.027 (0.01) | 0.004 | -0.038 (0.009) | <0.001 | -0.024 (0.007) | 0.001 |
| Ethnicity: White and Black African | -0.003 (0.016) | 0.826 | -0.043 (0.012) | 0.001 | -0.039 (0.013) | 0.004 | -0.062 (0.009) | <0.001 |
| Ethnicity: White and Asian | 0.003 (0.011) | 0.756 | -0.025 (0.009) | 0.007 | -0.014 (0.01) | 0.178 | -0.009 (0.007) | 0.201 |
| Ethnicity: AOMMB | -0.017 (0.009) | 0.043 | -0.016 (0.008) | 0.051 | -0.029 (0.008) | <0.001 | -0.029 (0.006) | <0.001 |
| Ethnicity: Indian | -0.015 (0.006) | 0.02 | -0.01 (0.006) | 0.105 | -0.006 (0.006) | 0.329 | 0.01 (0.005) | 0.065 |
| Ethnicity: Pakistani | -0.03 (0.007) | <0.001 | -0.053 (0.006) | <0.001 | -0.036 (0.006) | <0.001 | -0.04 (0.005) | <0.001 |
| Ethnicity: Bangladeshi | -0.019 (0.01) | 0.063 | -0.026 (0.009) | 0.004 | -0.034 (0.008) | <0.001 | -0.043 (0.006) | <0.001 |
| Ethnicity: Chinese | 0.017 (0.014) | 0.225 | 0.021 (0.014) | 0.142 | 0.025 (0.016) | 0.129 | 0.018 (0.012) | 0.137 |
| Ethnicity: AOAB | -0.023 (0.007) | 0.002 | -0.033 (0.007) | <0.001 | -0.029 (0.007) | <0.001 | -0.02 (0.006) | 0.001 |
| Ethnicity: African | -0.067 (0.006) | <0.001 | -0.062 (0.006) | <0.001 | -0.056 (0.005) | <0.001 | -0.071 (0.004) | <0.001 |
| Ethnicity: Caribbean | -0.044 (0.01) | <0.001 | -0.039 (0.009) | <0.001 | -0.054 (0.009) | <0.001 | -0.061 (0.007) | <0.001 |
| Ethnicity: AOBACB | -0.069 (0.012) | <0.001 | -0.06 (0.012) | <0.001 | -0.059 (0.011) | <0.001 | -0.068 (0.008) | <0.001 |
| Ethnicity: AOEG | -0.028 (0.009) | 0.003 | -0.022 (0.008) | 0.007 | -0.018 (0.008) | 0.023 | -0.026 (0.006) | <0.001 |
| Ethnicity: Unknown | 0.002 (0.01) | 0.816 | -0.007 (0.009) | 0.419 | -0.008 (0.009) | 0.321 | -0.018 (0.007) | 0.012 |
| Gender: Male | -0.011 (0.002) | <0.001 | -0.015 (0.002) | <0.001 | -0.042 (0.002) | <0.001 | -0.059 (0.002) | <0.001 |
| Gender: Unknown | -0.008 (0.008) | 0.275 | 0.062 (0.011) | <0.001 | -0.022 (0.017) | 0.212 | -0.014 (0.012) | 0.254 |
| SEND: Yes | -0.012 (0.005) | 0.022 | -0.003 (0.005) | 0.582 | -0.006 (0.004) | 0.173 | -0.021 (0.004) | <0.001 |
| SEND: Unknown | 0.031 (0.004) | <0.001 | 0.033 (0.004) | <0.001 | 0.039 (0.006) | <0.001 | 0.032 (0.006) | <0.001 |
| FSM: Yes | -0.003 (0.006) | 0.544 | -0.005 (0.004) | 0.217 | -0.019 (0.008) | 0.011 | -0.014 (0.003) | <0.001 |
| FSM: Unknown | -0.01 (0.004) | 0.008 | -0.001 (0.004) | 0.861 | -0.028 (0.005) | <0.001 | -0.048 (0.02) | 0.018 |
| IDACI: Very low | 0.01 (0.004) | 0.01 | 0.01 (0.004) | 0.005 | 0.001 (0.004) | 0.721 | 0.018 (0.003) | <0.001 |
| IDACI: Low | 0.007 (0.004) | 0.06 | 0.001 (0.004) | 0.818 | -0.002 (0.004) | 0.661 | 0.008 (0.003) | 0.003 |
| IDACI: High | -0.004 (0.004) | 0.276 | -0.004 (0.004) | 0.29 | -0.009 (0.004) | 0.023 | -0.015 (0.003) | <0.001 |
| IDACI: Very high | -0.018 (0.004) | <0.001 | -0.011 (0.004) | 0.006 | -0.01 (0.004) | 0.012 | -0.023 (0.003) | <0.001 |
| IDACI: Unknown | -0.013 (0.011) | 0.242 | -0.023 (0.01) | 0.019 | -0.05 (0.01) | <0.001 | 0.034 (0.023) | 0.132 |
| Prior attainment: Very low | -0.034 (0.002) | <0.001 | -0.04 (0.002) | <0.001 | -0.072 (0.002) | <0.001 | -0.085 (0.003) | <0.001 |
| Prior attainment: Low | -0.023 (0.002) | <0.001 | -0.028 (0.002) | <0.001 | -0.046 (0.002) | <0.001 | -0.052 (0.002) | <0.001 |
| Prior attainment: High | 0.066 (0.003) | <0.001 | 0.068 (0.003) | <0.001 | 0.081 (0.003) | <0.001 | 0.095 (0.003) | <0.001 |
| Prior attainment: Very high | 0.201 (0.004) | <0.001 | 0.223 (0.004) | <0.001 | 0.264 (0.004) | <0.001 | 0.231 (0.004) | <0.001 |
| Prior attainment: Unknown | 0.069 (0.003) | <0.001 | 0.065 (0.003) | <0.001 | 0.051 (0.003) | <0.001 | 0.074 (0.003) | <0.001 |
These effects were slightly more evident in Applied Generals than other Performance Table qualifications. For example, the (negative) average difference between males and females in the probability of achieving top grades in Applied Generals changed from 1.5% in 2019 to 6.5% in 2021 (Figure 5 and Table 7). There was also some spreading in the attainment gaps between learners of different levels of prior attainment.
For other Performance Table qualifications (Figure 6 and Table 8), the average probability for males relative to females changed from 0.5% in 2019 to -3.5% in 2021. Changes for learners with different levels of prior attainment were much less noticeable here. Some notable change with respect to ‘White and Black African’ mixed ethnicity learners in other Performance Table qualifications may have occurred, with the point estimates decreasing from -2.6% in 2019 to -9.5% in 2021, but there are quite wide confidence intervals around these estimates, introducing some uncertainty in this finding.
For Level 3 Other General qualifications (Figure 7 and Table 9), notable changes were also flagged according to our earlier criteria with respect to Bangladeshi, African, and ‘Any other Black, African or Caribbean background’. However, the wide confidence intervals of the effect estimates for these groups again cast uncertainty around those findings. No notable changes occurred for any other ethnic groups.
As before, the preceding text focusses on the changes that can be observed. Attainment gaps with respect to most other learner characteristics have not changed between years.
Figure 5. Equalities analysis for Level 3 Applied General qualifications


Notes: The vertical dashed line shows the point at which one can say that there is no difference in the average probability of achieving top grades between the category being observed and the reference category. Asterisks show which groups were statistically significant from their respective reference category in 2021, where *** = p<0.001; ** = p<0.01; * = p<0.05.
Table 7. Average marginal effects on the probability of achieving top grades with standard errors in brackets - Level 3 Applied General qualifications
| Factor | 2018 AME | 2018 p | 2019 AME | 2019 p | 2020 AME | 2020 p | 2021 AME | 2021 p |
|---|---|---|---|---|---|---|---|---|
| Ethnicity: White Irish | -0.004 (0.017) | 0.825 | 0.003 (0.016) | 0.832 | -0.035 (0.02) | 0.081 | -0.017 (0.017) | 0.317 |
| Ethnicity: AOWB | -0.005 (0.004) | 0.245 | -0.01 (0.004) | 0.023 | -0.007 (0.005) | 0.209 | -0.008 (0.004) | 0.073 |
| Ethnicity: White and Black Caribbean | -0.011 (0.008) | 0.182 | -0.015 (0.008) | 0.055 | -0.043 (0.009) | <0.001 | -0.023 (0.008) | 0.002 |
| Ethnicity: White and Black African | -0.004 (0.012) | 0.742 | -0.035 (0.01) | <0.001 | -0.03 (0.015) | 0.043 | -0.038 (0.011) | <0.001 |
| Ethnicity: White and Asian | -0.007 (0.009) | 0.417 | -0.017 (0.009) | 0.055 | -0.012 (0.012) | 0.332 | -0.007 (0.008) | 0.405 |
| Ethnicity: AOMMB | -0.015 (0.006) | 0.018 | -0.005 (0.007) | 0.495 | -0.017 (0.009) | 0.051 | -0.024 (0.007) | <0.001 |
| Ethnicity: Indian | -0.001 (0.005) | 0.804 | 0.003 (0.006) | 0.618 | 0 (0.007) | 0.996 | 0.018 (0.006) | 0.004 |
| Ethnicity: Pakistani | -0.007 (0.005) | 0.119 | -0.02 (0.004) | <0.001 | -0.021 (0.006) | <0.001 | -0.018 (0.005) | <0.001 |
| Ethnicity: Bangladeshi | -0.004 (0.007) | 0.531 | -0.009 (0.006) | 0.138 | -0.016 (0.008) | 0.056 | -0.019 (0.006) | 0.003 |
| Ethnicity: Chinese | 0.011 (0.016) | 0.464 | 0.009 (0.016) | 0.563 | 0.004 (0.02) | 0.842 | 0.024 (0.018) | 0.173 |
| Ethnicity: AOAB | -0.002 (0.006) | 0.771 | -0.016 (0.006) | 0.007 | -0.03 (0.008) | <0.001 | -0.013 (0.007) | 0.055 |
| Ethnicity: African | -0.021 (0.004) | <0.001 | -0.026 (0.004) | <0.001 | -0.036 (0.006) | <0.001 | -0.049 (0.004) | <0.001 |
| Ethnicity: Caribbean | -0.013 (0.007) | 0.091 | -0.024 (0.008) | 0.001 | -0.037 (0.01) | <0.001 | -0.043 (0.007) | <0.001 |
| Ethnicity: AOBACB | -0.034 (0.008) | <0.001 | -0.021 (0.01) | 0.028 | -0.037 (0.012) | 0.001 | -0.046 (0.008) | <0.001 |
| Ethnicity: AOEG | -0.007 (0.008) | 0.324 | -0.007 (0.007) | 0.292 | -0.007 (0.009) | 0.392 | -0.003 (0.007) | 0.639 |
| Ethnicity: Unknown | 0.001 (0.009) | 0.87 | 0.002 (0.008) | 0.835 | -0.003 (0.009) | 0.761 | -0.018 (0.007) | 0.014 |
| Gender: Male | -0.018 (0.002) | <0.001 | -0.015 (0.002) | <0.001 | -0.046 (0.002) | <0.001 | -0.065 (0.002) | <0.001 |
| Gender: Unknown | -0.057 (0.002) | <0.001 | -0.067 (0.002) | <0.001 | -0.18 (0.004) | <0.001 | -0.074 (0.067) | 0.267 |
| SEND: Yes | -0.004 (0.004) | 0.381 | 0.001 (0.004) | 0.804 | -0.004 (0.005) | 0.33 | -0.011 (0.004) | 0.009 |
| SEND: Unknown | 0.003 (0.008) | 0.745 | 0.011 (0.009) | 0.206 | 0.027 (0.013) | 0.045 | 0.056 (0.015) | <0.001 |
| FSM: Yes | 0.001 (0.004) | 0.831 | -0.002 (0.003) | 0.568 | -0.016 (0.011) | 0.15 | -0.01 (0.003) | 0.001 |
| FSM: Unknown | 0.002 (0.006) | 0.759 | 0.002 (0.006) | 0.696 | 0.011 (0.008) | 0.165 | -0.046 (0.026) | 0.079 |
| IDACI: Very low | 0.002 (0.003) | 0.562 | 0.003 (0.003) | 0.43 | -0.001 (0.004) | 0.824 | 0.015 (0.003) | <0.001 |
| IDACI: Low | 0.001 (0.003) | 0.764 | -0.003 (0.003) | 0.38 | -0.001 (0.004) | 0.728 | 0.007 (0.003) | 0.015 |
| IDACI: High | -0.005 (0.003) | 0.104 | -0.004 (0.003) | 0.227 | -0.004 (0.004) | 0.319 | -0.01 (0.003) | 0.001 |
| IDACI: Very high | -0.008 (0.003) | 0.013 | -0.003 (0.003) | 0.388 | -0.01 (0.004) | 0.027 | -0.017 (0.003) | <0.001 |
| IDACI: Unknown | -0.015 (0.01) | 0.157 | -0.028 (0.01) | 0.003 | -0.052 (0.015) | <0.001 | 0.02 (0.031) | 0.504 |
| Prior attainment: Very low | -0.022 (0.002) | <0.001 | -0.027 (0.002) | <0.001 | -0.068 (0.003) | <0.001 | -0.086 (0.003) | <0.001 |
| Prior attainment: Low | -0.015 (0.002) | <0.001 | -0.019 (0.002) | <0.001 | -0.039 (0.003) | <0.001 | -0.052 (0.003) | <0.001 |
| Prior attainment: High | 0.043 (0.003) | <0.001 | 0.053 (0.003) | <0.001 | 0.076 (0.003) | <0.001 | 0.098 (0.003) | <0.001 |
| Prior attainment: Very high | 0.169 (0.006) | <0.001 | 0.196 (0.005) | <0.001 | 0.264 (0.005) | <0.001 | 0.28 (0.005) | <0.001 |
| Prior attainment: Unknown | 0.019 (0.003) | <0.001 | 0.026 (0.003) | <0.001 | 0.026 (0.004) | <0.001 | 0.01 (0.003) | 0.004 |
Figure 6. Equalities analysis for Level 3 Other Performance Table qualifications


Notes: The vertical dashed line shows the point at which one can say that there is no difference in the average probability of achieving top grades between the category being observed and the reference category. Asterisks show which groups were statistically significant from their respective reference category in 2021, where *** = p<0.001; ** = p<0.01; * = p<0.05.
Table 8. Average marginal effects on the probability of achieving top grades with standard errors in brackets - Level 3 Other Performance Table qualifications
| Factor | 2018 AME | 2018 p | 2019 AME | 2019 p | 2020 AME | 2020 p | 2021 AME | 2021 p |
|---|---|---|---|---|---|---|---|---|
| Ethnicity: White Irish | 0.076 (0.042) | 0.067 | -0.002 (0.034) | 0.959 | 0.09 (0.049) | 0.068 | -0.005 (0.029) | 0.856 |
| Ethnicity: AOWB | -0.001 (0.01) | 0.91 | -0.019 (0.009) | 0.042 | -0.022 (0.011) | 0.045 | -0.009 (0.007) | 0.222 |
| Ethnicity: White and Black Caribbean | -0.06 (0.023) | 0.008 | -0.032 (0.023) | 0.172 | -0.008 (0.025) | 0.741 | -0.006 (0.02) | 0.743 |
| Ethnicity: White and Black African | 0.035 (0.041) | 0.392 | -0.026 (0.027) | 0.345 | -0.064 (0.029) | 0.027 | -0.095 (0.021) | <0.001 |
| Ethnicity: White and Asian | 0.004 (0.019) | 0.815 | -0.033 (0.016) | 0.041 | -0.024 (0.019) | 0.206 | -0.01 (0.015) | 0.471 |
| Ethnicity: AOMMB | -0.016 (0.017) | 0.326 | 0.005 (0.017) | 0.743 | -0.045 (0.016) | 0.005 | -0.023 (0.012) | 0.061 |
| Ethnicity: Indian | -0.021 (0.011) | 0.06 | -0.017 (0.01) | 0.105 | -0.017 (0.012) | 0.162 | 0.014 (0.01) | 0.17 |
| Ethnicity: Pakistani | -0.032 (0.014) | 0.026 | -0.064 (0.012) | <0.001 | -0.058 (0.013) | <0.001 | -0.019 (0.014) | 0.166 |
| Ethnicity: Bangladeshi | -0.02 (0.024) | 0.403 | -0.025 (0.021) | 0.234 | -0.06 (0.019) | 0.001 | -0.043 (0.018) | 0.017 |
| Ethnicity: Chinese | 0.014 (0.022) | 0.508 | 0.014 (0.022) | 0.53 | 0.066 (0.031) | 0.036 | 0.029 (0.018) | 0.11 |
| Ethnicity: AOAB | -0.032 (0.014) | 0.019 | -0.051 (0.012) | <0.001 | -0.014 (0.015) | 0.35 | -0.013 (0.013) | 0.321 |
| Ethnicity: African | -0.113 (0.014) | <0.001 | -0.072 (0.013) | <0.001 | -0.078 (0.013) | <0.001 | -0.072 (0.009) | <0.001 |
| Ethnicity: Caribbean | -0.087 (0.022) | <0.001 | -0.022 (0.026) | 0.411 | -0.106 (0.023) | <0.001 | -0.074 (0.02) | <0.001 |
| Ethnicity: AOBACB | -0.086 (0.028) | 0.003 | -0.138 (0.022) | <0.001 | -0.081 (0.026) | 0.002 | -0.11 (0.024) | <0.001 |
| Ethnicity: AOEG | -0.035 (0.019) | 0.068 | -0.025 (0.017) | 0.133 | -0.039 (0.018) | 0.03 | -0.04 (0.014) | 0.005 |
| Ethnicity: Unknown | -0.012 (0.02) | 0.538 | -0.019 (0.019) | 0.32 | -0.009 (0.019) | 0.617 | 0.004 (0.016) | 0.777 |
| Gender: Male | 0.012 (0.003) | <0.001 | 0.005 (0.003) | 0.102 | -0.018 (0.003) | <0.001 | -0.035 (0.003) | <0.001 |
| Gender: Unknown | -0.019 (0.01) | 0.058 | 0.055 (0.013) | <0.001 | -0.028 (0.025) | 0.265 | -0.016 (0.016) | 0.338 |
| SEND: Yes | 0.005 (0.012) | 0.658 | -0.003 (0.009) | 0.75 | -0.005 (0.011) | 0.664 | -0.03 (0.009) | 0.001 |
| SEND: Unknown | 0.023 (0.008) | 0.004 | 0.043 (0.007) | <0.001 | 0.012 (0.013) | 0.375 | 0.003 (0.009) | 0.736 |
| FSM: Yes | 0.006 (0.015) | 0.694 | 0.002 (0.012) | 0.85 | -0.047 (0.018) | 0.008 | -0.023 (0.008) | 0.005 |
| FSM: Unknown | -0.037 (0.006) | <0.001 | -0.021 (0.006) | 0.001 | -0.064 (0.008) | <0.001 | -0.086 (0.043) | 0.047 |
| IDACI: Very low | 0.012 (0.007) | 0.068 | 0.013 (0.007) | 0.067 | 0.006 (0.008) | 0.453 | 0.016 (0.006) | 0.005 |
| IDACI: Low | 0.01 (0.007) | 0.141 | 0.002 (0.007) | 0.802 | -0.002 (0.008) | 0.809 | 0.01 (0.005) | 0.076 |
| IDACI: High | -0.007 (0.008) | 0.37 | -0.004 (0.008) | 0.663 | -0.013 (0.009) | 0.138 | -0.015 (0.006) | 0.01 |
| IDACI: Very high | -0.018 (0.009) | 0.045 | -0.016 (0.009) | 0.081 | -0.009 (0.01) | 0.36 | -0.022 (0.006) | 0.001 |
| IDACI: Unknown | 0.009 (0.021) | 0.661 | -0.039 (0.021) | 0.065 | -0.04 (0.023) | 0.085 | 0.072 (0.046) | 0.12 |
| Prior attainment: Very low | -0.039 (0.004) | <0.001 | -0.043 (0.004) | <0.001 | -0.069 (0.005) | <0.001 | -0.063 (0.006) | <0.001 |
| Prior attainment: Low | -0.017 (0.005) | 0.001 | -0.021 (0.005) | <0.001 | -0.044 (0.005) | <0.001 | -0.035 (0.006) | <0.001 |
| Prior attainment: High | 0.064 (0.006) | <0.001 | 0.06 (0.005) | <0.001 | 0.079 (0.006) | <0.001 | 0.072 (0.006) | <0.001 |
| Prior attainment: Very high | 0.193 (0.007) | <0.001 | 0.201 (0.006) | <0.001 | 0.254 (0.007) | <0.001 | 0.202 (0.007) | <0.001 |
| Prior attainment: Unknown | 0.128 (0.006) | <0.001 | 0.121 (0.005) | <0.001 | 0.11 (0.006) | <0.001 | 0.156 (0.006) | <0.001 |
Figure 7. Equalities analysis for Level 3 Other General qualifications


Notes: The vertical dashed line shows the point at which one can say that there is no difference in the average probability of achieving top grades between the category being observed and the reference category. Asterisks show which groups were statistically significant from their respective reference category in 2021, where *** = p<0.001; ** = p<0.01; * = p<0.05.
Table 9. Average marginal effects on the probability of achieving top grades with standard errors in brackets - Level 3 Other General qualifications
| Factor | 2018 AME | 2018 p | 2019 AME | 2019 p | 2020 AME | 2020 p | 2021 AME | 2021 p |
|---|---|---|---|---|---|---|---|---|
| Ethnicity: White Irish | -0.041 (0.082) | 0.615 | 0.053 (0.07) | 0.45 | 0.022 (0.072) | 0.758 | -0.02 (0.038) | 0.587 |
| Ethnicity: AOWB | 0.007 (0.019) | 0.695 | 0.042 (0.018) | 0.019 | 0.004 (0.019) | 0.819 | -0.006 (0.01) | 0.522 |
| Ethnicity: White and Black Caribbean | 0.013 (0.035) | 0.715 | -0.049 (0.027) | 0.065 | -0.051 (0.028) | 0.063 | -0.027 (0.017) | 0.108 |
| Ethnicity: White and Black African | -0.035 (0.043) | 0.414 | -0.06 (0.04) | 0.131 | -0.022 (0.049) | 0.657 | -0.057 (0.025) | 0.025 |
| Ethnicity: White and Asian | 0.075 (0.049) | 0.128 | -0.03 (0.04) | 0.446 | 0.009 (0.036) | 0.796 | 0.002 (0.019) | 0.933 |
| Ethnicity: AOMMB | 0.009 (0.037) | 0.795 | -0.086 (0.024) | <0.001 | -0.028 (0.026) | 0.274 | -0.025 (0.016) | 0.128 |
| Ethnicity: Indian | -0.035 (0.04) | 0.375 | 0.02 (0.044) | 0.647 | -0.009 (0.04) | 0.817 | 0 (0.026) | 0.996 |
| Ethnicity: Pakistani | -0.011 (0.041) | 0.784 | -0.032 (0.04) | 0.424 | -0.039 (0.035) | 0.275 | -0.063 (0.023) | 0.007 |
| Ethnicity: Bangladeshi | -0.034 (0.052) | 0.513 | -0.031 (0.049) | 0.524 | -0.126 (0.042) | 0.003 | -0.074 (0.03) | 0.013 |
| Ethnicity: Chinese | 0.021 (0.062) | 0.737 | 0.078 (0.058) | 0.173 | -0.005 (0.049) | 0.921 | -0.048 (0.032) | 0.134 |
| Ethnicity: AOAB | -0.033 (0.037) | 0.372 | 0.035 (0.036) | 0.328 | -0.039 (0.032) | 0.225 | -0.004 (0.022) | 0.875 |
| Ethnicity: African | -0.071 (0.027) | 0.007 | -0.101 (0.021) | <0.001 | -0.106 (0.021) | <0.001 | -0.055 (0.015) | <0.001 |
| Ethnicity: Caribbean | -0.062 (0.03) | 0.036 | -0.069 (0.023) | 0.003 | -0.073 (0.026) | 0.005 | -0.067 (0.017) | <0.001 |
| Ethnicity: AOBACB | -0.099 (0.041) | 0.016 | -0.038 (0.042) | 0.361 | -0.134 (0.036) | <0.001 | -0.055 (0.024) | 0.021 |
| Ethnicity: AOEG | -0.059 (0.034) | 0.08 | -0.029 (0.031) | 0.351 | -0.028 (0.031) | 0.365 | -0.014 (0.019) | 0.451 |
| Ethnicity: Unknown | 0.022 (0.035) | 0.521 | 0.001 (0.033) | 0.969 | -0.009 (0.034) | 0.794 | 0 (0.022) | 0.988 |
| Gender: Male | -0.034 (0.005) | <0.001 | -0.046 (0.005) | <0.001 | -0.082 (0.005) | <0.001 | -0.076 (0.005) | <0.001 |
| Gender: Unknown | -0.055 (0.045) | 0.225 | -0.038 (0.042) | 0.36 | -0.062 (0.036) | 0.081 | -0.077 (0.029) | 0.008 |
| SEND: Yes | -0.08 (0.027) | 0.003 | 0.021 (0.02) | 0.312 | -0.017 (0.019) | 0.38 | -0.017 (0.013) | 0.203 |
| SEND: Unknown | 0.018 (0.011) | 0.112 | 0.028 (0.011) | 0.009 | 0.058 (0.012) | <0.001 | 0.087 (0.014) | <0.001 |
| FSM: Yes | -0.041 (0.017) | 0.017 | -0.032 (0.013) | 0.015 | -0.038 (0.015) | 0.008 | -0.021 (0.008) | 0.007 |
| FSM: Unknown | -0.023 (0.024) | 0.333 | -0.026 (0.02) | 0.185 | -0.033 (0.019) | 0.08 | -0.125 (0.041) | 0.002 |
| IDACI: Very low | 0.025 (0.016) | 0.129 | 0.023 (0.015) | 0.116 | -0.01 (0.014) | 0.475 | 0.027 (0.007) | <0.001 |
| IDACI: Low | 0.017 (0.016) | 0.304 | 0.014 (0.014) | 0.346 | -0.019 (0.014) | 0.179 | 0.003 (0.007) | 0.638 |
| IDACI: High | 0.014 (0.016) | 0.381 | -0.004 (0.014) | 0.788 | -0.028 (0.014) | 0.053 | -0.027 (0.007) | <0.001 |
| IDACI: Very high | -0.014 (0.018) | 0.445 | -0.022 (0.016) | 0.161 | -0.016 (0.015) | 0.297 | -0.029 (0.008) | <0.001 |
| IDACI: Unknown | -0.052 (0.039) | 0.182 | -0.057 (0.037) | 0.116 | -0.071 (0.036) | 0.05 | 0.023 (0.048) | 0.639 |
| Prior attainment: Very low | -0.119 (0.009) | <0.001 | -0.139 (0.008) | <0.001 | -0.138 (0.009) | <0.001 | -0.139 (0.008) | <0.001 |
| Prior attainment: Low | -0.062 (0.009) | <0.001 | -0.073 (0.009) | <0.001 | -0.088 (0.009) | <0.001 | -0.073 (0.008) | <0.001 |
| Prior attainment: High | 0.094 (0.01) | <0.001 | 0.083 (0.01) | <0.001 | 0.097 (0.01) | <0.001 | 0.109 (0.009) | <0.001 |
| Prior attainment: Very high | 0.249 (0.012) | <0.001 | 0.268 (0.011) | <0.001 | 0.249 (0.011) | <0.001 | 0.27 (0.01) | <0.001 |
| Prior attainment: Unknown | 0.012 (0.01) | 0.219 | 0 (0.009) | 0.959 | 0.014 (0.009) | 0.117 | 0.018 (0.009) | 0.03 |
Summary
While we have focussed our discussions in the previous section on the changes that appear to have occurred, it is important to again stress that the attainment gaps between most groups of learners have not changed in a notable way between years, remembering that some degree of minor fluctuation is always to be expected.
The difference between males and females does represent one notable finding of this report. We noted in our report last year the apparent change in the attainment gap between males and females, with males on average becoming increasingly less likely to achieve top grade than females in 2020 relative to 2019. We found the same in the current report, with an apparent increase in this attainment gap in 2021 relative to 2020 for Level 1/2 Other General qualifications and Level 3 Applied General and other Performance Table qualifications. For Level 1/2 Performance Table qualifications and Level 3 Other General qualifications, the attainment gaps between males and females have slightly narrowed between 2020 and 2021.
It is important to again note that using the model presented in the report, we are only able to describe the changes that appear to have occurred. It is not possible to attribute a cause to any of these changes, and many possible causal factors may be at play, not just those related to the pandemic. VTQ cohorts and qualifications are often changeable over time, introducing many such possible factors not captured by our data.
Some other possible effects with regards to Level 1/2 learners with SEND and those eligible for free school meals have also been commented upon. However, these effects were small, and may be part of normal fluctuation over time. Differences were within 2 percentage points, which will also only affect a relatively small number of learners in any particular cohort. Other possible effects were discussed in relation to a small number of ethnic groups in specific groups of qualifications (such as for Bangladeshi, Chinese, and ‘White and Asian’ mixed ethnicity learners in Level 1/2 Other General qualifications). However, these particular changes were attributed with a fair degree of uncertainty around their estimates, largely due to their small group sizes, making it difficult to conclude with certainty that these effects were genuine.
Some continued monitoring around the difference in attainment between males and females may be needed to understand this further. Otherwise, a small degree of change is to be expected in any given year and many of these changes are in line with those expectations. We shall continue to monitor and engage with the system and qualification outcomes, with the continued intention of ensuring outcomes are as fair and valid as possible.
Technical appendices
Table 1. Counts of learners included in the equalities analysis per qualification group – Level 1/2
| Qualification group | 2018 | 2019 | 2020 | 2021 |
|---|---|---|---|---|
| Other General qualifications | 60,530 | 50,905 | 57,210 | 50,765 |
| Performance Table qualifications | 135,310 | 244,255 | 381,400 | 427,505 |
| Total | 195,845 | 295,160 | 438,610 | 478,270 |
Note. Values are rounded to the nearest 5
Table 2. Counts of learners included in the equalities analysis per qualification group – Level 3
| Qualification group | 2018 | 2019 | 2020 | 2021 |
|---|---|---|---|---|
| Other General qualifications | 80,055 | 96,590 | 140,775 | 197,250 |
| Applied General Qualifications | 27,410 | 34,485 | 31,990 | 37,935 |
| Other Performance Table qualifications | 76,105 | 81,020 | 79,665 | 106,545 |
| Total | 183,570 | 212,090 | 252,430 | 341,735 |
Note. Values are rounded to the nearest 5
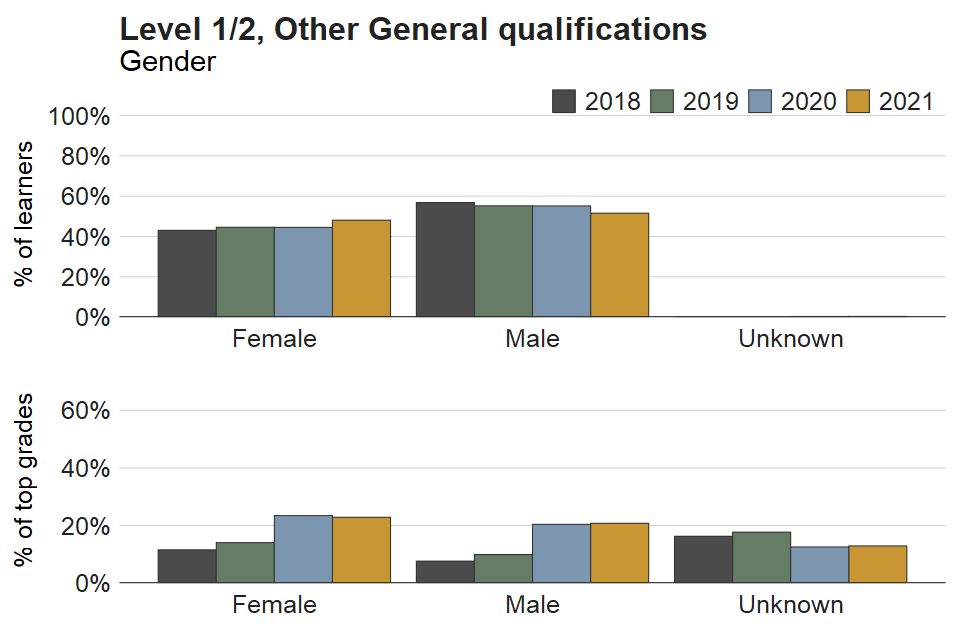
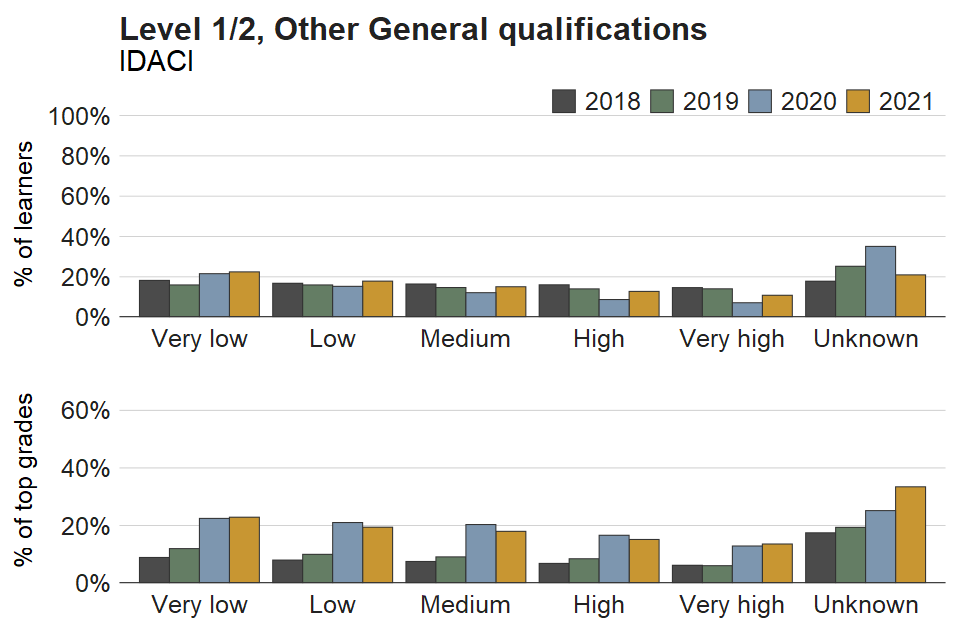
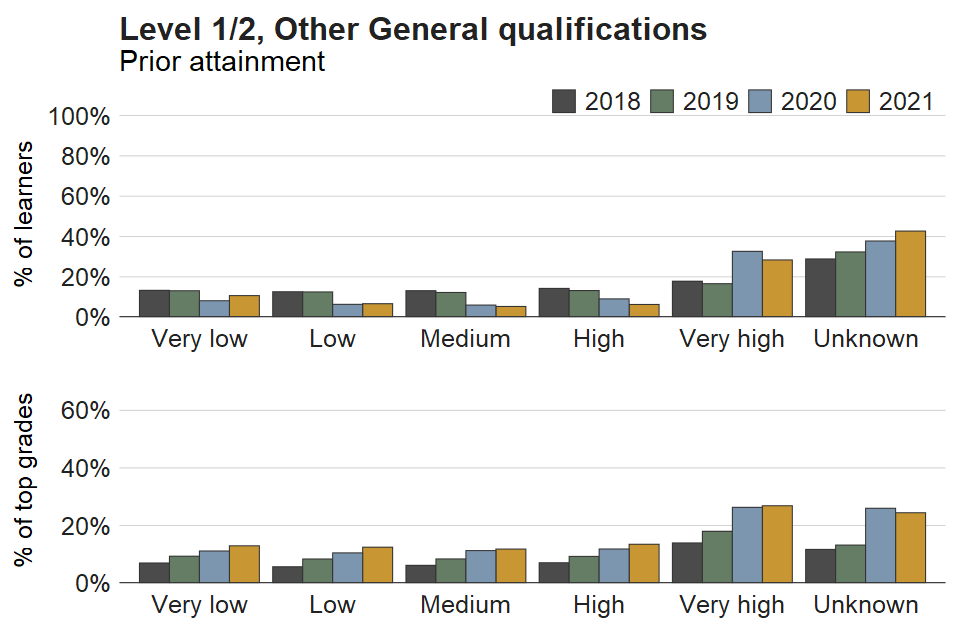
Figure 1. Proportions of learners and top grades achieved each year for breakdowns by learner characteristic – Level 1/2, Other General qualifications
a)
b)
c)
d)
e)
f)
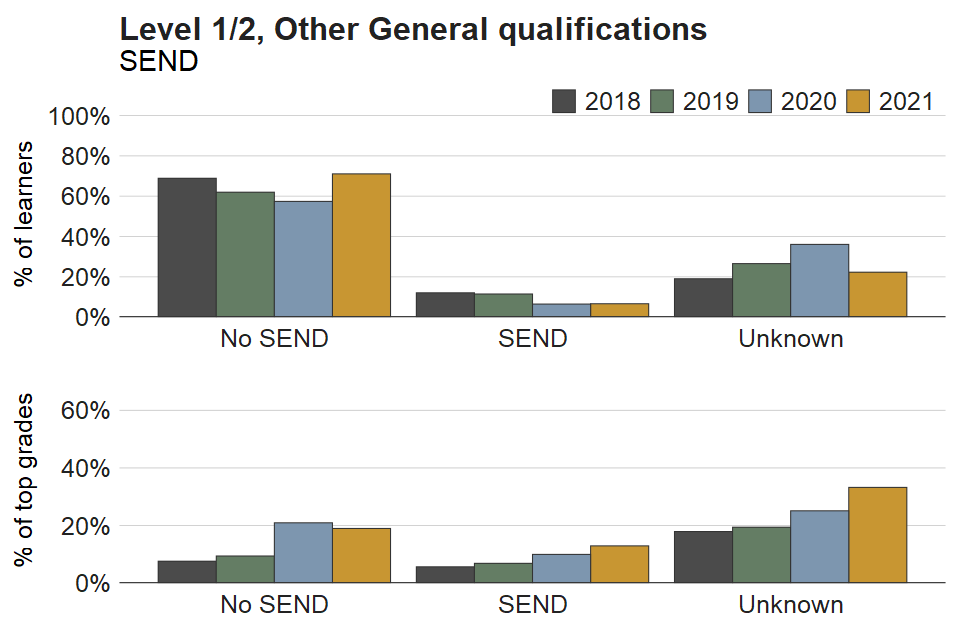
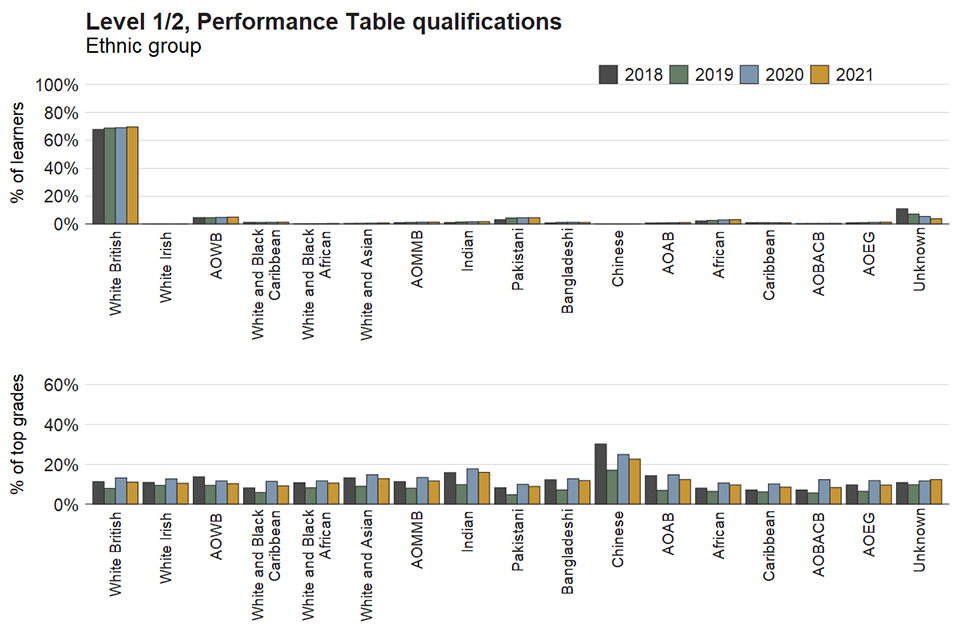
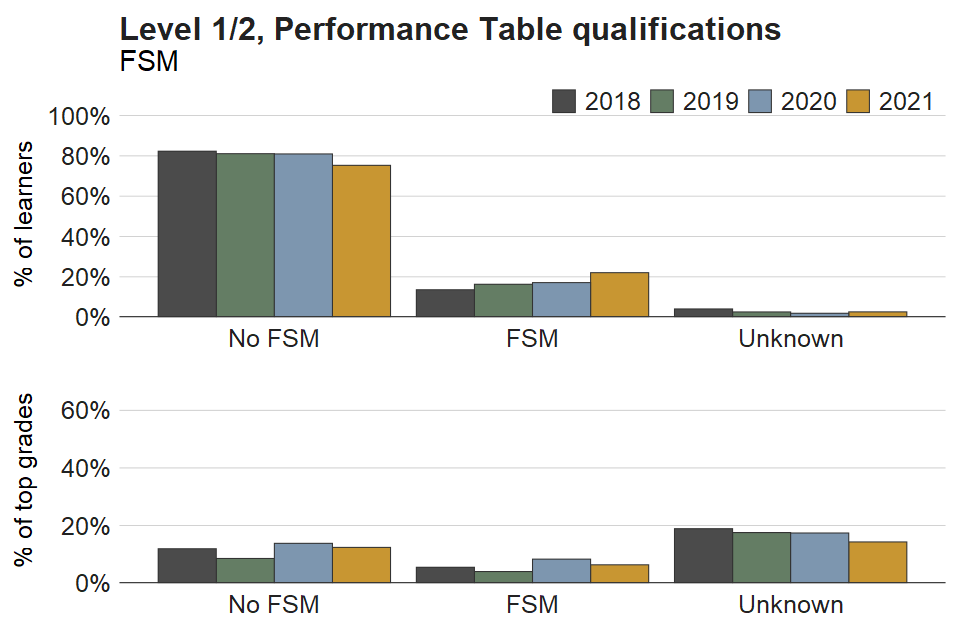
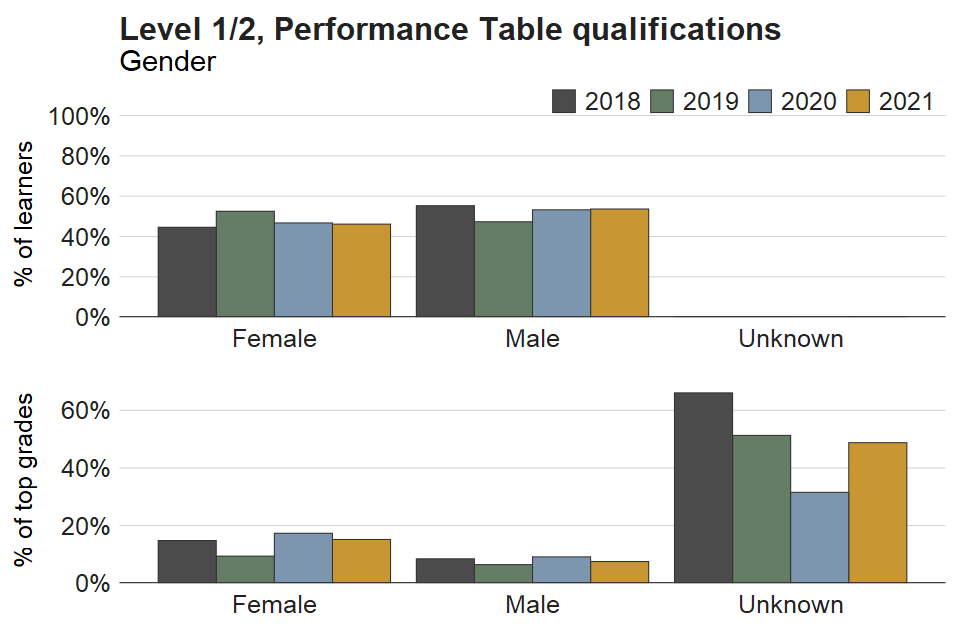
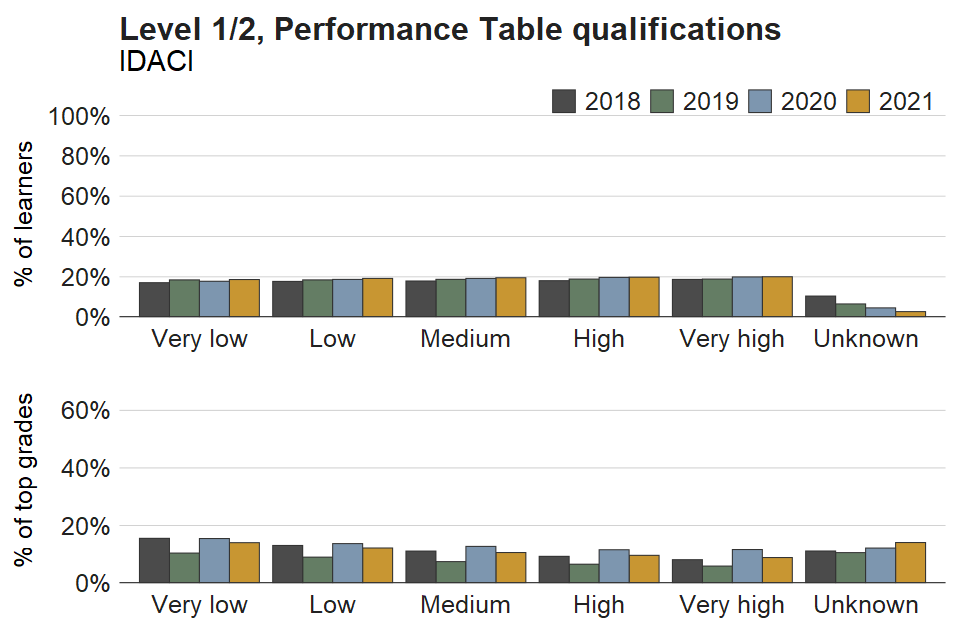
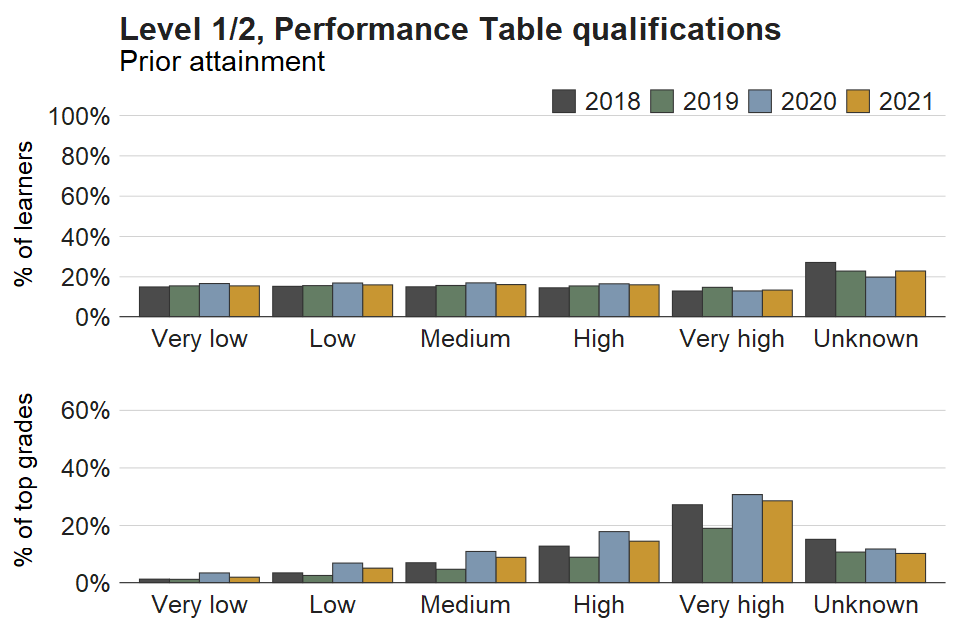
Figure 2. Proportions of learners and top grades achieved each year for breakdowns by learner characteristic – Level 1/2, Performance Table qualifications
a)
b)
c)
d)
e)
f)
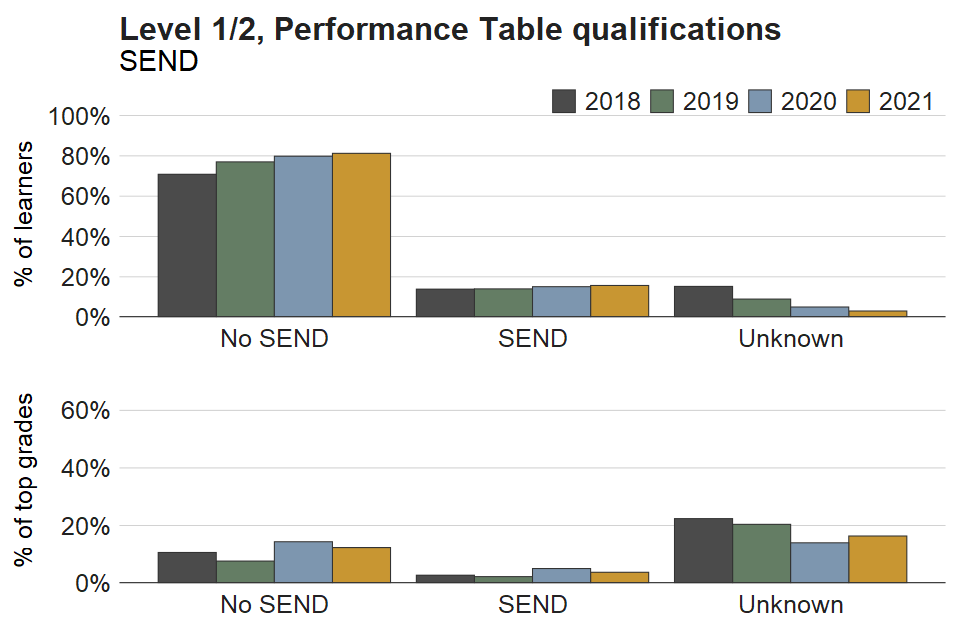
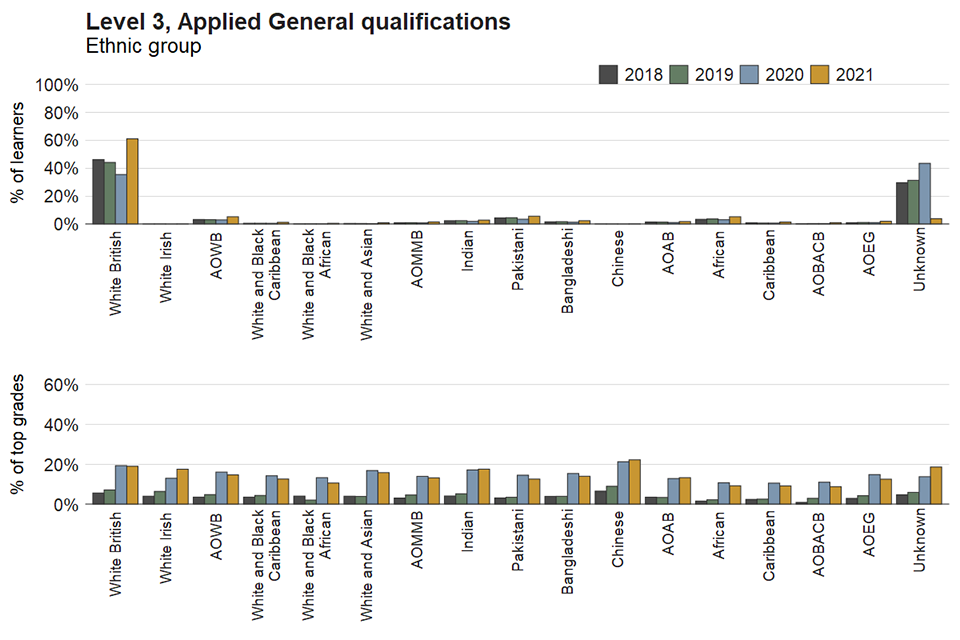
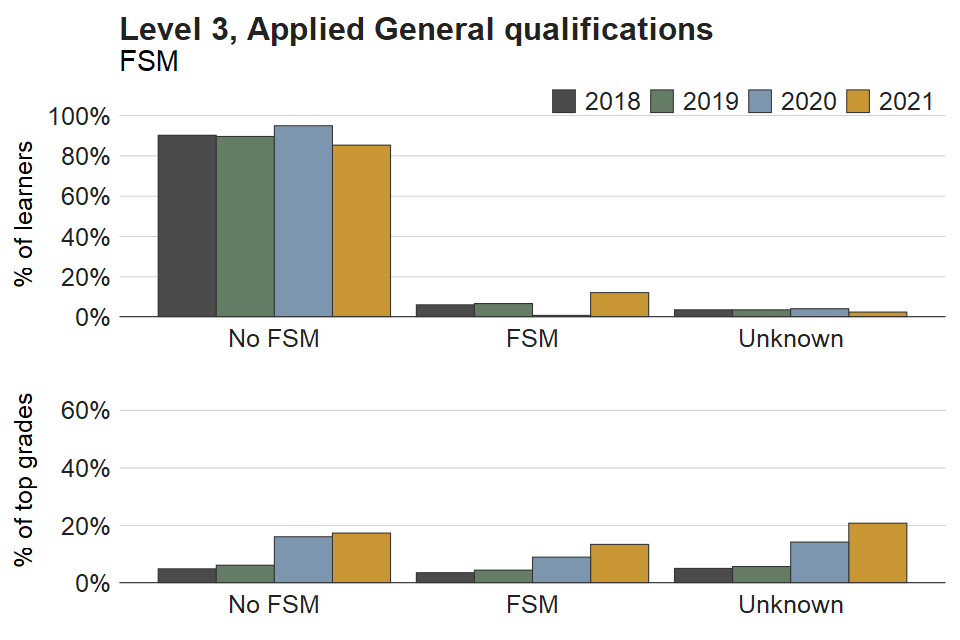
Figure 3. Proportions of learners and top grades achieved each year for breakdowns by learner characteristic – Level 3, Applied General qualifications
a)
b)
c)
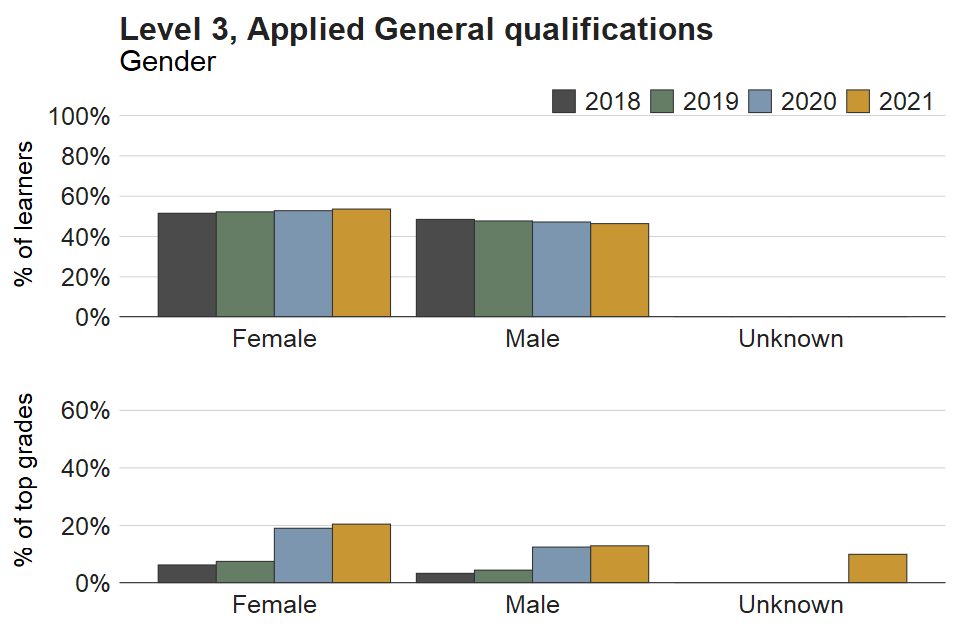
d)
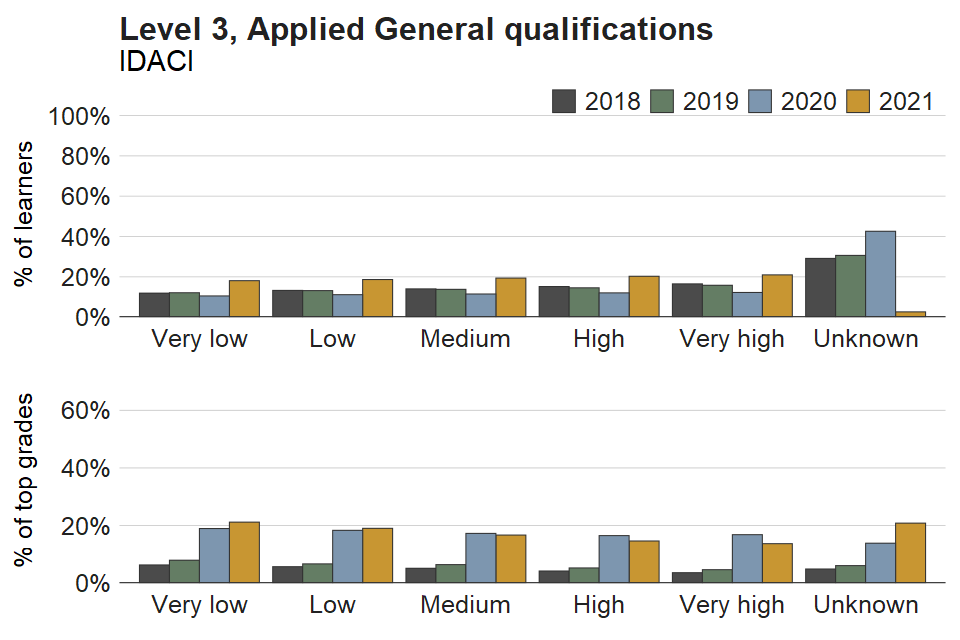
e)
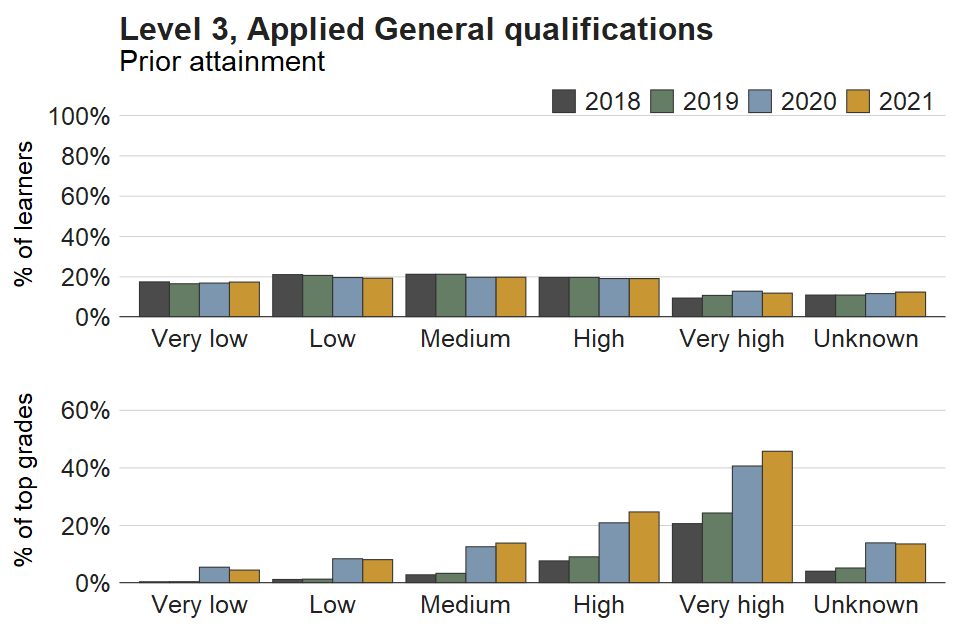
f)
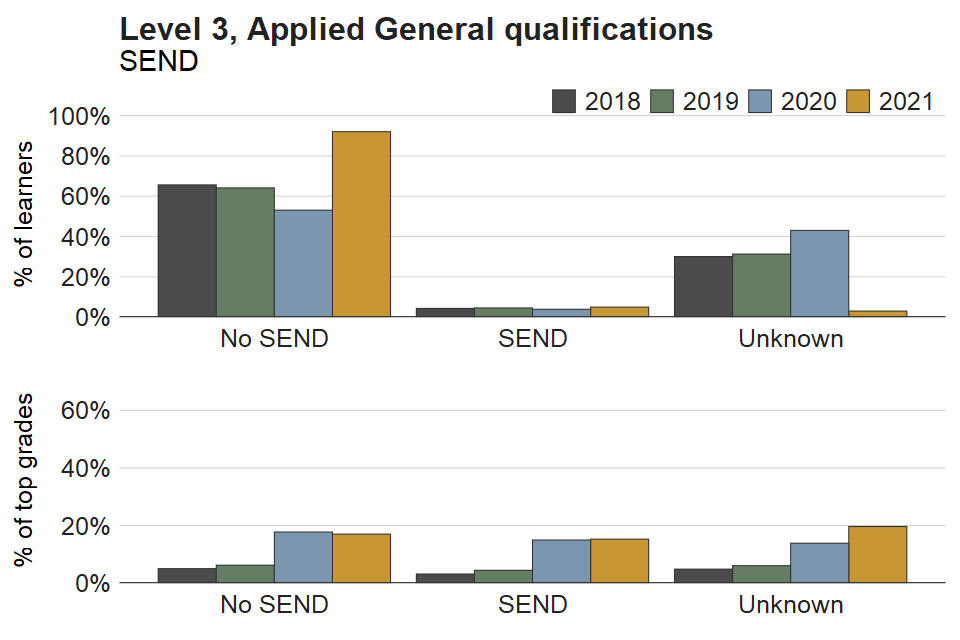
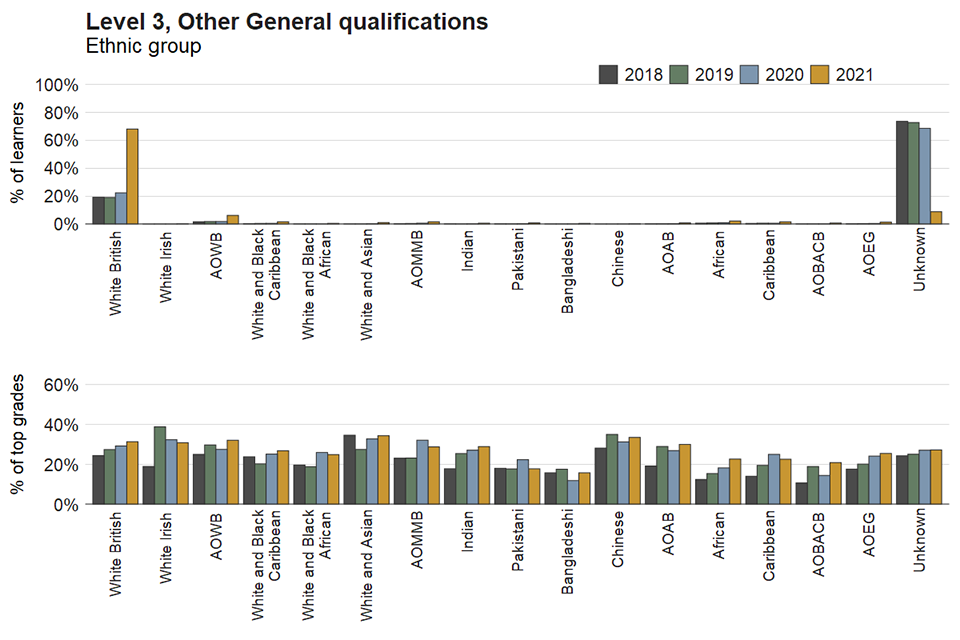
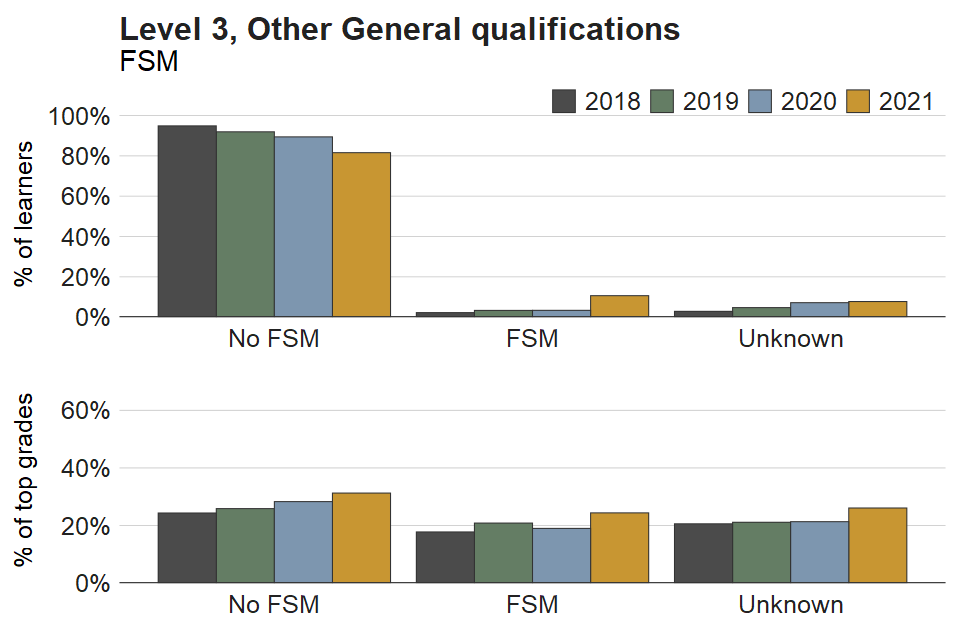
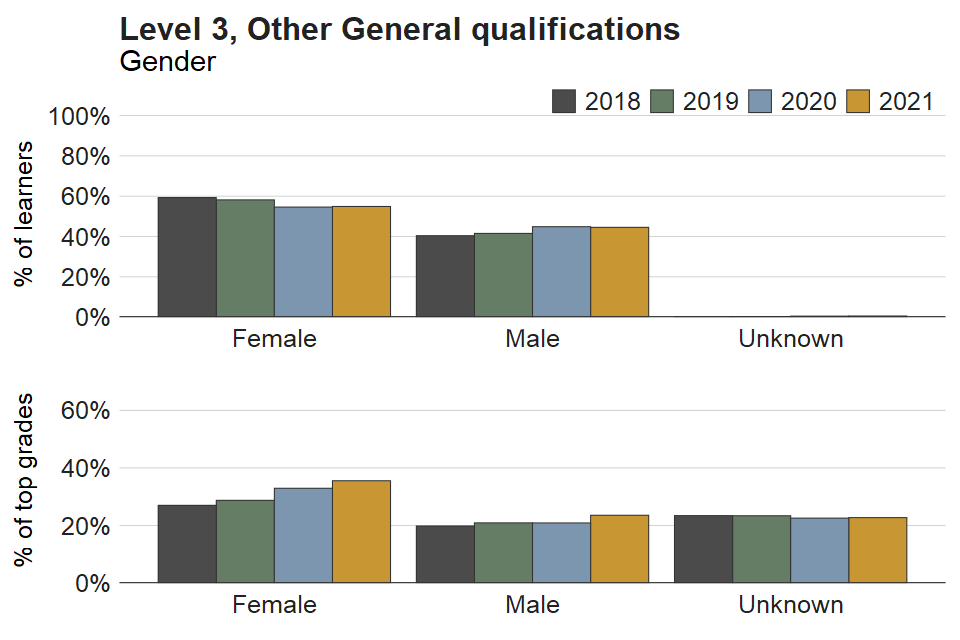
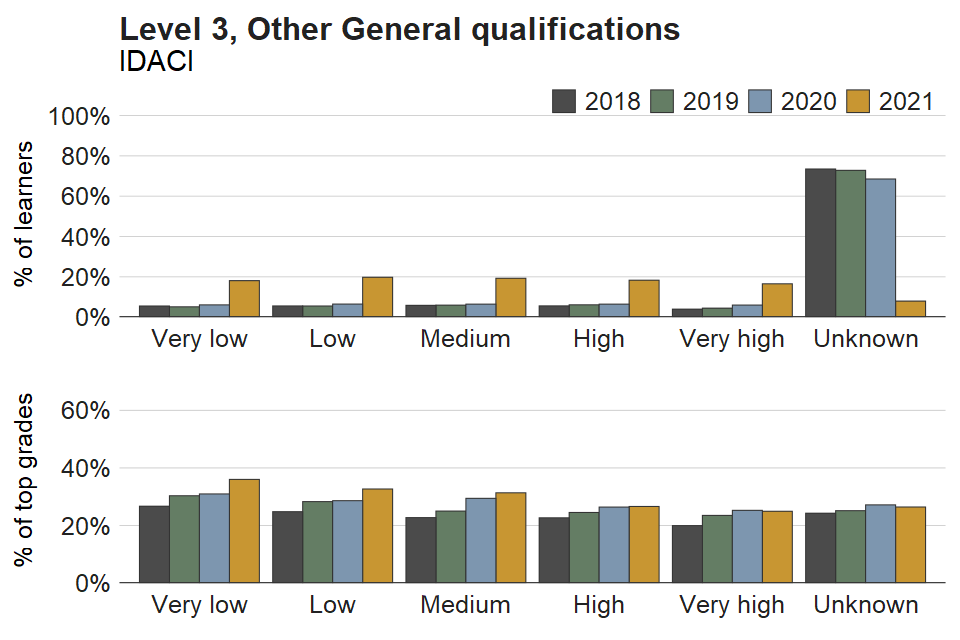
Figure 4. Proportions of learners and top grades achieved each year for breakdowns by learner characteristic – Level 3, Other General qualifications
a)
b)
c)
d)
e)
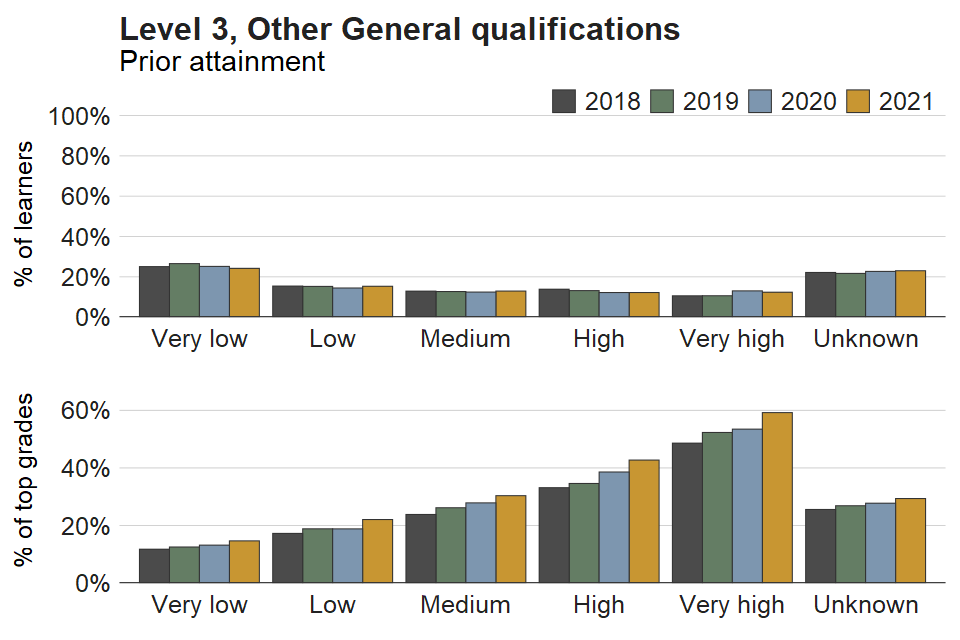
f)
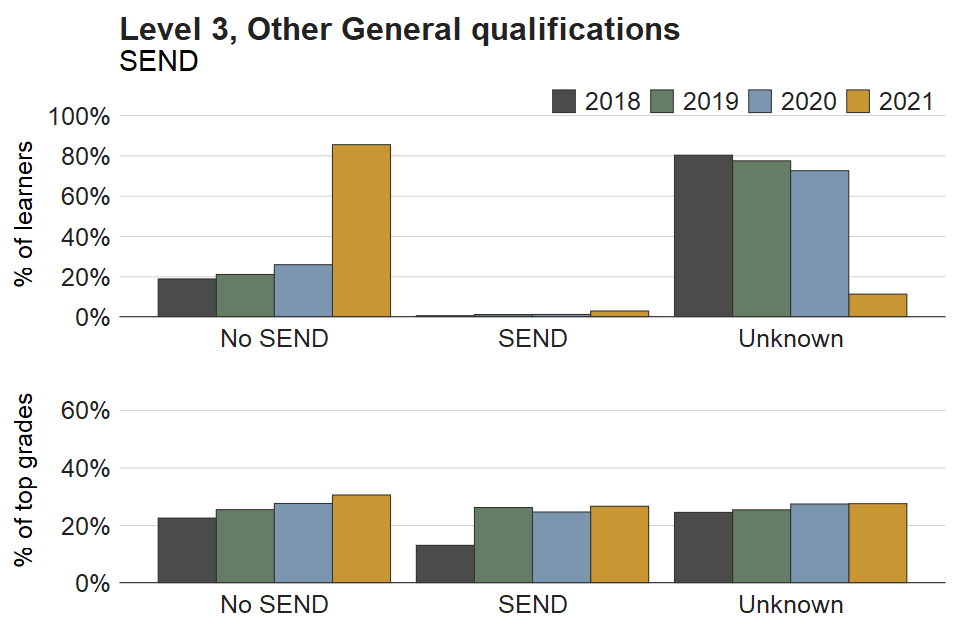
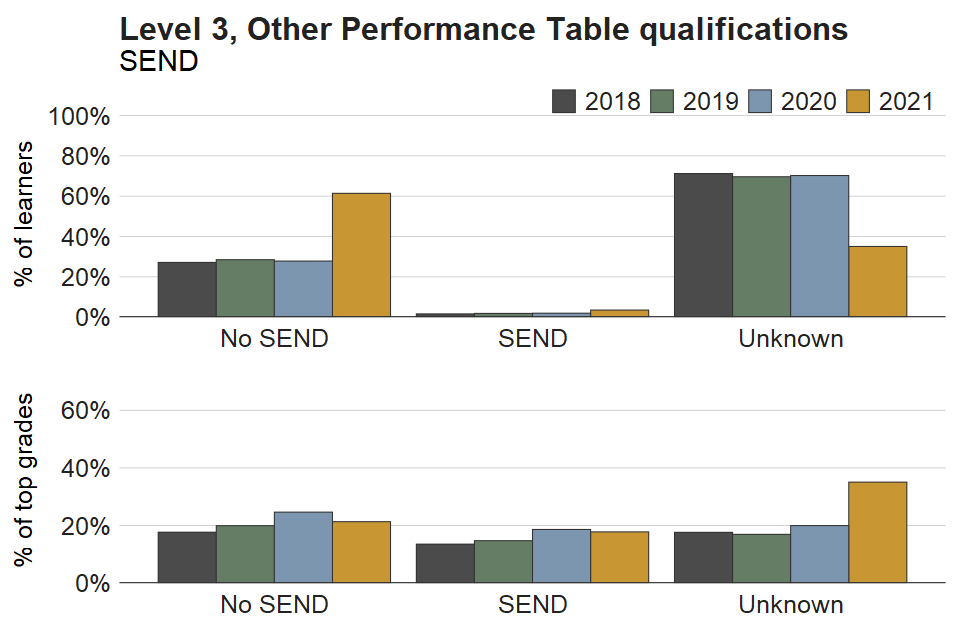
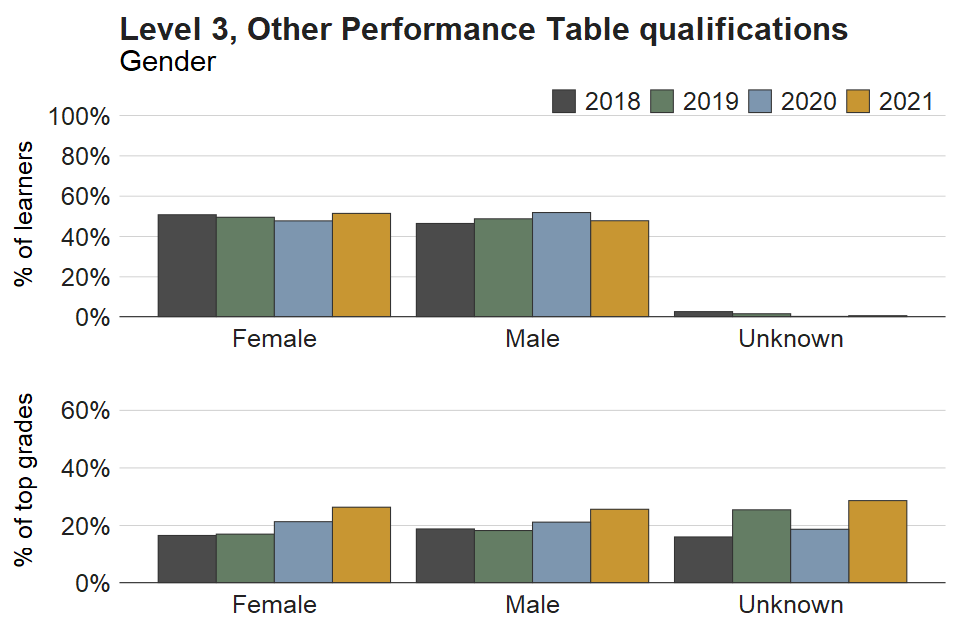
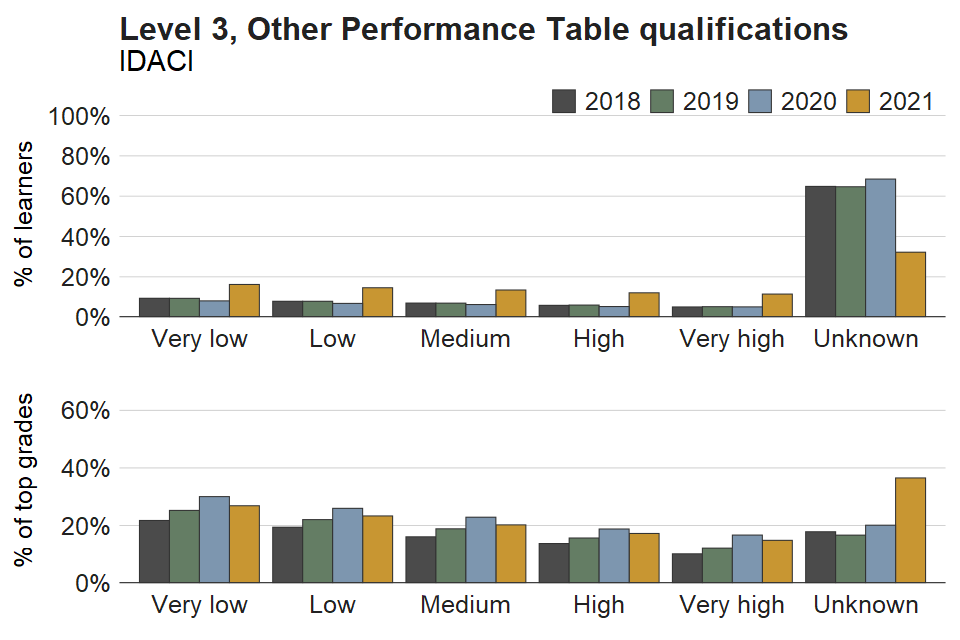
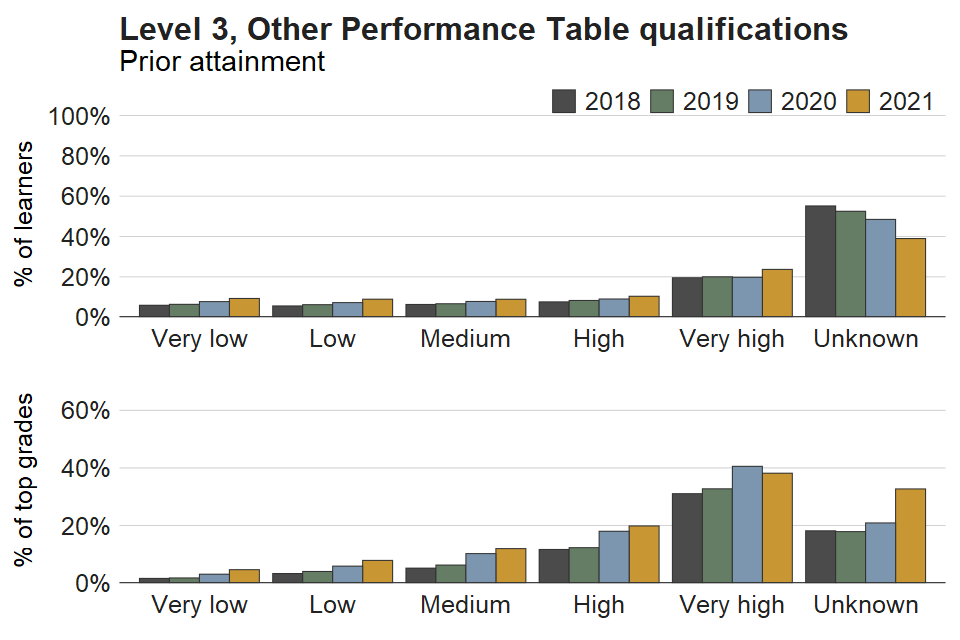
Figure 5. Proportions of learners and top grades achieved each year for breakdowns by learner characteristic – Level 3, Other Performance Table qualifications
a)
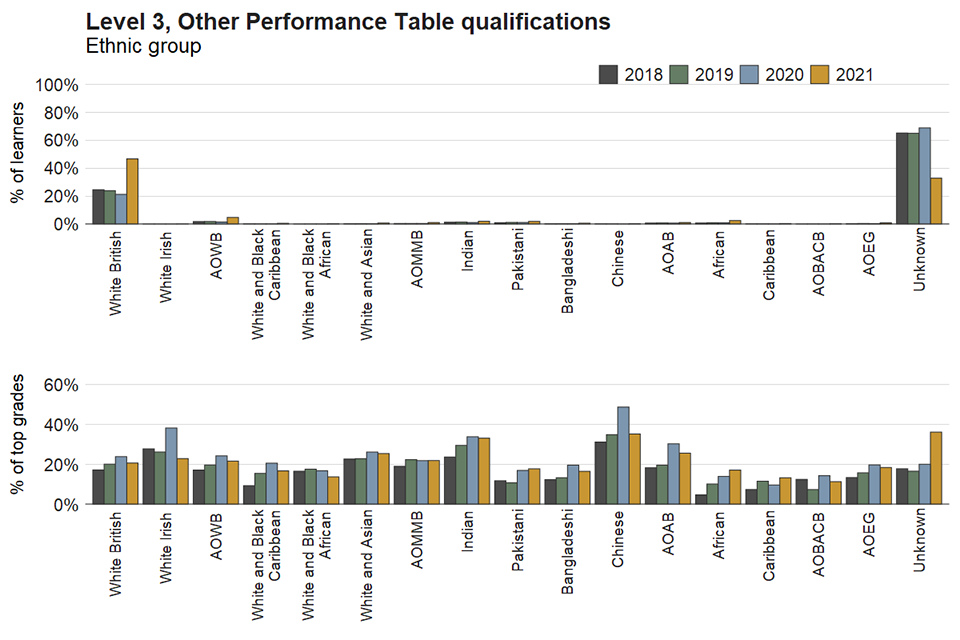
b)
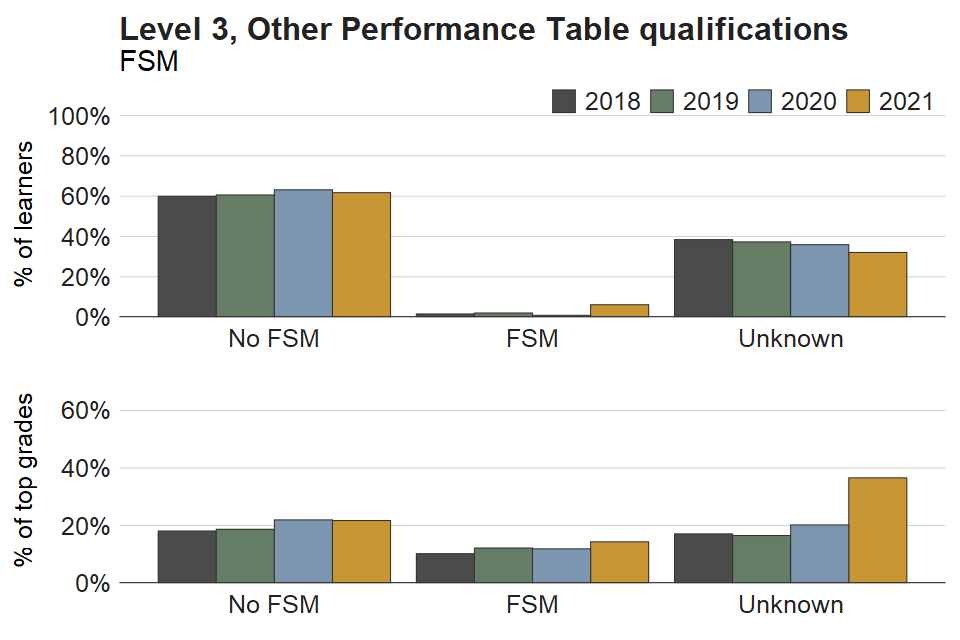
c)
d)
e)
f)