An in-depth review of fire-related fatalities and severe casualties in England, 2010/11 to 2018/19
Updated 16 May 2023
Applies to England

© Crown copyright 2023
This publication is licensed under the terms of the Open Government Licence v3.0 except where otherwise stated. To view this licence, visit nationalarchives.gov.uk/doc/open-government-licence/version/3 or write to the Information Policy Team, The National Archives, Kew, London TW9 4DU, or email: psi@nationalarchives.gov.uk.
Where we have identified any third party copyright information you will need to obtain permission from the copyright holders concerned.
This publication is available at https://www.gov.uk/government/publications/an-in-depth-review-of-fire-related-fatalities-and-severe-casualties-in-england-2010-to-201819/an-in-depth-review-of-fire-related-fatalities-and-severe-casualties-in-england-201011-to-201819
Foreword
I am very pleased to provide the foreword to this report.
Over recent decades there has been a substantial and welcome reduction in fire-related fatalities and casualties in England. Fatalities from fires in the home have in recent years been at historically low levels. This has not been the result of a single change or intervention but by a combination of many factors influencing the overall risk of fire. The continued focus on prevention including the work undertaken by fire and rescue services across the country have played an important role in this overall reduction.
It is imperative that, despite the reductions in fire related fatalities over the years, we must not lose sight of the impact of each specific case and the distress fires, particularly fatal fires, invariably cause. This report talks necessarily of numbers and frequencies, but the heart-breaking reality behind each incident and behind each number must not be forgotten. The Grenfell Tower fire in 2017 brought this into stark relief and, together with the many individual cases also included in the report, clearly demonstrate how devastating fire can be.
It is key that all work on fire prevention must be informed by evidence of what works. We need to know what the dangers are, who is at risk and, despite the efforts of everyone involved in fire safety, why we still have people losing their lives to fire. This report helpfully builds our collective understanding of the circumstances around fatal fires. By adopting two approaches – a statistical review of many years of fire incident data and an in-depth analysis of one year of fire investigation reports – this research provides a rounded look at common themes, repeating patterns and emerging issues. These can be taken, considered and used to inform local and national fire prevention activity.
The overall success should be celebrated, but we must not get complacent, and all involved need to continue to work together to reduce these individual tragedies further. This report will only serve to support that.
This report has only been possible due to the support of local FRSs and the NFCC in collating the relevant data and information and providing expert input throughout. We are grateful to them for their help in supporting this important study.
Sarah Gawley, Interim Director of Fire
Acknowledgements
The authors (Alexandra Bartlett, Isabel Preston, Molly Watts) would like to thank the fire and rescue services that took the time to provide fire investigation reports, to the National Fire Chiefs Council Home Safety Committee for their assistance in designing and promoting the research.
Thanks to Professor Andrew Clark and Dr Julie Mytton for peer reviewing the final report.
Thanks also go to all members of the fire and rescue analysis programme and policy teams who either took part in the analysis or contributed to the review and drafting process.
Executive summary
The vast majority of fires attended by fire and rescue services (FRSs) in England do not result in loss of life or serious injury. However, an average of 5 people a week died in a fire in England in the year ending 31 March 2019. As the tragic events at Grenfell Tower in June 2017 showed, fires can still result in multiple fatalities and many other adverse outcomes.
While the number of fire-related fatalities has declined markedly from a peak of 755 since current records began in 1981 to 251 in the year ending March 2019, it is important to keep knowledge and understanding of the profile and circumstances of fires which result in a fatality up to date, to inform prevention activity and further reduce the numbers of fire-related fatalities.
This report presents findings from research designed to provide an in-depth analysis of fire-related fatalities in England. It also considers whether fires that result in severe casualties are notably different from those that result in fatalities and thus whether a different approach to reducing non-fatal casualties is required.
Research aims
The aims of this research were to:
- better understand of the circumstances of fires that result in fatalities and severe casualties
- examine the risk across the population of being a severe casualty or fatality of fire
- understand the differences between fatal fires and fires which result in a severe casualty
- explore the behaviours of fatal victims of fires, leading up to and during the fire
- assess the consistency of fire investigation reports and provide recommendations for best practice for documenting fire-related fatalities going forward
Research design
This research comprised two parts:
- in phase one, Home Office Incident Recording System (IRS) data were analysed to explore the circumstances of fires involving a fatality or severe casualty in the years ending March 2011 to 2019. Historical data on fires involving all non-fatal casualties (not just severe) were also examined to understand the overall trend in fires and casualties
- in the second phase, fire investigation reports (FIRs) were analysed to explore the behaviours of victims and circumstances of fatal fires in the year ending March 2017
Phase 1: Findings from the IRS
The first phase of the research considered the overall trend in fire-related fatalities and severe casualties, then analysed IRS data to show:
- the prevalence of such fires
- where and when fatal and severe casualty fires occurred
- what types of fires resulted in fatalities and severe casualties
- the profile of fatal and severe casualty victims
Trends in fire-related fatalities and severe casualties
When comparing the number of fires against the number of fatal and non-fatal casualties, the trend showed that fires, fatalities and non-fatal casualties had been decreasing over time. However, comparing the rates of severe casualties and fatalities per 10,000 fires, the rate of fatalities in fires increased whereas the rate of severe casualties remained the same.
In the years ending March 2011 to 2019 there were:
- 2,356 fatal fires which involved 2,637 fatalities1
- 5,128 severe casualty fires which involved 5,817 severe casualties
Notes:
- For the purpose of publications, figures include the number of fatal casualties which were either recorded as ‘fire-related’ or ‘don’t know’. Of the 2,637 fatalities, 283 (11%) were classified as don’t know as to whether these were fire-related.
There were many similarities between the characteristics of fatal and severe casualty fires such as in the high levels of prevalence in and around residential properties, fires involving older people living alone, and fires occurring more frequently in deprived areas. However, there are some key differences that demonstrate that the circumstances around fatal fires are often distinct from severe casualty fires, as summarised in Table 1 and discussed below.
Table 1: Summary of most prevalent factors in fatal and severe casualty fires, combined data for years ending March 2011 to 2019
| Circumstance | Fatal fires | Severe casualty fires |
|---|---|---|
| WHERE THE FIRE OCCURRED | ||
| Location | Dwellings (1,808 fires, 77%) |
Dwellings (3,696 fires, 66%) |
| Property type | House (943 fires, 52%) |
House (1,713 fires, 51%) |
| Fire start location | Living room (685 fires, 38%) |
Kitchen (1,195 fires, 66%) |
| WHEN THE FIRE OCCURRED | ||
| Season | Winter (711 fires, 30%) |
Summer (1,328 fires, 26%) |
| Time of day | Afternoon (630 fires, 27%) |
Evening (1,590 fires, 31%) |
| WHAT TYPE OF FIRE | ||
| Motive | Accidental (1,827 fires, 78%) |
Accidental (4,070 fires, 79%) |
| Source of ignition | Smoking materials (590 fires, 25%) |
Cooking appliances (1,117 fires, 22%) |
| Item first ignited | Textiles, upholstery and furnishings (1,127 fires, 48%) |
Textiles, upholstery and furnishings (1,792 fires, 35%) |
| VICTIMS | ||
| Gender | Male (1,637 victims, 62%) |
Male (3,823 victims, 66%) |
| Age | 65 or over (1,071 victims, 41%) |
45 to 64 (2,827 victims, 33%) |
Where did fatal and severe casualty fires occur?
There were differing numbers of fatalities and severe casualties across the country, but not necessarily linked to the actions of FRSs in these areas. Local factors, for example age profile of residents and building composition, could have contributed to the likelihood of fires and, at a more local level, fatal and severe casualty fires occurred more frequently in areas of high deprivation.
Analysis of fire start location and property type showed fires involving a fatality or severe casualty most often occurred in indoor locations and specifically in residential buildings. The most common room of origin for fatal dwelling fires was the living room, whereas it was the kitchen for severe casualties. Fatal other building fires occurred more frequently in residential properties such as a residential home, whereas severe casualties most frequently occurred in industrial premises. Road vehicle fires that involved a fire-related fatality or casualty were relatively infrequent and generally occurred in cars. Outdoor fires that involved a fatality or severe casualty were rare but were most likely to occur close to a building or structure.
When did fatal and severe casualty fires occur?
Time of day, day of week, and the season in which fatal and severe casualty fires occurred can be important to consider when determining appropriate shift patterns and the timing of fire safety messaging. The pattern is different for fatal and severe casualty fires. Fatal fires more often occurred during winter months, with little variation based on the day of the week or time of day. Severe casualty fires occurred evenly throughout the year, but more often in the afternoon/evening. No trend in the time of day fatal fires occurred suggests there are not the same links to activities such as cooking, as there are with severe casualties.
What types of fires resulted in fatalities and severe casualties?
The IRS collects data on how fires started, the presence of a working smoke alarm and some limited information on whether drug and/or alcohol use was believed to have contributed to the fire. This, together with data on the behaviour of the fire itself, such as spread, provides a useful indication of the types of fire which resulted in a fatal or severe casualty.
While there was a higher risk of severe casualty than fatality in all fires, the risk of fatality and of severe casualty in smokers’ materials fire are almost equal. For both severe casualty and fatal fires in buildings, the item first ignited was most often textiles, upholstery and furnishings. Fatal and severe casualty fires rarely spread beyond the room of origin or item first ignited. There was a working smoke alarm present in about half of all fatal and severe casualty dwelling fires and in most fires in residential buildings. The absence of a working smoke alarm increased the risk that a household would be involved in a fatal or severe casualty fire.
What was the profile of fatal and severe casualty victims of fire?
Limited information is collected in the IRS on the victims of fire however the data that is available can be used to explore differences in the risk for different gender and age groups. The analysis found older people are more likely to die in a fire than the average for the general population, while the risk profile is more variable for severe casualties. Males are more likely than females to die or experience a severe casualty in a fire.
Phase 2: FIRs for the year ending March 2017
While the IRS data can give some initial indication of activities and behaviours at the time of fire, FIRs provide a more in-depth understanding and authoritative account of the circumstances of fatal fires. There were 185 fatal dwelling fires involving 201 victims in the year ending March 2017, for which there was an available FIRs.
Fire discovery and escape
When a fire is discovered and the timeliness of notifying the FRS influences its outcome. Victims’ activities at the time of fire, such as whether they were asleep, is therefore often a very important factor in the potential outcome of the fire, along with their actions upon discovering the fire, and any actions of witnesses.
Victim activity at the time of fire is difficult to establish and therefore often recorded in the FIRs as unknown, but where known, victims were often asleep at the time of fire (37 victims). A large proportion of the fatal fires (81 of 185) took place where a smoke alarm was present, and in 13 cases where the alarm activated but the victim could not escape. A substantial number of victims (88 victims) discovered the fire themselves, and the first person who attended the fire, other than the victim, was a neighbour. The first action by first responders was often to raise the alarm by calling 999 (in 67 instances). Many victims (83 of 201) were found in the room where the fire started suggesting they could not escape, largely due to impairment or being on fire themselves.
Impact of impairments on the outcome of the fire
Many of the fires involved those who had pre-existing impairments. The impairments were often stated as a factor in both the starting of a fire and the outcome. Impairments were categorised in the analysis under three major areas:
- physical – such as mobility-related impairments
- mental – such as dementia or hoarding
- substance use – such as the use of prescribed or illicit drugs
Most victims (123 of 201) had some level of overall impairment that may have affected their response to the fire. An impairment was not stated or unknown in many cases (57 of 201) and some (21 of 201) had no impairment at all. Physical impairments were prevalent among a notable number of the individuals (43 of 201), and this was sometimes combined with a mental impairment (16 of 43) or a substance-related impairment (7 of 43). For 71 individuals, the impairment was considered to have contributed to starting the fire or the outcome.
History of potentially unsafe fire behaviours
As a large proportion of fires (145 of 185) were identified as being caused by human behaviour, the risk of a fatal fire could potentially be mitigated against by spotting unsafe fire behaviours early. The most common potentially risky behaviour was smoking (110 victims), along with discarding cigarettes inappropriately (56 of 201 victims), and careless or risky use of materials that may cause fire (79 victims). There were some cases of hoarding and poor housekeeping among fatal fire victims, which may have contributed to the outcome of the fire (46 victims).
Contact with FRSs and other agencies
One way in which unsafe fire behaviours can be identified and mitigated against before a fire occurs is through contact with FRSs and other agencies. Over a quarter of victims (56 of 201) were in a care environment and 32 (of 201) individuals had specific contact with FRSs prior to the fire. This includes 26 victims who had a Home Fire Safety Check (HFSC) and 6 who had smoke alarms fitted by the FRS.
Suicide, arson and accidental self-immolation
It can be difficult to determine if an individual has deliberately set a fire and if they intended to commit arson or suicide. It is important to understand these incidents though, as their prevention requires a different approach compared with accidental fires.
In the fires with the motive recorded as deliberate (27 of 185), 16 were suicide, 2 were arson, and the intention was unknown or not stated in 9. In the 16 fires where the cause was suicide, accelerant was used in 11 of them.
In 21 fires, the victim accidentally set themselves on fire, but these were not considered to be linked to suicide or arson. In 9 of these instances, smoking materials was the source of ignition.
Common fatal fire scenarios
The overall analysis showed that while there were some similarities between fatal fire incidents, there were a lot of different factors that might have affected the outcome. Cluster analysis was used to identify common fatal fire scenarios in the FIRs for the years ending March 2011 to 2019 by grouping similar fires and victims together. Seven groups were identified in this analysis:
- vulnerable individual with working smoke alarm
- individual under the influence of alcohol and smoking
- individual with mental impairment
- fires caused by misused heating devices and poor housekeeping
- single male falls asleep while smoking
- single female falls asleep while smoking
- male with impairments in mixed circumstances
Discussion
The profile of fatal fires has stayed relatively consistent since undertaking previous detailed research. Older age, the presence of an impairment such as physical disability, living alone, smoking and alcohol use remain key risk factors, and this is similar for severe casualties.
FIRs provided a good amount of detail to support development of fire safety initiatives; however, there are currently large differences in the type of information and level of detail captured in the reports. Ensuring all reports record key data consistently, and sharing this information between FRSs, will help to improve understanding of fire-related fatalities and aid faster identification of emerging risks. Similarly, more consistent recording of information in the IRS would allow for more reliable analysis of victim and household profiles at a national level.
Analysis of the FIRs found it was not uncommon for a working smoke alarm to have been present and active in a fatal fire. This shows the importance of considering fire safety measures other than smoke alarms where particular risks are identified. Such measures could include working with other agencies, such as social care, to ensure the usage of fire-safe materials in the property, particularly bedding, and installation of fire suppression systems. This is particularly important for those with both age and non-age-related physical impairments, or for those known to misuse substances or alcohol who will be less able to respond quickly to a fire.
As 26 individuals had previously had a home fire-risk check, it is evident that people at risk are being identified by FRSs; however, given that a further 86 individuals not recorded as having previous contact with FRSs were identified as having some level of overall impairment, there could be more to do to reach those potentially at risk or vulnerable. It would be useful to explore this further and improve the evidence base on the effectiveness of different interventions.
1. Introduction
The vast majority of fires attended by fire and rescue services (FRSs) in England do not result in loss of life or serious injury. However, an average of 5 people a week died in a fire in England in the year ending 31 March 2019 and, as the tragic events at Grenfell Tower in June 2017 showed, fires can cause multiple fatalities and many other adverse outcomes.
While the number of fire-related fatalities has declined markedly from a peak of 755 since current records began in 1981 to 251 in the year ending March 2019, it is important to keep knowledge and understanding of the profile and circumstances of fires which result in a fatality up to date to inform prevention activity and further reduce the numbers of fire-related fatalities.
This report presents findings from research designed to provide an in-depth analysis of fire-related fatalities in England. It also considers whether fires that resulted in severe casualties were notably different from those that resulted in fatalities, and thus whether a different approach to reducing non-fatal casualties is required.
1.1 Aims
The aims of this research were to:
- better understand the circumstances of fires that result in fatalities and severe casualties
- examine the risk across the population of being a severe casualty or fatality of fire
- understand the differences between fatal fires and fires which result in a severe casualty
- explore the behaviours of victims of fatal fires, leading up to and during the fire
- assess the consistency of fire investigation reports (FIRs) and provide recommendations for best practice for documenting fire-related fatalities
2. Background
The last published in-depth review of fatal fire data in England was conducted in 2006 on behalf of the Department for Communities and Local Government (DCLG) (now Department for Levelling Up, Housing and Communities – DLUHC). To contextualise the findings from the current research, we have identified key papers on fatal fire research since 2006. This section describes the DCLG commissioned paper, key papers published since with a focus on fatal fires in the UK and compares these to international findings.
2.1 DCLG research into fatal fires (2006)
Research conducted by Greenstreet Berman in 2006, on behalf of DCLG, analysed 535 FIRs from the period 2001 to 2006 to identify the characteristics and behaviours of those most at risk of fatal fires (Smith & Wright, 2006). The research identified that over half of the victims of fatal fires were over the age of 50, despite representing less than half of the population. In addition, careless use of smoker’s materials was responsible for almost half the fires, and there was a high level of mental and/or physical impairment among the victims, particularly age-related impairments. The research also indicated that household type – particularly being a single adult, and even more so a lone older person – was associated with fatal residential fires, along with use of alcohol and cigarettes, especially amongst middle-aged persons, but less so amongst older people.
2.2 Fatal fires in the UK
Limited robust research has been conducted into fire-related fatalities since 2006 (Clark, et al., 2015; Turner, et al., 2017). In an extensive review of academic literature, Clark et al. (2015) demonstrated that compared to other areas such as crime, illness or risk-associated activities such as smoking, there was limited research exploring the behaviours and characteristics of those involved in fires. Similarly, in a large-scale systematic review looking into risk factors associated with unintentional house fires, injuries and deaths, Turner et al. (2017) identified only 11 suitable papers. All papers in the systematic review were rated as medium or low quality using the Newcastle-Ottawa Scale for literature reviews where the research reviewed is not experimental (Wells, et al., 2011).
Despite the low-quality ratings identified in the Turner et al. (2017) systematic review, the research concluded with findings consistent with the DCLG study that older residents were at increased risk of injurious fires. It was, however, also found that properties with higher numbers of older residents were significantly less likely to experience a fire in the home.
Overall, the number of fire-related fatalities per year has decreased over time (Bryant & Preston, 2017). Home Office research identified a few key factors that could be associated with a reduction in fatal fires in England, including an increase in households with working smoke alarms; a downward trend in smoking, drug and alcohol use; improved safety standards, including regulations for furniture and furnishings; and FRSs’ preventative work and fire safety education. Conversely, it was suggested that an increasing, ageing population, and increased overcrowding in homes could act as an upward pressure on these trends.
2.3 Fatal fires internationally
The downward trend in fires and fire-related fatalities, and the profile of fatal fire victims, was mirrored internationally (Harpur, 2014; Doyle, et al., 2019; Giebułtowicz, et al., 2017; Sadeghian, et al., 2019; Jonsson, et al., 2015; Xiong, et al., 2015; Winberg, 2016; Ahrens & Evarts, 2017). In a review of published national statistics from 42 countries, Winberg (2016) found that both USA and Great Britain have reduced the number of fire fatalities most significantly over the past three decades, and now have a lower fire death rate per capita compared with their home country of Sweden. It concluded that, unlike in Sweden, USA and Great Britain have introduced enhanced fire regulations for furniture and furnishing.
Despite noting issues in comparing international statistics, due to varying reporting styles, the Fire Service Academy in the Netherlands compared the statistics for nine European counties and found a common risk profile (Fire Service Academy, 2018).
Besides age, gender, and physical and mental impairment characteristics, most studies have linked measures of deprivation, such as low income, with a relatively high prevalence of fire. This includes a study of 189 countries using World Health Organisation and World Bank data that found a statistically significant link between a nation’s income level (including Gross Domestic Product per capita, Gross National Income per capita, and Gini) and the number of fire-related fatalities (Peck & Pressman, 2013).
Further to this, two recent studies used cluster analysis to show the combinations of factors associated with fatal fires (Jonsson, et al., 2017; Coates, et al., 2019). Coates et al. (2019) used coroner’s data to find common co-occurrence of factors such as age, disability, and presence of medications or alcohol in blood. Similarly, in a study of fire-related fatalities in Sweden, Jonsson et al. (2017) used cluster analysis to identify six common case studies of fatal fires:
- fatalities typically involving older people, usually female, whose clothes were ignited
- fatalities involving middle-aged (45 to 64 years old), often intoxicated men, where the fire usually originated from furniture
- fires caused by technical fault, started in electrical installations in single person households
- fires caused by cooking appliances left on
- fires with unknown cause, room and object of origin
- deliberately set fires
Alternative prevention activity, other than smoke alarm installation, aimed at those who are most at risk of fatal fires was recommended in a few papers, for example residential sprinkler system installation. This, it was argued, would be more suited to people who are older or have disabilities (Coates, et al., 2019). Better co-operation between various public services such as FRSs, psychiatric clinics and other social services was also suggested (Jonsson, et al., 2017).
2.4 Comparing severe casualty and fatal fires
The behaviour of individuals leading up to and during a fire, and their ability to respond, can influence the outcome of a fire. A study by the Fire Service Academy in the Netherlands, investigated the difference between fatal and non-fatal casualties in 56 fatal fires and 152 non-fatal fires (Kobes, M. & van den Dikkenberg, 2016). Using fire service data collected at fires alongside a survey of survivors, the research found key factors associated with fatal rather than non-fatal casualties. These were the ability to respond to the fire, for example being awake or having mobility, and the position of the fire in relation to exits. When exploring fire response, the time between the fire starting and the fire service being notified was considered a more important factor than the time it took for the fire service to arrive on scene once they had been notified.
2.5 Conclusion
While there is a lack of recent research on fatal fires, the available studies consistently identified age, the presence of an impairment such as physical disability, smoking and alcohol use as key factors. This study’s analyses of national fire data will help understand if these patterns still hold in England. The literature is less clear on whether these factors are different to those in a non-fatal fire. In addition, the data analysed in identified literature does not fully explore the behaviours of the individuals in fatal fires.
3. Research design
In order to fully understand fires involving a fatality and the behaviours of those involved, this research comprised two parts:
- in phase one, Home Office Incident Recording System (IRS) data were analysed to explore the circumstances of fires involving a fatality or severe casualty in the years ending March 2011 to 2019. Long-term trends were also explored using historical data
- in the second phase fire investigation reports were analysed to explore the behaviours of victims, and circumstances of fatal fires in the year ending March 2017
In addition, to contextualise the findings of the research, key publications were reviewed as discussed in Chapter 2.
3.1 Phase one
Phase one analysed IRS data to understand the circumstances of fires that result in fatalities and severe casualties. A range of analysis techniques was used to understand the differences between these types of fires, and to examine the risk across the population of becoming a severe casualty or fatality of fire.
3.1.1 Data sources
The data used in this report included:
- data on fires involving casualties, and the national population, for years ending March 1982 to 2019
- detailed incident and victim data on fatal and severe casualty fires from the IRS for years ending March 2011 to 2019
- FRS population data from years ending March 2010 to 2018 provided by the Office of National Statistics (ONS)
- indices of multiple deprivation (IMD) data for years ending March 2010 and 2015 published by the Ministry of Housing and Local Government (MHCLG) (now called Department for Levelling Up, Housing and Communities),
- English Housing Survey (EHS) data for the year ending March 2019 published by MHCLG
Prior to the IRS, casualties were reported as either fatal or non-fatal. Since the Home Office introduced the IRS, casualties in fires have been defined by injury severity:
- precautionary checks recommended (precautionary checks)
- first aid given at scene (first aid)
- victim attended hospital as an out-patient (hospital slight)
- victim went to hospital and stayed overnight as an in-patient (hospital severe)
- fatality
Further information on these sources is in Appendix A. Definitions and terminology used in this report match those used in published statistics unless specified. Please see the definitions guidance for fire statistics for more information.
3.1.2 Analysis
The analysis conducted was primarily descriptive to show the frequency of factors associated with fatal and severe casualty fires. This covered overall numbers of fires, fatalities and non-fatal casualties since the year ending March 1982. The circumstances of fatal and severe casualty fires were then explored from the year ending March 2011 onwards. The latter included building or location type, fire start location, time of day and day of week, and household type. Further analysis explored included local variation, links to deprivation, further circumstances of fire such as source of ignition, cause of fire and fire spread, and victim characteristics including age and gender.
Given fatal and severe casualty fires are relatively rare, data for the years ending March 2011 to 2019 were combined to produce a large enough number to draw meaningful conclusions.
3.1.2.1 Regional analysis
The local variation in where fatal and severe casualty fires occurred were explored using population data at an FRS level and deprivation data. Rates of fatal and severe casualty fires, in relation to population, were mapped to visualise differences between FRS areas. This was done by taking the total number of these fires per year in each FRS area and dividing it by the population for each FRS in each year. These were then averaged to account for year-on-year fluctuations.
Each fire was mapped according to X and Y coordinates logged at the time of the fire to its relative deprivation area score using ArcGIS® software by ESRI1. These deprivation areas were divided into ten equal groups (or deciles) according to their deprivation rank across England. The total number of fires per decile was then calculated to understand the correlation between fires and each level of deprivation.
Notes:
- ArcGIS® and ArcMap™ are the intellectual property of ESRI and are used herein under license. Copyright © ESRI. All rights reserved. For more information about ESRI® software, please visit www.esri.com.
3.1.2.2 Further circumstances of fire analysis
Details on the source of ignition, cause of fire and spread of fire were analysed by calculating the number of fatal and severe casualty fires per 1,000 fires. The presence and functionality of smoke alarms were explored by calculating the frequency of fatal and severe casualty fires in which they were present. In addition, EHS data on smoke alarm ownership across England were used to calculate the relative risk of fatality or severe casualty when a working smoke alarm was present.
3.1.2.3 Victim analysis
Victim age and gender were analysed using relative risk analysis to understand if particular age groups or genders were at greater risk of fatal or severe casualty fires. This analysis compared the rate of occurrence for a specific group to that of the whole population. For instance, the relative risk of a fire fatality for females per age group was calculated by dividing the rate of fire fatality per million population for each age group by the rate of fire fatality in the general population (total male and female population of all age groups). The average risk for the general population is 1.0. A value higher than 1.0 demonstrates a higher risk of a fire fatality. In this analysis, multiple victims from the same fire were analysed separately.
3.2 Phase two
Phase two of the research focussed on exploring the behaviours of fatal fire victims leading up to, and during the fire, and assessing the consistency of FIRs and provide recommendations for best practice for documenting fire-related fatalities going forward. Only dwelling fires – fires that happen in the home – were included in this analysis, as these are where most fatal fires occur and where the fire service can have the biggest impact within the current legislation.
3.2.1 Reports
To undertake in-depth analysis, FRSs were asked to provide FIRs for fatal fires in dwellings for the year ending March 2017. The year ending March 2017 were chosen for analysis as finalising FIRs can take longer than one year, meaning the reports offered the most recent and complete sample.
A total of 203 FIRs were provided by 39 FRSs in England. Three FRSs could not supply the information (primarily due to the investigation having been undertaken by another agency such as the police, or a formal FIR not being written as it was covered via a witness statement or Coroner’s report not held by the FRS). A further 3 FRSs did not experience any fatalities during that year. There were 18 fatal fires identified in the IRS data but excluded from the research either due to the fatality not being fire-related or the report not being received. Investigation reports for 185 fires relating to 201 victims were therefore used in the analysis.
Building on previous research and reading a sample of 40 fatal fire investigation reports provided by London Fire Brigade, a data collection framework with approximately 100 variables was developed to extract information from the reports. Cambridgeshire FRS piloted this framework which covered information routinely recorded in the IRS plus further details outlined in ‘Additional information covered in FIRs’ below.
Once the database was finalised, all reports provided were read and coded. If 2 or more victims were in a fire, each victim was coded separately. As per General Data Protection Regulation protocols, FRSs were requested to redact all personal information from the reports before sharing them with the Home Office. Further details on the information collected and data analysed is available in Appendix B.
Additional information covered in FIRs
Further circumstances of fire: Including property tenure, detail on deliberate fires, detail on item first ignited, victim activity at the time of the fire.
Fire discovery and escape behaviour: Including presence and function of smoke alarms, victim’s response to fire including escape behaviour, and other individuals’ response to fire, including calling 999 and attempting to rescue the victim.
Presence and impact of impairments: Including whether the victim was mentally or physically impaired, whether they were a substance user, and whether these were considered to have contributed to the fire or outcome.
Previous history of victim: Including evidence of unsafe fire behaviours, and if the individual had any previous contact with the FRS or other agencies.
3.2.2 Analysis of FIRs
The frequency of all factors was analysed to understand if the fatal fires in the year ending March 2017 were similar to those analysed in phase one, and to understand the prevalence of circumstances, behaviours and impairments in fatal fires. Further to this, K-modes cluster analysis was conducted to identify fatal fire scenarios that can target fire safety initiatives (This analysis used R along with the package klaR).
K-modes analysis groups categorical data into ‘clusters’ of characteristics, behaviours and circumstances which are often observed together. Using R software, the analysis was run iteratively to find the number of clusters that best suited the data and with the least number of observable differences within each cluster. Further information on this approach is in Appendix C. Descriptive analysis on the dominant characteristics, behaviours and circumstances observed in each cluster were then used to develop the fatal fire case studies.
3.3 Background literature
In order to identify relevant literature that would help contextualise the findings of the further research, key papers that covered fire-related fatalities were identified from an existing database of fire-related research. Forwards and backwards citation searches identified additional relevant papers. In addition, broad search terms identified further papers using online databases including Google Scholar, JSTOR, Springer, Science Direct and EBSCOhost (search terms were iterative but included “Fire” AND (“Fatal” OR “Death” OR “Casual*”). Searches focussed on identifying national level research, or systematic reviews, that would give context to the overall profile of fire-related fatalities or severe casualties.
This method identified 63 papers. Only those published since 2006 were included in the review as this was the last time that research similar to phase two of this report was published in England (Smith & Wright, 2006). Titles and abstracts were screened for relevance and 37 were excluded as being out of date, briefing rather than research based, technology focussed, for example methods of scene investigation, or case studies of major events such as major industrial incidents. Eight were identified as contained within a systematic review already included. Information on scope, methodology and key findings of each of the papers were extracted and summarised for the report (see Chapter 2).
4. Findings from the Incidents Recording System
This section first explores the long-term trends in fire-related fatalities and severe casualties using data from the IRS (see ‘Recording of fatalities and casualties in the IRS’ additional information below for more detail). An in-depth review of factors associated with fatal and severe casualty fires is then presented by exploring the location of fatal and severe casualty fires, timing, types including source of ignition and spread of fire, and the profile of victims of fatal and severe casualty fires. Key findings are presented and further detail along with data tables can be found in Appendix D.
Recording of fatalities and casualties in the IRS An incident record from a fire is generally completed by one of the firefighters on scene shortly after an incident. These records can then be updated with further information and for fatalities is updated once a fatality has been confirmed, or the cause of death is established. This can be some time after an incident if, for example, an individual later dies from complications as a result of an injury in the fire, or an investigation is held into the cause or circumstances of the fatality such as an inquiry.
Firefighters are asked to record if the fatality or injury is fire-related, and where this is not immediately clear it is coded as ‘don’t know’ in the IRS. For the purpose of Home Office publications, a fire-related fatality includes those that were recorded as ‘don’t know’. Casualties are those resulting from a fire, whether the injury was caused by the fire or not. FRSs are asked to update the information once known and figures are revised in each statistical publication.
The figures in this report include records of incidents up to and including 31 March 2019 that had reached the IRS by 26 September 2019, when a snapshot of the database was taken for the purpose of analysis.
4.1 Trends in fire-related fatalities and severe causalities
As the population is rising it could be expected that there would be more fires, as they are generally caused by human behaviour, and, in turn, more fatal and non-fatal casualties. Despite a rising population however there has been a long-term downward trend in fires, fatalities, all non-fatal casualties, and specifically severe casualties since the 1980s. The overall risk of being a casualty in a fire has therefore decreased however the extent of the decline in fire-related fatalities and casualties differs and is explored in this section.
Historic data on the number of primary fires have been available since the year ending March 1982, and all fires since 19961.
Notes:
-
Primary fires are defined as potentially more serious fires that harm people or cause damage to property and meet at least one of the following conditions:
- any fire that occurred in a (non-derelict) building, vehicle or (some) outdoor structures
- any fire involving fatalities, casualties or rescues
- any fire attended by five or more pumping appliances
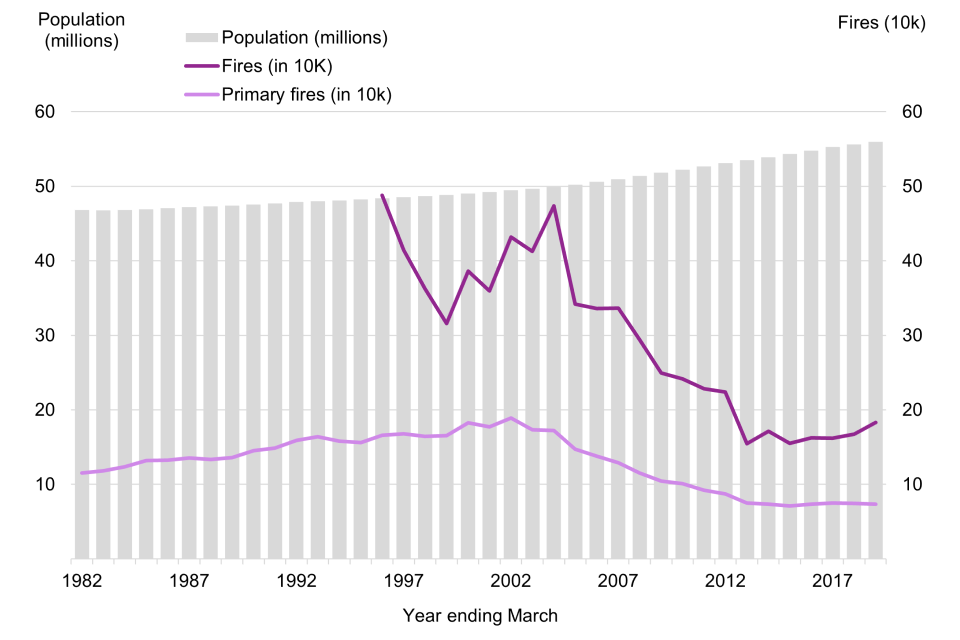
Since a peak of 189,068 primary fires in the year ending March 2002, these have declined by 61% to 73,267 in 2019. All fires have declined by 62% from 487,600 in the year ending March 1997 to 182,906 in the year ending March 2019. Figure 1 shows this trend in context of a rising population.
Figure 1: Trends in fires, England, years ending March 1982 to 2019
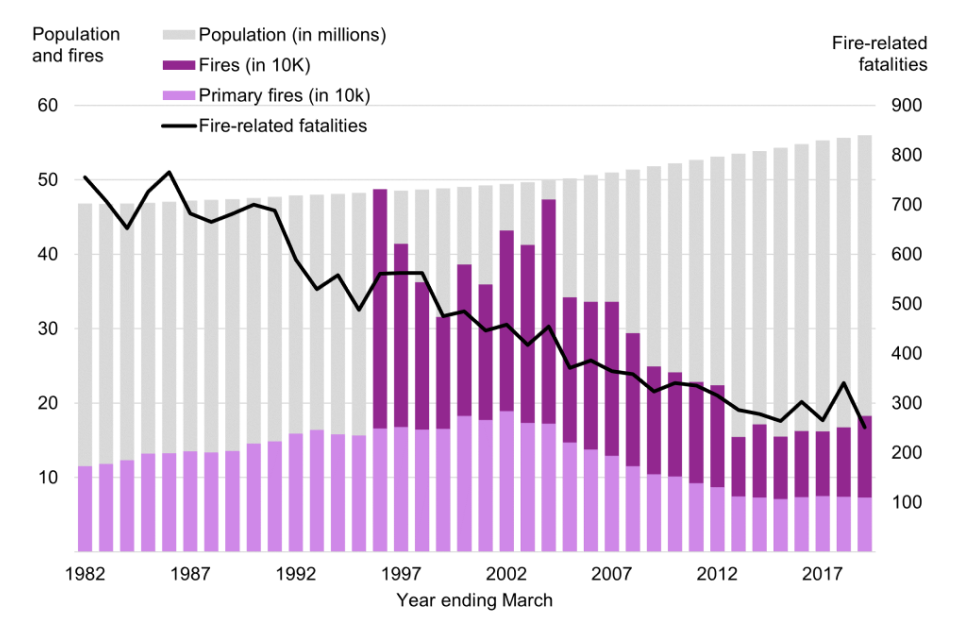
Since a peak of 765 fire-related fatalities in the year ending March 1986, fire-related fatalities have declined by 67% (Figure 2). Despite an increase in the population over time, the rate of fatalities per million population has fallen by 72%, from 16.1 to 4.5 per million population. This is a decline of 31% from 6.5 per million population in the year ending March 2011. The number of fatalities per 10,000 fires however fluctuated over the years with peaks of 20 fatalities per 10,000 fires in the year ending March 2018, and 19 per 10,000 fires in the year ending March 2016 and 2013, and lows of 10 per 10,000 fires in the years ending March 2003 and 2004. The overall risk of being involved in a fatal fire has decreased while the risk of a fire being fatal has increased.
Figure 2: Trends in fire-related fatalities, England, years ending March 1982 to 2019
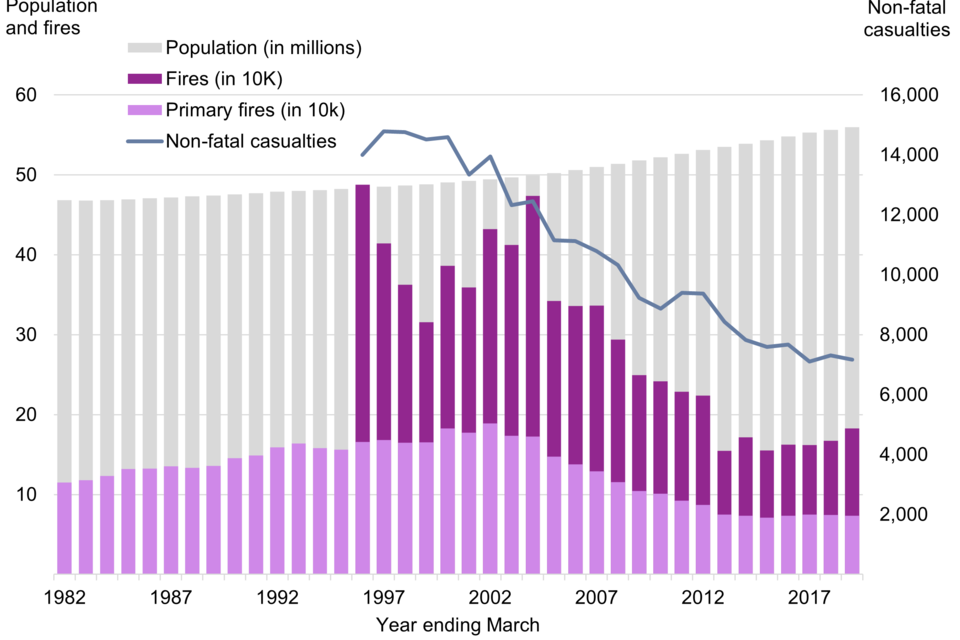
Non-fatal casualties have declined at half the rate of fatalities (Figure 3). Since the year ending March 1997, there has been a reduction in the number of non-fatal casualties by 52% and, given a 15% increase in the population during this time, the non-fatal casualty rate has declined by 58%. This is a decline of 28% since the year ending March 2011 from 179 per million population. The number of non-fatal casualties per 10,000 fires increased from a low of 287 in the year ending March 1996 to 546 in the year ending March 2013 which has since declined to 392 per 10,000 fires in the year ending March 2019. The overall risk of being involved in a casualty fire has therefore decreased.
Figure 3: Trends in non-fatal casualties, England, years ending March 1982 to 2019
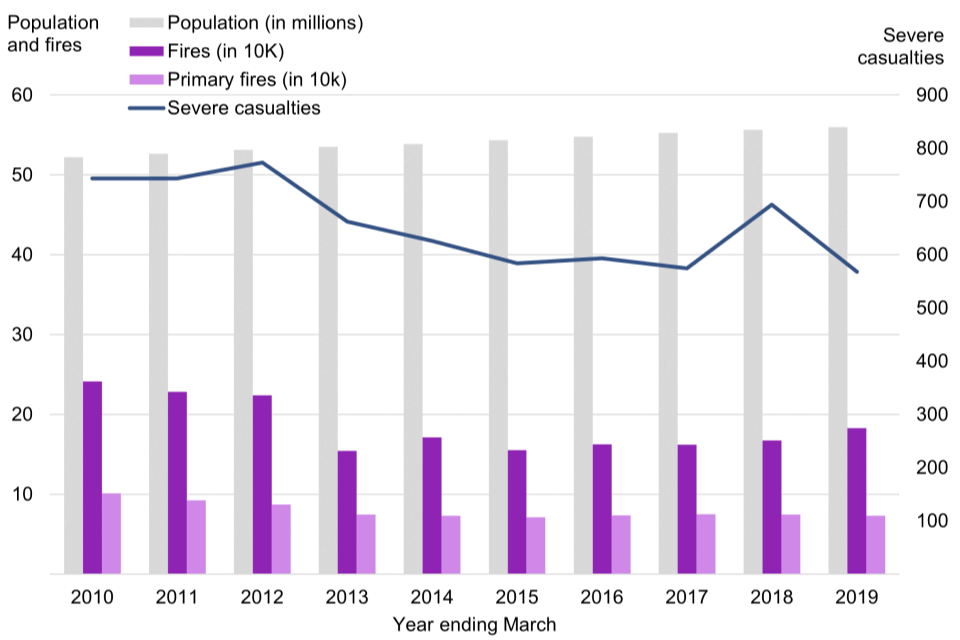
Since 2009, when the electronic IRS was introduced, non-fatal casualties have been categorised by injury severity. Since then, severe casualties, where the victim went to hospital and had at least an overnight stay in hospital as an in-patient, have also been on a downwards trend (Figure 4). There has been a 23% reduction of severe casualties from 743 in the year ending March 2011 to 568 in year ending March 2019 and the population has increased by 6%. The rate of severe casualties has decreased by 28% from 14.1 per million population to 10.1. The number of severe casualties per 10,000 fires was the same in the years ending March 2019 and 2010 at 31, however there have been peaks of 43 per 10,000 fires in the years ending March 2013, and 41 in 2018. The overall risk of being involved in a severe casualty fire has decreased but the risk of a fire involving a severe casualty has stayed the same.
Figure 4: Trends in severe casualties, England, years ending March 1982 to 2019
The decline in numbers of fatalities and severe casualties in the context of increasing population levels indicates means the overall risk of being involved in these fires has decreased. The difference in the trend when considering the reduced risk of a fire involving a fire-related fatality or severe casualties suggests there might be different factors affecting fatal and non-fatal fires.
4.1.1 Fires with multiple victims
In the year ending in March 2011 to 2019, there were:
- 2,356 fatal fires which involved 2,637 fatalities1
- 5,128 severe causality fires which involved 5,817 severe causalities
Notes:
- For the purpose of publications, figures included the number of fatal casualties which were either recorded as ‘fire-related’ or ‘don’t know’. Of the 2,637, 11% (283) were classified as don’t know as to whether these were fire-related.
Most fatal fires result in one fatality and, although not as rare as multiple fatality fires, fires which result in more than one severe casualty are uncommon (Table 2). Severe casualties and fatalities rarely occur together in the same fire. In the years ending March 2011 to 2019, 102 fires (1.3% of all fatal and severe casualty fires) resulted in at least one fatality and at least one severe casualty. Further exploration of fatal and severe casualty fires can determine if there are distinct victim or fire characteristics that influence the outcome of a fire.
Table 2: The number of fatalities and severe casualties resulting from fire, combined data for years ending March 2011 to 2019
| Number of fatalities | Number of fires with fatalities | % of all fatalities | Number of severe casualties | Number of fires with casualties | % of all severe casualties |
|---|---|---|---|---|---|
| 1 | 2,213 | 83.9% | 1 | 4,684 | 80.5% |
| 2 | 108 | 8.2 % | 2 | 336 | 11.6% |
| 3 | 17 | 1.9% | 3 | 67 | 3.5% |
| 4 | 8 | 1.2% | 4 | 19 | 1.3% |
| 5 | 5 | 0.9% | 5 | 13 | 1.1% |
| 6 | 3 | 0.7% | 6 | 5 | 0.5% |
| 11 | 1* | 0.4% | 7 | 2 | 0.2% |
| 71 | 1** | 2.7 | 8 | 1 | 0.1% |
| 67 ** | 1 | 1.2% |
Key:
-
*Shoreham Airshow Disaster
-
**Grenfell Tower Fire
There have been 2 major recent fires that have involved multiple casualties.
On 22 August 2015, a former military aircraft crashed during an air display at the Shoreham Airshow at Shoreham Airport, in West Sussex. During an aerobatic manoeuvre the aircraft crashed onto a main road and fuel escaping from the fuel tanks ignited in a large fire. There were 11 fatalities in this incident. The official inquiry into the fatalities has yet to be concluded and were therefore recorded as ‘don’t know if fire-related’ in the IRS.
On 14 June 2017, a fire broke out in the 24-storey Grenfell Tower block of flats in North Kensington, West London. From an initial refrigerator fire, the fire spread rapidly across the building. The fire claimed the lives of 71 people who were present in the tower that night. Another resident who had escaped from the building, seriously affected by smoke inhalation, died seven months later. A total of 227 people in all (residents and visitors) escaped from the tower and there were 67 severe casualties recorded. At the time of publication, the Grenfell Tower Inquiry had concluded hearings for Phase 2 and was preparing the final report.
4.2 Where do fatal and severe casualty fires occur?
This section explores whether certain areas of England have experienced higher rates of fatalities and casualties than others, and in which buildings or locations these fires occur.
Key findings
- fatal and severe casualty fires occurred more frequently in deprived areas
Location of fatal and severe casualty fires:
- fires involving a fatality or severe casualty most often occurred in indoor locations (1,952 fatal fires and 3,969 severe casualty fires) and specifically in residential buildings (1,844 fatal fires and 3,479 severe casualty fires)
- the most common room of origin for fatal dwelling fires was the living room (685 fires) whereas for severe casualties it was the kitchen (1,195 fires)
- fatal fires in other buildings (not classified as dwellings) occurred more frequently in residential properties (36 of 144 fires) such as a residential home, whereas severe casualties most frequently occurred in industrial premises (123 of 600 fires)
- road vehicle fires that involved a fire-related fatality or casualty were relatively infrequent (247 fatal fires and 573 severe casualty fires), and generally occurred in cars
- outdoor fires that involved a fatality or severe casualty were rare (157 fatal fires and 586 severe casualty fires) and generally occurred close to a building or structure
4.2.1 Local variation
Fire-related fatalities and severe casualties did not occur evenly across the country. The numbers of fatalities and severe casualties were highly correlated with the size and density of the population, meaning these fires occurred more frequently in the metropolitan areas (Population estimates by FRS can be found in Table FIRE1401 ).
In the years ending March 2011 to 2019, the total number of fatalities and severe casualties across FRSs varied from 0 fatalities and 1 severe casualty in the Isles of Scilly to 449 fatalities and 778 severe casualties in Greater London. The differing numbers of fatalities and severe casualties across the country were not necessarily linked to the actions of those FRSs and were possibly due to local characteristics of those areas.
4.2.1.1 Deprivation
The IMD combines data on seven domains of deprivation (income, employment, health deprivation and disability, education and skills training, crime, barriers to housing and services, and living environment) through a weighing system to produce a single ranking, organised into ten equally sized groups.
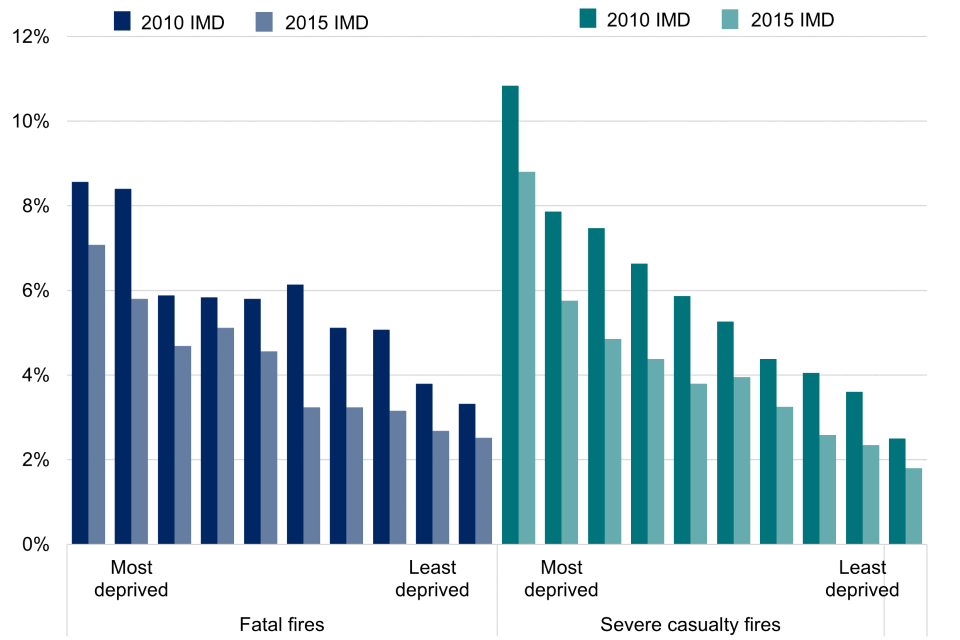
The number of fire fatalities and severe casualty fires were highly correlated with deprivation indices. The areas defined by the IMD as the most deprived half of England, accounted for 63% of fatal fires and 67% of severe casualty fires (full data shown in Appendix D). As the level of deprivation increased, the number of fire-related fatalities and casualties increased.
Considering both iterations of the IMD, 16% (334) of fatal fires and 21% (951) of severe casualty fires happened in the most deprived 10% of areas in England. This compares with 5% (106) of fatal fires and 4% (186) of severe casualty fires occurring in the least deprived 10% of areas in England. The relationship is shown in Figure 5. This has held true for both iterations of the IMD.
Figure 5: The proportion of fatal fires (left) and severe casualty fires (right) in each deprivation decile in England, combined data for years March 2011 to 2019
4.2.2 Location of fatal and severe casualty fires
Despite a large proportion of fires since the year ending March 2011 occurring outdoors, relatively few of these resulted in a fatality or severe casualty (157 and 586 since that year). This was probably due to the likelihood of an individual being in proximity to the fire being lower in outdoor locations. As fire safety policy is generally defined by the building type or how it is used, for example requirements to install sprinklers, it is important to understand in which buildings, or locations, fatal and severe casualty fires occurred more frequently.
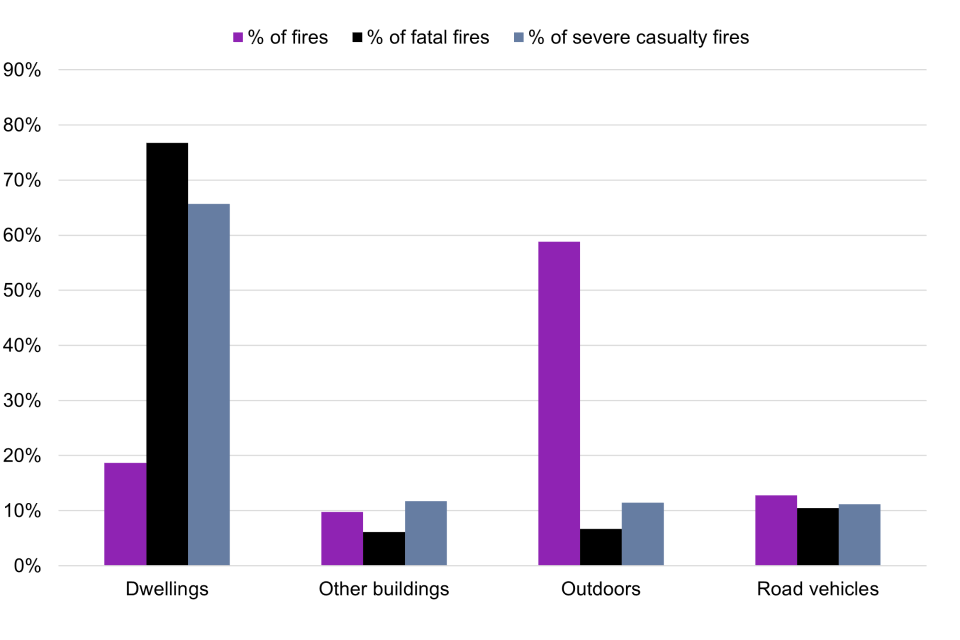
There are four major location categories within the fire data: dwellings, other buildings, road vehicles and outdoor. Dwellings are non-commercial residential properties such as houses and apartments. Other buildings are split between residential properties such as care homes, and non-residential properties such as office buildings. Analysis did not take into account composition of the total building stock and therefore the proportions of fires may reflect the proportions of each dwelling type generally. (Further information on this can be found in the detailed analysis of fires attended by fire and rescue services, England, April 2018 to March 2019).
After outdoor fires, the highest number of fires occur in dwellings. It is therefore not surprising that both fatal (77% or 1,808) and severe casualty (66% or 3,369) fires occurred most commonly in dwellings. Nearly equal proportions of severe casualty fires occurred in other buildings (12% or 600), and road vehicles (11% or 573). However, road vehicles accounted for larger proportions of fatal fires (10% or 247) compared with other buildings (6% or 144) and outdoor locations. It can be reasonably assumed that persons in a vehicle fire are more likely to be in proximity of the fire, with fewer means of escape, than in other buildings and outdoor fires.
Figure 6: Location of all fires, fatal fires, and severe casualty fires, years ending March 2011 to 2019
4.2.2.1 Dwelling fires
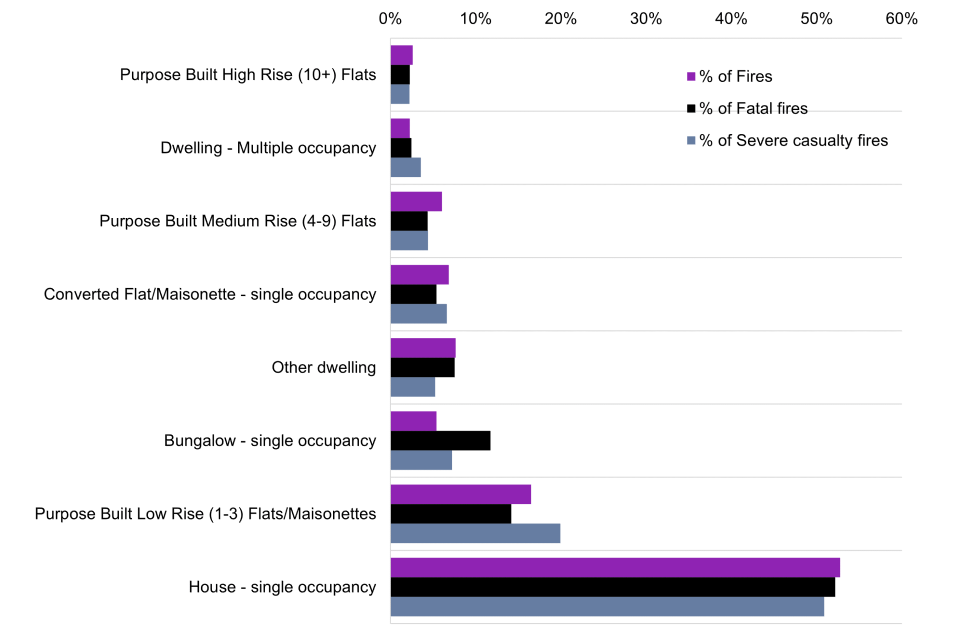
The proportion of fires which resulted in a severe casualty or fatality was similar across almost all dwelling types with the highest proportions for both in single occupancy houses. This indicates that the dwelling type did not greatly impact on the outcome of a fire. However, this did not hold for bungalows, where there were a higher proportion of fatal fires than severe casualty fires. It could be there was a characteristic of the victims more likely to live in these properties which made the fires more likely to be fatal.
Fatal and severe casualty fires were proportionally least common in purpose-built high-rise (10 or more storeys) flats, representing 2% of both fatal fires and severe casualty fires (41 and 75). However, the lowest proportion of fatal and severe casualty fires were in houses of multiple occupancy (2% and 4% respectively). It should be noted that while the number of fires in purpose-built high-rise flats was low, this category includes the Grenfell Tower fire.
Figure 7: All fires and fatal and severe casualty fires in dwelling type, years ending March 2011 to 2019
In all dwelling types, the fire start location for the majority of both severe casualty fires (1,552, 46%) and fatal fires (1,248, 69%) was either the living room, bedroom or bedsitting room. The living room was the most common starting location for fatal dwelling fires (685, 38%), whereas severe casualty fires most frequently began in the kitchen (1,195, 35%). This suggests that the room in which the fire started was likely to be a factor in the outcome. The cause of fire was recorded as deliberate in 267 fatal dwelling fires (15%) and 684 severe casualties (20%).
4.2.2.2 Other building fires
Other building fires are fires that occurred in a non-derelict building that was not a dwelling. This includes both residential buildings such as care homes and hotels, and non-residential buildings such as offices. Other buildings were generally covered by the Regulatory Reform (Fire Safety) Order 2005, meaning they were subject to more regular scrutiny in terms of fire safety. These regulations are intended to reduce the likelihood of unsafe environments that could lead to fires and, when fires do occur, appropriate systems should be in place to safely evacuate the building and suppress the fires.
There were 144 fatal fires (6% of all fatal fires) and 600 severe casualty fires (12% of all severe casualty fires) in other buildings in the years ending March 2011 to 2019. The majority of fatal other building fires occurred in residential homes, or private non-residential properties such as sheds and summer houses, whereas severe casualties most frequently occurred in industrial premises. The low proportion of fatal and severe casualty fires in non-residential buildings, was likely due to people within these buildings being more alert to fire.
Similar to dwellings, fatal and severe casualty fires in residential other building fires were most likely to start in the bedroom or bedsitting room (61% (22) fatal and 50% (55) severe casualty). In non-residential properties, fatal or severe casualty fires were mostly likely to start in an ‘other’ location (31% and 40% respectively) followed by the garage (17% and 14%). The cause of fire was recorded as deliberate in 49 fatal other building fires (34%) and 165 severe casualties (28%).
There were more locations in which the fire started for severe casualty fires than fatal fires. This reflects the greater diversity in the type of buildings where severe casualty fires occurred and suggests there is more variability in severe casualty fires that will need to be considered when targeting fire safety interventions.
4.2.2.3 Road vehicle fires
There were 247 fatal fires (10% of all fatal fires) and 573 severe casualty fires (11% of all severe casualty fires) in road vehicles in the years ending March 2011 to 2019. The majority of fatal fires occurred in cars (200, 81%), with very few in other vehicle types such as lorries or motorcycles. While the majority of severe casualties also occurred in cars (353, 62%), higher proportions occurred in incidents with multiple vehicles (64, 11%). The cause of fire was considered to deliberate for 113 fatal road vehicle fires (46%) and 51 severe casualty road vehicle fires (9%).
The complexity of these fires, a scenario whereby the victim could not escape, may increase the difficulty of assigning cause to injuries. For this reason, it was not always confirmed that severe casualties in road vehicle fires were fire-related. The cause of fire for 85 fatal fires in road vehicles (34%) and 352 severe casualty fires in road vehicles (61%) was listed as ‘vehicle crash’ or ‘collision’.
The most frequent starting point of fatal road vehicle fires was in the driver or passenger area (50%), whereas severe casualty fires most commonly started in the engine (51%). The difference in outcome was likely affected by the victim’s proximity to the fire and therefore ability to escape.
4.2.2.4 Outdoor fires
There were relatively few fatal fires (157 or 7% of all fatal fires) and severe casualty fires (586 or 11% of all severe casualty fires) that occurred as a result of an outdoor fire. These generally occurred where people were expected to be present, for example in a domestic garden. Furthermore, the fire start location in outdoor fires was often near housing (41 fatal outdoor fires and 197 severe casualty outdoor fires). A large proportion of the fatal fires outdoors (82 or 52%) were deliberate and 140 severe casualty outdoor fires (24%) were deliberate.
Figure 8: All outdoor fires and fatal and severe casualty fires by location, years ending March 2011 to 2019
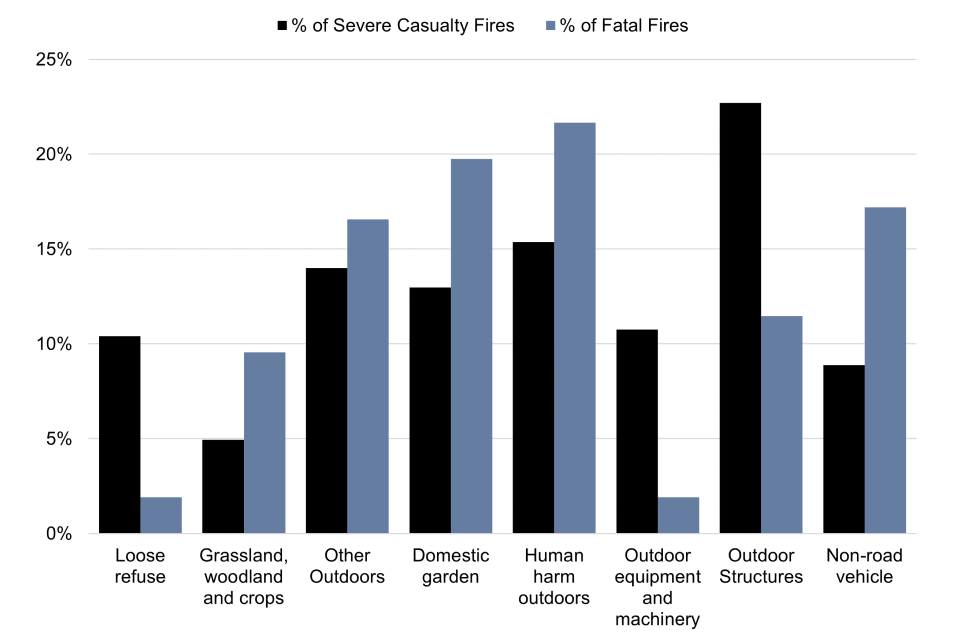
Notes:
- Human harm outdoors is defined as fire where the focus of the fire was the individual involved, for example self-immolation.
4.3 When do fatal and severe casualty fires occur?
Fires generally occurred more during the evening (between 16:00 and 22:00) and, in the case of outdoor fires, were more frequent during the summer months (Home Office, 2019). It is important to understand if these patterns held for fatal and severe casualty fires as this can influence decisions around firefighter shift patterns, and at what times during the year it would be appropriate to run education initiatives on fire safety. The time of day may also link to periods of common behaviour, for example peak time cooking.
Key findings
- fatal fires more often occurred during winter months (711, 30%), with little variation based on the day of the week or time of day
- severe casualty fires occurred evenly throughout the year but more often occurred in the afternoon/evening
4.3.1 Seasonal differences
Fatal fires were not spread evenly throughout the year with more occurring in winter and spring months than summer months. While there was some monthly variation in severe casualties, they were more evenly spread throughout the year and less linked to seasons (Figure 9).
Figure 9: Average number of fatal and severe casualty fires per month, years ending March 2011 to 2019
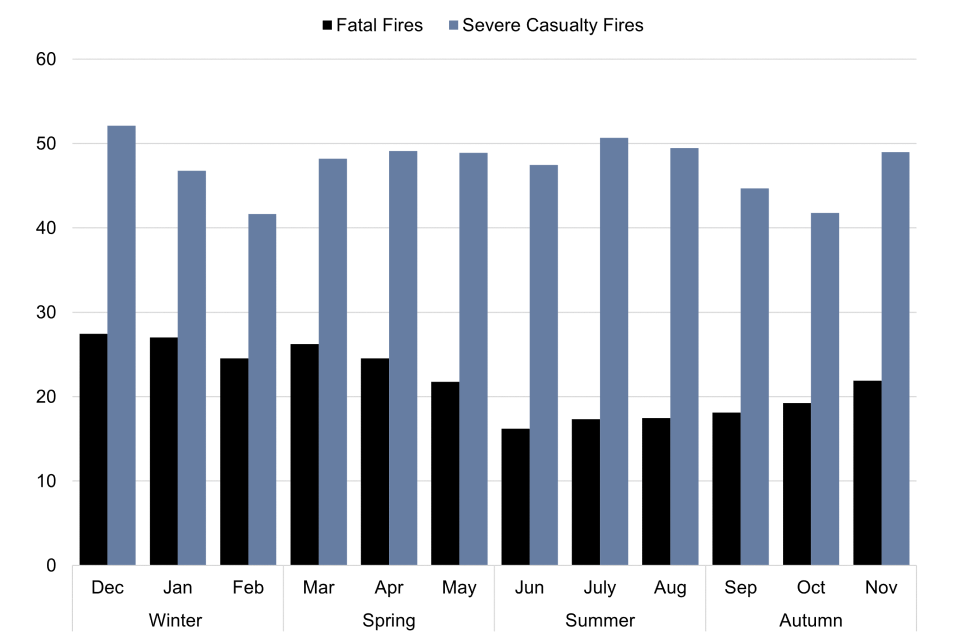
Three in ten (30%) fatal fires occurred in the winter months of December, January and February, an average of 69 per year. This compares with 19% of fatal fires which occurred during summer (June, July and August), an average of 51 per year. This trend could be associated with people being inside more during the winter months and additional use of heating equipment.
The proportion of dwelling fires that involved a fatality was higher in winter (32% of all fatal fires or 581) than any other season, whereas in other building and outdoors fires there was a higher proportion of fatal fires in spring. Road vehicle fires had similar proportions of fatal fires throughout the year. These seasonal patterns generally held true for severe casualty fires; however, the highest proportions of other building and outdoor fires involving severe casualties were in the summer. This potentially links with more people spending time outdoors or at outdoor event spaces.
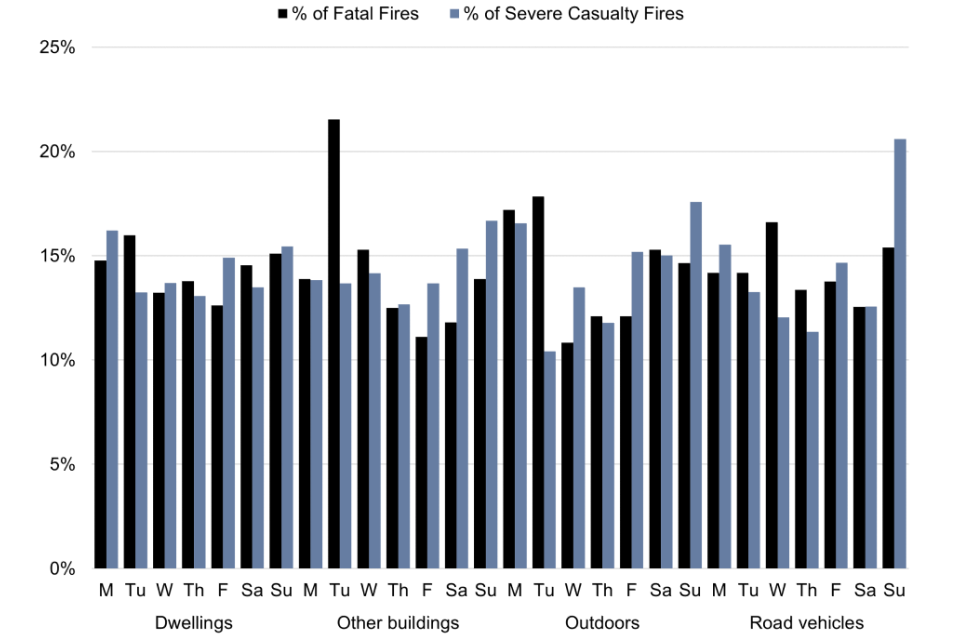
4.3.2 Day of the week
Overall, fatal and severe casualty fires occurred equally throughout the week. This was often true when considering each fire location, although a higher proportion of non-dwelling fatal fires occurred on Tuesdays than any other day of the week. It is not clear why this would be the case. Additionally, road vehicle fires involving severe casualties occurred most regularly on Sundays.
Figure 10: proportion of fatal and severe casualty fires each day by location, years ending March 2011 to 2019
4.3.3 Time of day
Fatal fires did not vary substantially depending on the time of day. However, a higher proportion of severe casualty fires occurred between 2pm and 11pm, and the fewest of these fires occurred during times people typically sleep.
Figure 11: The proportion of fatal severe casualty fires by time of day, years ending March 2011 to 2019
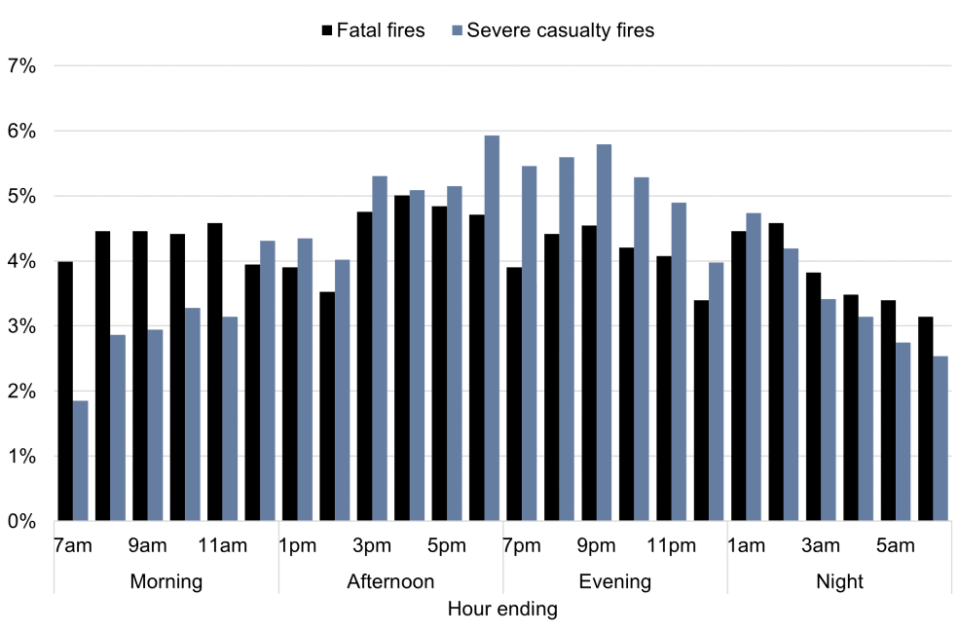
Overall, the number of severe casualty fires was lowest between 6am and 7am (95, 2%), but increased gradually through the day, with a peak of 304 (6%) occurring between 5pm and 6pm. The frequency of severe casualties then stayed fairly stable before declining gradually between 10pm and 6am.
The afternoon and evening accounted for more severe casualty fires. Over half (3,120, 61%) of severe casualty fires occurred in the afternoon and evening. Fewer severe casualty fires occurred during the early morning hours, particularly between 2am and 11am, where 26% (1,329) of fires occurred. This pattern exists across fire locations.
It is likely that fewer severe casualties occurred at night and in the morning due to sleeping patterns and lower levels of activities which increase the risk of a severe fire injury, such as cooking or smoking. This is particularly evident by a high proportion of severe casualty fires taking place at what could be considered ‘dinner time’ between 5pm and 9pm. As there was no trend in the time of day fatal fires occurred, it suggests that there are not the same links to activities such as cooking, as there are with severe casualties.
4.4 What types of fire result in fatalities and severe casualties?
The IRS collects data on how fires start, the presence of a working smoke alarm and some limited information on whether drug and/or alcohol use is believed to have contributed to the fire. This, together with data on the behaviour of the fire itself, such as the spread of fire, provides a useful indication of the types of fire which result in a fatal or severe casualty.
Key findings
- while there was a higher risk of severe casualty than fatality in all fires, the risk of fatality in a smokers’ materials fire and the risk of severe casualty were almost equal (18.3 and 18.4 per 1,000 fires)
- the item first ignited for both severe casualty and fatal fires in buildings was most often textiles, upholstery and furnishings (1,127 fatal fires and 1,792 severe casualty fires)
- fatal and severe casualty fires rarely spread beyond the room of origin or item first ignited
- there was a working smoke alarm present in a large proportion of fatal (925 or 50%) and severe casualty (1,986 or 57%) fires that occurred in dwellings or other residential properties, and the lack of a working smoke alarm increased the likelihood of a fatal or severe casualty fire
4.4.1 Source of ignition and item first ignited
For a fire to start, a source of ignition and something to be ignited are needed. Some sources of ignition are intended to flame, for example cigarette lighters, whereas others generally cause fires due to a fault, for example electrical distribution. In both cases the item first ignited is instrumental in the fire spreading.
Determining the cause of fire can be difficult depending on the extent of fire damage and so the source of ignition was unspecified in a large proportion of cases (776 fatal fires (33%) and 1,799 severe casualty fires (35%)). Where it was specified, smoking materials (including discarded cigarettes) were the source of ignition in 25% (590) of fatal fires and 12% (593) of severe casualty fires, despite only accounting for 2% (32,226) of all fires in the same period. It should be noted that while there is a higher risk of severe casualty than fatality in all fires, the risk of fatality in a smoking-related fire and the risk of severe casualty in a smoking materials fire were almost equal at 18.3 fatal fires per 1,000 smoking material fires and 18.4 severe casualty fires. Although smoking material fires had a high severe casualty rate, candle fires had the highest severe casualty fires rate overall (21.8 per 1,000 fires) (Table 3).
Although cooking appliances had a lower severe casualty rate of 7 per 1,000 fires, this was the source of ignition for the largest volume of severe casualty fires where specified, accounting for over 1 in 5 (22%, 1,117) severe casualty fires which resulted in 1,204 severe casualties.
Table 3: Number and rate of fatal and severe casualty fires per 1,000 fires by source of ignition, combined data for years ending March 2011 to 2019
| Source of ignition | Fatal fires | Severe casualty fires | Fires | Rate of fatal fires | Rate of severe casualty fires |
|---|---|---|---|---|---|
| Blowlamps, welding and cutting equipment | 8 | 69 | 5,577 | 1.4 | 12.4 |
| Candles | 94 | 204 | 9,371 | 10 | 21.8 |
| Central and water heating appliances | 5 | 10 | 3,963 | 1.3 | 2.5 |
| Cigarette lighters | 199 | 410 | 22,164 | 9 | 18.5 |
| Cooking appliances | 180 | 1,117 | 150,639 | 1.2 | 7.4 |
| Electrical distribution | 80 | 267 | 71,072 | 1.1 | 3.8 |
| Matches | 143 | 229 | 34,907 | 4.1 | 6.6 |
| Other / Unspecified | 776 | 1,799 | 1,208,993 | 0.6 | 1.5 |
| Other electrical appliances | 106 | 205 | 53,906 | 2 | 3.8 |
| Smokers’ materials | 590 | 593 | 32,226 | 18.3 | 18.4 |
| Space heating appliances | 175 | 225 | 14,850 | 11.8 | 15.2 |
Notes:
- It should be noted that source of ignition was not collected in secondary fires (those that do not involve people or property and require less than four pumps in attendance). These accounted for 865,734 fires in the years ending March 2011 to 2019. Without these the other/unspecified rate of fatal and severe casualty fires would be 2.3 and 5.2 respectively.
When looking at total fatal fires, 17% (405) were recorded as being associated with alcohol and/or drugs. However, fatal fires where the source of ignition was from smokers’ materials were more often associated with alcohol or drug use (44%, 179) than any other ignition type. Meanwhile, in severe casualty fires the most likely source of ignition where the individual used alcohol or drugs was in cooking fires (29%, 282).
Table 4: Proportion of fatal and severe casualty fires where individuals were suspected to be under the influence, by source of ignition, combined data for years ending March 2011 to 2019
| Source of ignition | % of fatal fires suspected under the influence | % of severe casualty fires suspected under the influence |
|---|---|---|
| Blowlamps, welding and cutting equipment | - | 0.1% |
| Candles | 5.7% | 5.6% |
| Cigarette lighters | 6.2% | 7.8% |
| Cooking appliances | 10.4% | 28.9% |
| Electrical distribution | 2.2% | 1.3% |
| Matches | 3.2% | 3.5% |
| Other / Unspecified | 20.2% | 25.0% |
| Other electrical appliances | 1.7% | 1.3% |
| Smokers’ materials | 44.2% | 23.4% |
| Space heating appliances | 6.2% | 3.0% |
| All sources of ignition | 17.2% | 19.0% |
For three-quarters of the fatal fires where smoking materials were the source of ignition (75%, 441 of 590), the item first ignited was textiles, upholstery and furnishings, and for nearly one-third (30%, 131 of 441), upholstered furniture was the item recorded as responsible for the spread of fire, followed by bed/mattresses (23%, 100). These figures indicate that victims of these fires were likely in close proximity to the fire, particularly if they were in bed, or sitting on furnishings.
There were 123 fatal fires ignited by cigarette lighters recorded as being caused deliberately and 259 severe casualty fires.
More than half of severe casualty candle fires (53%, 108) were caused by placing articles too close to heat, and for 73% (148), the item first ignited was textiles, upholstery and furnishings. Injuries occurring from this type of fire could be associated with victims’ clothes catching on fire, therefore explaining the high rate of injury.
When considering the location of the fire, the item first ignited for both severe casualty and fatal fires in buildings was most often textiles, upholstery and furnishings (2,585, 44% of all fatal and severe casualty building fires). In outdoor and road vehicle fires that involve a fatality or casualty, the item first ignited was most often explosives, gases or chemicals (536, 35% of these fires).
4.4.2 Cause of fire
The most common cause of fatal fires was careless handling of fire or hot substances (640, 27%), whereas the most common causes of severe casualty fires where known were considered to be deliberate (1,040, 20%) or misuse of equipment or appliances (713, 14%). There were 511 (22%) fatal fires in which the cause was considered to be deliberate. Of these, 295 were specifically recorded suicide or homicide attempts. For the remaining 216, it is not always clear in the recording of these cases if the fire was intentionally set to harm people or property, or if this was an intentional use of fire that grew out of control.
Figure 12: Proportion of fatal and severe casualty fires by cause of fire, years ending March 2011 and 2019
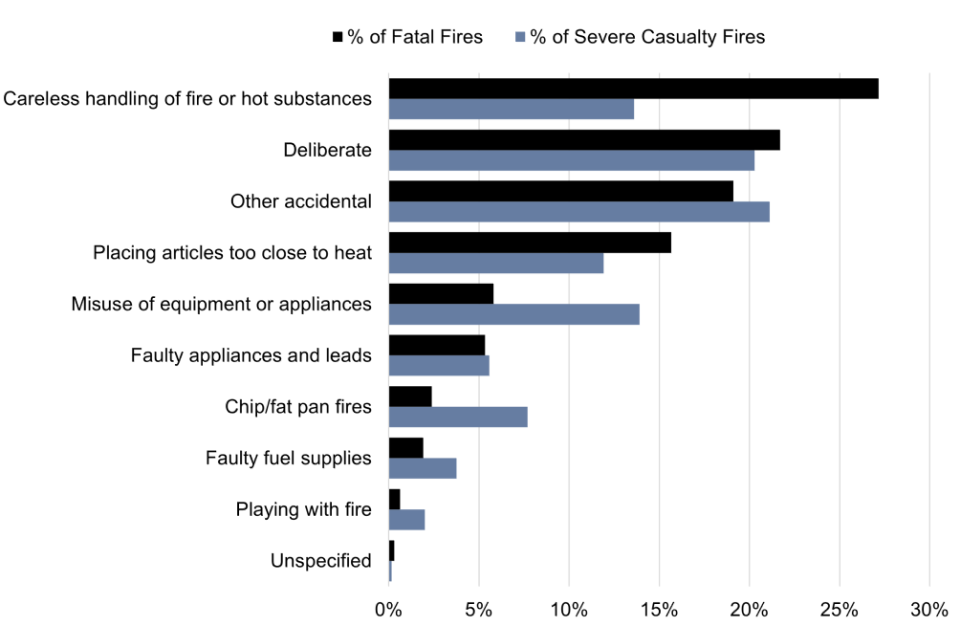
Of the fires where the cause is listed as other accidental, 99 fatal fires and 63 severe casualty fires were caused by vehicle crash or collision. For all other cases, the causes were intentional burning going out of control (such as a bonfire), accumulation of flammable materials, or the cause of fire was unclear at the time of recording.
4.4.3 Spread of fire
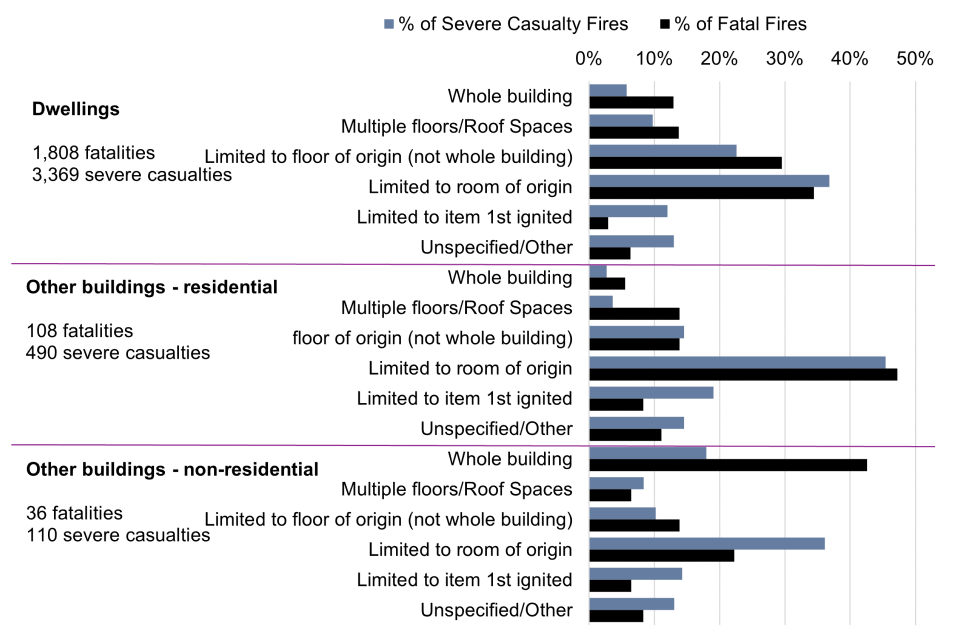
It was not the case that larger fires were responsible for more fatalities and severe casualties. In many fatal and severe casualty dwelling fires, the spread was limited to the room of origin (Figure 13). This was similar for other buildings. However, a high proportion, albeit a small number, of severe casualty fires in non-residential buildings were the result of a fire that spread throughout the whole building (43%, 88 fires) and, of these 88 fires, 35 were in smaller buildings such as private sheds or garages. Road vehicle fires typically involved the whole vehicle.
Figure 13: Proportion of fatal and severe casualty fires within each location type by extent of fire spread, combined data for years ending March 2011 to 2019
In addition to the fire spread, where the fire affected a part of the building covered by the Regulatory Reform (Fire Safety) Order 2005, firefighters could record if compartmentation had been breached. Where this was recorded, compartmentation generally stopped/checked the spread of fire.
Table 5: Compartmentation in fatal and severe casualty fires in dwellings and other buildings, combined data for years ending March 2011 to 2019
| Compartmentation | Fatal fires | Severe casualty fires |
|---|---|---|
| Breached – current building work | 7 | 9 |
| Breached – fire doors left open or incorrectly fitted | 14 | 26 |
| Breached – previous building work | 2 | 6 |
| Damage to compartmentation | 10 | 27 |
| Fire spread through gaps or voids in construction | 16 | 35 |
| No compartmentation in building | 21 | 78 |
| Other | 21 | 34 |
| Stopped/Checked spread | 148 | 485 |
| Not applicable | 2,117 | 4,428 |
4.4.4 Smoke detection
Based on the EHS for year ending March 2019, an estimated 90% of dwellings in England had a working smoke alarm. The presence of a smoke alarm does not prevent fires; however, it can alert people to the existence of a fire so they react appropriately, meaning this should reduce the number of fires that require the FRSs, and the chance of a fatality or severe casualty.
In 50% of fatal dwelling fires (895 of 1,808) and 56% of severe casualty dwelling fires (1,885 of 3,369), there was at least one working smoke alarm present. This compares with 83% of fatal fires in other residential buildings (30 of 36) and 92% of severe casualty other residential building fires (101 of 110). The difference is likely due to the regulations around other residential buildings that required a smoke detection system that was regularly tested.
It should be noted that there were fatalities and severe causalities where at least one smoke alarm was present and activated. The outcome of these fires could have been due to a number of reasons such as the person did not hear the alarm or was not able to respond. This means that further fire safety systems or interventions may need to be considered for some individuals.
Comparing the proportion of fires with or without smoke alarms with the proportion of households with or without smoke alarms, it is possible to calculate the risk of a fire based on the presence of a working smoke alarm.
Table 6: Proportion of dwellings, dwelling fires, and fatal dwelling fires by smoke alarm status, combined data for years ending March 2011 to 2019
| Smoke alarm present and working | Smoke alarm present but defective | No working smoke alarm | Smoke alarm absent | |
|---|---|---|---|---|
| Dwellings* | 88% | 12% | ||
| Dwelling fires | 62% | 8% | 30% | |
| Severe casualty dwelling fires | 56% | 15% | 29% | |
| Fatal dwelling fires | 50% | 16% | 34% |
Key:
- *Average smoke alarm data for all years from the EHS, year ending March 2019.
Households with no working smoke alarm are:
- more than 4.7 times more likely to be involved in a fire that requires FRS assistance
- more than 6.0 times more likely to be involved in a severe casualty fire
- more than 7.8 times more likely to be involved in a fatal fire
4.5 What is the profile of fatal and severe casualty victims of fire?
It is well documented that most fatal victims tend to be older, and men have a greater likelihood of dying in a fire than women (Home Office, 2019). Using relative risk analysis, this section explores whether the same holds true for severe casualties and, if compared with the general population, by how much the risk of being involved in a fatal and severe casualty fire increases. Relative risk is given alongside confidence intervals (CI). In addition, this section explores the recorded information on household type at the time of the fire, and victim ethnicity.
Key findings
- the risk of being a fatal fire victim increases with age
- the risk of being a severe casualty is more variable and those between 17 and 54 years have a higher risk than those aged between 54 and 65 years
- the risk of being involved in a fatal or severe casualty fire is higher for males than females
- the highest proportion of fatal fires were in households where a single person over pensionable age was present (660 of 2,356 fires)
- males are two times more likely than females to be a fatal fire victim in a deliberate fire at any age
4.5.1 Age
Figure 14 shows the relative risk (RR) of fatality and severe casualty by age group compared to the general population. This analysis clearly outlines the increased risk of fire-related fatality with age. Those aged 80 or older were four times more likely to die in a fire than the average for the general population. The gradual increase in risk began from ages 11 to 16 (RR = 0.1, 95% CI -0.2 to 0.5) with all those over 40 having an above average risk of dying in a fire (RR aged 40 and 54 = 1.1, 95% CI 1.0 to 1.1; RR aged 80 or over = 4.8, 95% CI 4.7 to 4.9).
Figure 14: RR of fire fatality and severe casualty by age group, combined data for years ending March 2011 to 2019
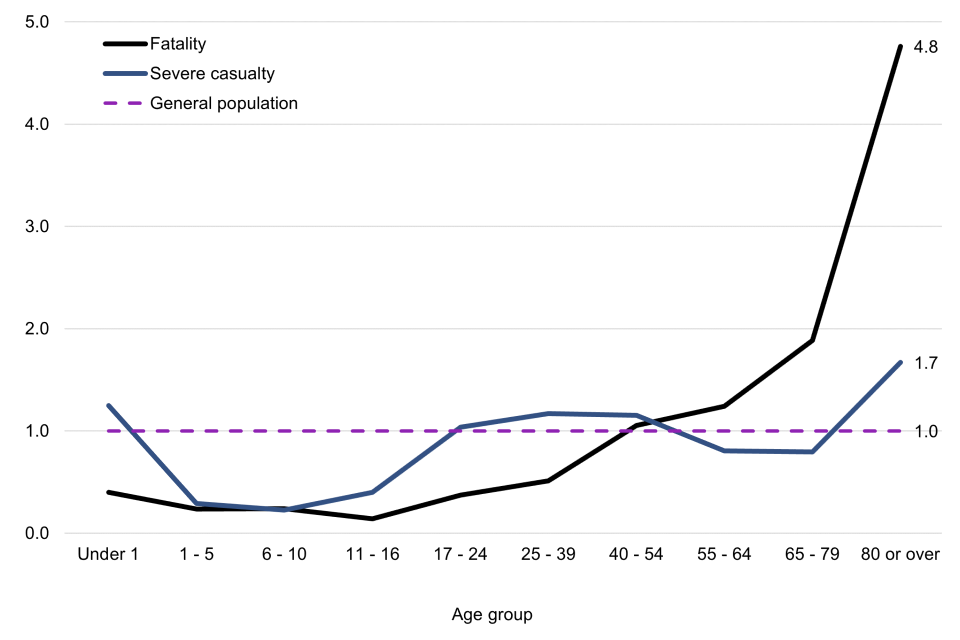
The pattern between age and risk of being a severe casualty is more variable. Those aged 25 to 54 were slightly more likely than average to be a severe casualty in a fire (RR aged 25 to 39 = 1.0, 95% CI 1.0 to 1.1; RR aged 40 to 54 = 1.2, 95% CI 1.1 to 1.2). Those aged 55 to 79 were slightly less likely than average (RR = 0.8, 95% CI 0.7 to 0.9). At age 80 or over, severe casualty risk was highest at 1.7 times the average population (RR = 1.7, 95% CI 1.6 to 1.8).
4.5.2 Gender
Overall, males were more likely to die in a fire than females (the IRS records gender as male, female or unknown). This was particularly pronounced for men aged 80 and over (RR = 5.8, 95% CI 5.7 to 5.9). From the age category 17 to 24 onwards (RR = 0.5, 95% CI 0.3 to 0.8), males were more at risk of being involved in fatal fires compared with females. Males aged 40 to 54 and older had a higher than average risk of being in a fatal fire (RR males aged 40 to 54 = 1.5, 95% CI 1.4 to 1.7) whereas females did not have a higher than average risk of being in a fatal fire until aged 65 to 79 (RR = 1.4, 95% CI 1.2 to 1.5). Both males and females had the highest risk of being in a fatal fire aged 80 or over (RR = 5.8, 95% CI 5.7 to 5.9; RR = 3.8, 95% CI 3.6 to 3.9 respectively).
Figure 15: RR of fire fatalities by gender, age group, combined data for year ending March 2011 to 2019
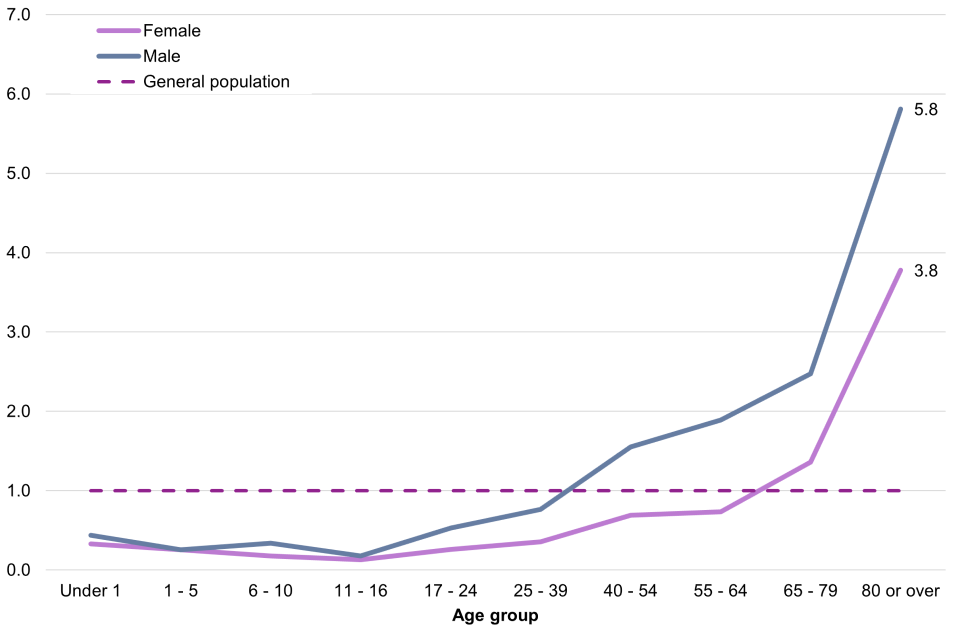
Overall, males were more likely to be a severe casualty compared with females. The risk of being a severe casualty in a fire was greater than the average population for males aged 17 to 24 and over (RR = 1.6, 95% CI 1.5 to 1.7); however, for females it was only greater than average for those aged 80 or over (RR = 1.6, 95% CI 1.5 to 1.8).
The difference between females and males was most pronounced for those aged 25 to 39, where men (RR = 2.0, 95% CI 1.9 to 2.0) were 2.8 times more likely to be a fire casualty compared with females (RR = 0.7, 95% CI 0.6 to 0.8). Both genders followed a similar pattern across age groups, however the relative risk for males nearly tripled between the ages 11 to 16 (RR = 0.5, 95% CI 0.3 to 0.7) and 17 to 24 (RR = 1.6, 95% CI 1.5 to 1.7) and remained above the average risk of the population thereafter.
Figure 16: RR of severe casualties by gender and age group, combined data for years ending March 2011 to 2019
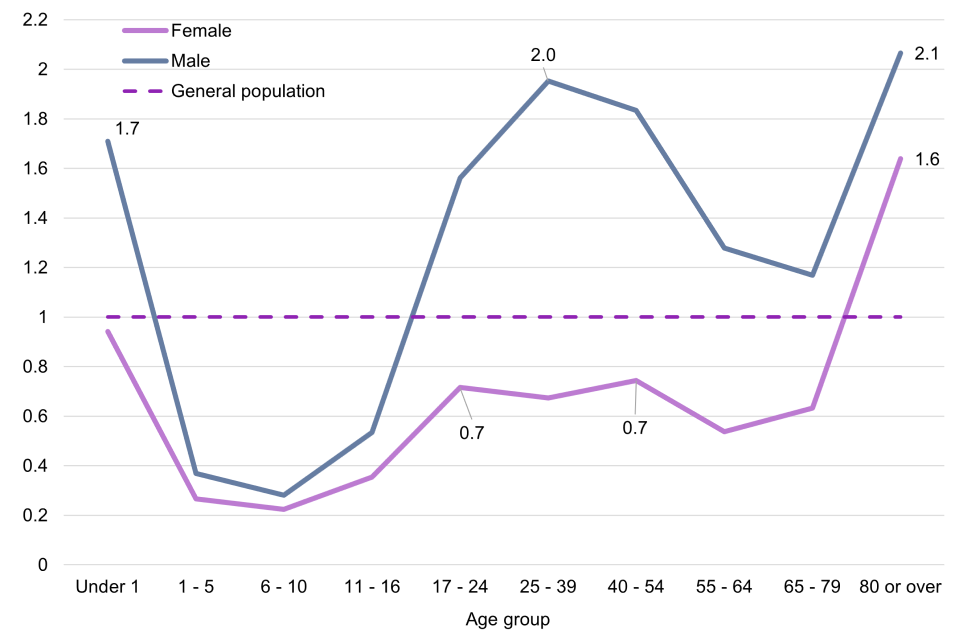
4.5.3 Deliberate fires
Most fatal and severe casualty fires were accidental, and the gender and age patterns generally followed those described for all fatalities and casualties. However, when considering just deliberate fires, the trend in risk is different across age and genders.
The motive was recorded as deliberate in more than a fifth (22%) of fatal fires. The risk of being involved in a deliberate fatal fire did not gradually increase as people age but peaked in the age group 40 to 54 years (RR = 2.2, 95% CI 2.0 to 2.3). The difference between male and female victims was more pronounced for deliberate fires compared with all fires. Overall, males were more likely than the general population to be a victim of a deliberate fire.
Figure 17: RR of being a fatality in a deliberate fire by age and gender, combined data for years ending March 2011 to 2019
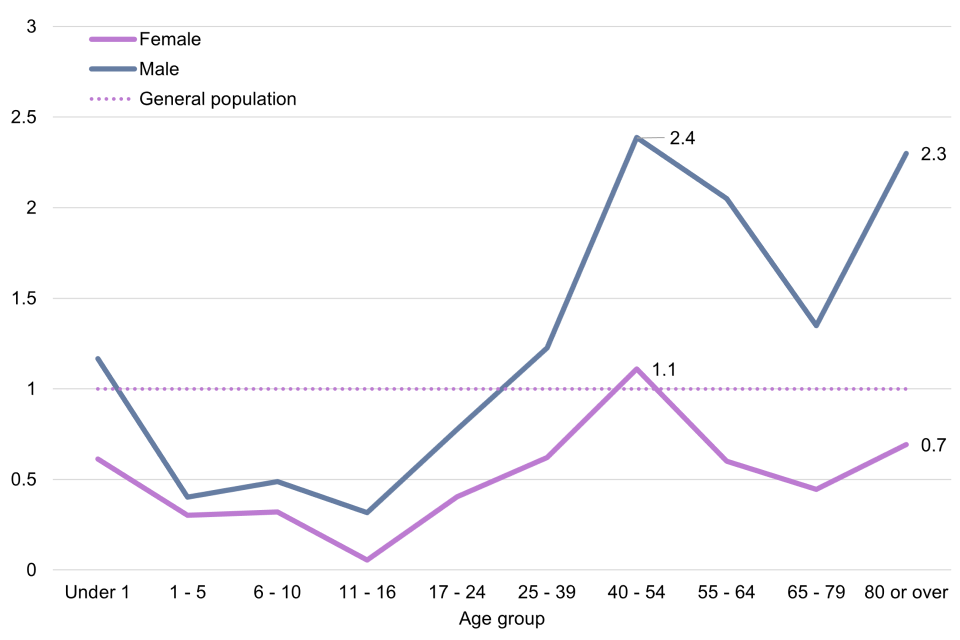
The profile of severe casualty victims of deliberate fire differed by age and gender. Older individuals were less likely to be involved in a severe casualty compared with those who were younger. Women aged 80 (RR = 0.6, 95% CI 0.2 to 1.1) was the only group where females were more likely to be a victim than males (RR = 0.4, 95% CI 0.3 to 1.1), although the difference is very small.
Figure 18: RR of being a casualty in a deliberate fire by age and gender, combined data for years ending March 2011 to 2018
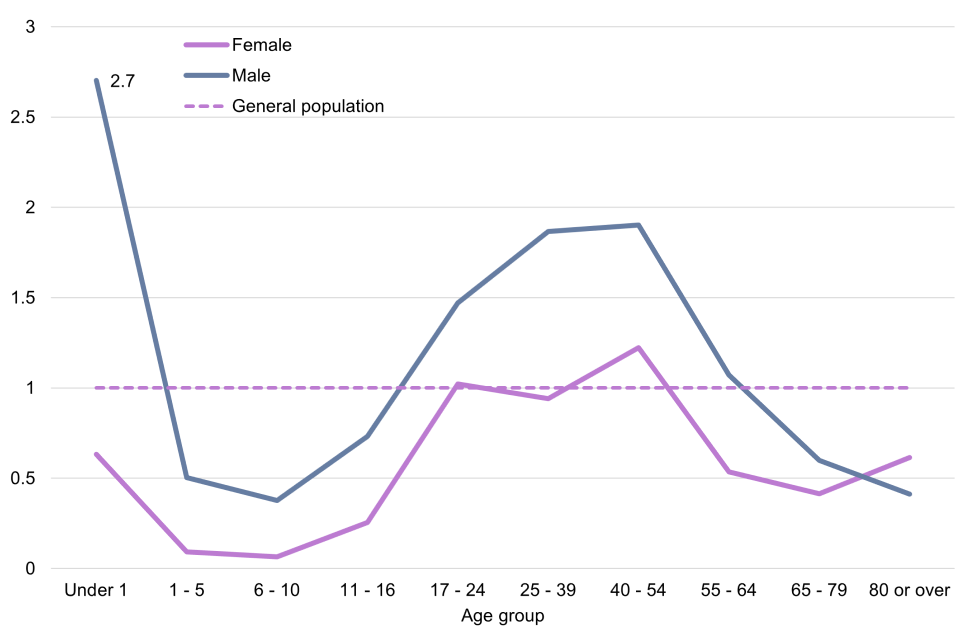
4.5.4 Household
The increased risk of fatality and severe casualty from fire with age was consistent across household types recorded in dwelling fires. The highest proportion of fatal fires (37%) were in households where a single person over pensionable age lived1. Meanwhile, in the 84 fires that involved a fatality and a severe casualty, 35% occurred in households with children. In year ending March 2019, it was estimated that 35% of households in England included at least one dependent child and 28% were individuals living alone. (Data on households are from the English Housing Survey, year ending March 2019).
Notes:
- Pensionable age is defined at the time of recording and may be different for each individual depending on when they were born. Between 2010 and 2018, state pension age for women rose in increments until it equalled that for men (65).
Figure 19: Household make up in fatal and severe casualty fires, combined data for years ending March 2011 to 2019
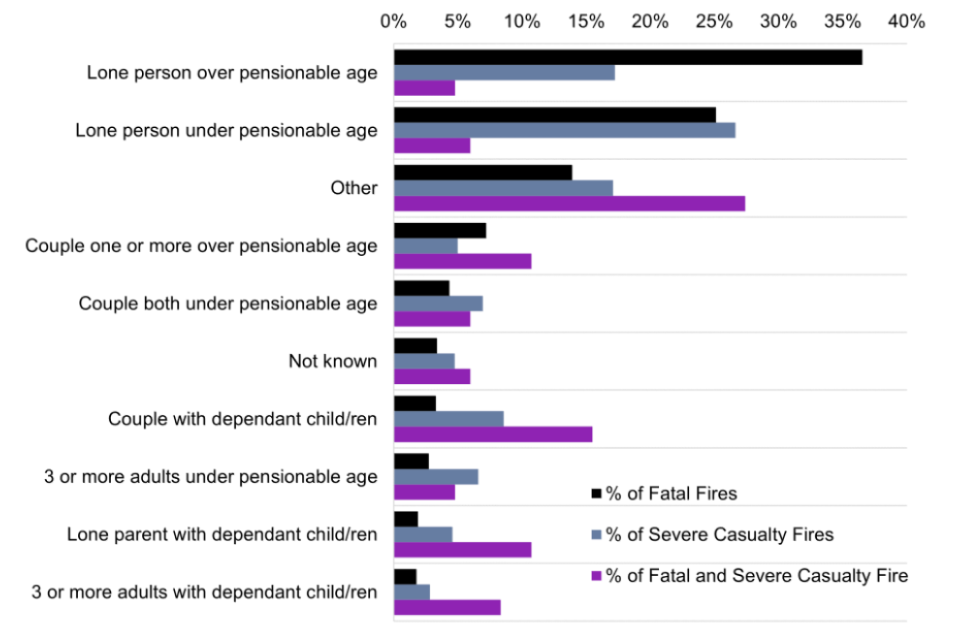
4.5.5 Ethnicity
Cultural and societal factors linked to ethnicity could impact the risk of fatality or severe casualty in fire. In some instances, it can be difficult to determine a person’s ethnicity and therefore this was not recorded in the IRS for 25% of fatalities (666 victims) and 23% of severe casualties (1,326 victims). Where ethnicity was known, the proportion of individuals in each ethnic group have been presented in Table 7 alongside population estimates for England and Wales (Office for National Statistics, 2019).
Overall, the ethnicity of fatal and severe casualty victims appears to match that of the 2016 estimated proportion in the general population. The majority of victims where ethnicity was known were White British or ‘other White’ ethnicity. Asian/Asian British people were slightly underrepresented; however, it is not clear whether this was down to recording. Given the proportion of victims where the ethnicity was unspecified, further analysis has not been conducted.
Table 7: Proportion of fatal and severe casualty victims by ethnic group, combined data for years ending March 2011 to 2019
| Ethnicity | Fatality | Severe casualty | Population estimate |
|---|---|---|---|
| White British | 81.1% | 82.0% | 79.5% |
| Other White | 6.9% | 7.2% | 6.0% |
| Mixed/Multiple ethnic groups | 0.6% | 1.1% | 1.7% |
| Asian / Asian British | 6.8% | 5.3% | 7.6% |
| Black / African / Caribbean / Black British | 3.8% | 3.6% | 3.4% |
| Other ethnic group | 0.8% | 0.9% | 1.8% |
Source:
- Population figures are from ONS population data.
4.6 Conclusion
There were many similarities between the characteristics of fatal and severe casualty fires such as the high levels of prevalence in and around residential properties, involving older people living alone and occurring more frequently in deprived areas. However, there were some key differences that demonstrated the circumstances around fatal fires were often distinct from severe casualty fires, and any relevant fire safety policy or FRS planning should account for such differences.
Fatal fires were most commonly caused by smoking materials igniting soft furnishings. There was no particular pattern for time of day, however they occurred more frequently in winter. Severe casualty fires were most commonly caused by candles or cooking, and happened throughout the year, but more often in the afternoon/evening.
While the IRS data have demonstrated the differences between fatal and severe casualty fires, and the information recorded can give some indication of activities and behaviours at the time of fire, there is still a lot that is not understood about these fires. More definitive and detailed information on the circumstances of fatal fires and the behaviour of those involved leading up to and during the fire is needed in order to fully understand the factors associated with fire fatalities.
5. Findings from FIRs for dwelling fires, year ending March 2017
IRS data on fatal fires are limited as the IRS is not designed to provide an in-depth account of the circumstances of a fire. While IRS information can give an overall indication of risk, such as a common source of ignition, the true causes of fires and particularly fatal fires can be nuanced. The behaviour of individuals leading up to and during the fire can play a vital role in the outcome and is therefore important to understand.
After a fatal fire, the FRS undertakes a thorough investigation into the potential causes of the fire and the actions of individuals involved in the fire, and produces a FIR which provides an authoritative account of what has happened. This can then be used by the coroner in determining the cause of death, or in legal proceedings where it is believed someone, or a product such as faulty wiring, is at fault. Analysis of FIRs provides a far more rich and accurate account of the incident which can therefore provide a more detailed understanding of risk. This analysis used FIRs from one year (1 April 2016 to 31 March 2017) to explore the circumstances and behaviours of individuals leading up to and during the fires.
The intention of the FIR is to set out the evidence for how the fire started and the individuals’ behaviours in the fire. To this end, the FIRs are usually bespoke to the fires they cover, and their presentation is varied. The detail these reports can give is useful for identifying patterns in the circumstances of fatal fires. However, there are not usually sufficient numbers of cases at a service level to identify these readily. It is important therefore to bring this information together at a national level and identify any themes.
This chapter covers the findings from the FIRs including the overall profile of these fires and victims, such as where and when these fires occur, how they start and the victim profiles of these fires. The findings then explore the behaviour of victims in fatal fires, including history of unsafe fire behaviours, and combines this information to identify similar circumstances and produce case studies of fatal fires. The completeness of the data recorded in FIRs is discussed in Chapter 6 and data tables can be found in Appendix E.
5.1 Profile of fatal fires in the year ending March 2017
Key findings
-
there were 185 fatal dwelling fires involving 201 victims in the year ending March 2017 for which there was an available FIR
-
the fatal fires in the year ending March 2017 largely have the same profile of fatal fires since the year ending March 2011 as they generally started in the bedroom or sitting room, occurred in houses, and the most common source of ignition was smoking materials
-
most victims were male (115 of 201, 57%) and or over the age of 65 (98, 49%)
This section explores the overall profile of fatal fires in the year ending March 2017 from the FIRs in comparison with the profile identified via the IRS data. For the purposes of this research, FIRs analysed were limited to fatal fires that occurred in the year ending March 2017 (the latest year complete reports were available at the start of the research). As the profile of fatal dwelling fire victims do not vary substantively from year to year (as evidenced by IRS analysis using combined data for the years ending March 2011 to 2019), it is not expected that using one year of reports limits the usefulness of the findings. Key similarities and differences in the profile are presented in Table 8. It shows that the profile of fire fatalities was relatively consistent between the two data sources analysed. The data for this section are available at Appendix E.
In the year ending March 2017, 267 fatal fires were recorded in the IRS as of September 2018. Reports for 185 fatal fires were collected and analysed relating to 201 victims. As in all years, most victims in the year ending March 2017 were male (115 or 57%), and many were older (49% of all victims were aged over 65). The only difference between the FIRs and the overall IRS profile was that there were no victims under the age of 6, or between 17 and 24 years old. From IRS data it is known that fatalities in these age groups are generally rare.
Fatal dwelling fires in the year ending March 2017 generally occurred in houses and started in the bedroom or sitting room. Of these 126 fatal fires, information was collected in 74 cases on whether the room had been modified for the victim’s immobility, such as a sitting room made into a bedsit, or a hospital bed being used in a bedroom. An individual may have limited ability to escape from a fire in a modified room. The room had been modified in 9 of the fires, not stated in 24, and the room had not been modified in 41 cases. The fact that this variable was not collected throughout the reports means there may have been more instances where this was the case.
Most fatal dwelling fires in year ending March 2017 occurred in houses (97 fires, 52%). Where FIRs listed the tenure of the dwelling (105 fires); the majority were owned (52 fires, 50%), and there were almost equal numbers of private rented (25 fires, 24%) and social rented (28 fires, 27%). This compares to the estimated 64% owner occupied, 19% private rented and 17% social rented of the housing stock in England. (Data on households are from English Housing Survey, year ending March 2019).
Table 8: Comparison of most prevalent factors associated with fatal fires in the year ending March 2017 with other years (full data available in Appendix D and Appendix E)
| Circumstance | FIR data in year ending March 2017 | Combined IRS data for year ending March 2017 |
|---|---|---|
| (185 fires, 201 victims) | (2,356 fires, 2,637 victims) | |
| WHERE THE FIRE OCCURRED | ||
| Property type | House (97 fires, 52%) |
House (943 fires, 52%) |
| Purpose-built flat (44 fires, 22%) |
Purpose-built flat (376 fires, 21%) |
|
| Bungalow (20 fires,11%) |
Bungalow (212 fires or 12%) |
|
| Fire start location | Living room (71 fires, 38%) |
Living room (685 fires, 38%) |
| Bedroom (55 fires, 30%) |
Bedroom/bedsitting room (563 fires, 31%) |
|
| Kitchen (29 fires, 16%) |
Kitchen (281 fires, 16%) |
|
| Household | Single adult (107 fires, 58%) |
Single adult (1,114 fires, 62%) |
| Couple without children (19 fires, 10%) |
Couple without children (208 fires, 12%) |
|
| WHEN THE FIRE OCCURED | ||
| Season | Summer (27 fires, 15%) |
Summer (326 fires, 18%) |
| Winter (63 fires, 34 %) |
Winter (581 fires, 32%) |
|
| WHAT TYPES OF FIRES | ||
| Motive | Accidental (152 fires, 82%) |
Accidental (1,827 fires, 78%) |
| Source of ignition | Smokers’ materials (60 fires, 32%) |
Smokers’ materials (551 fires, 30%) |
| Item first ignited | Furniture/furnishings (31 fires, 17%) |
Textiles, upholstery and furnishings (990 fires, 55%) |
| Clothing (27 fires, 15%) |
||
| Bedding (22 fires, 12%) |
||
| VICTIMS OF FATAL FIRES | ||
| Gender | Male (115 victims, 57%) |
Male (1,225 victims, 56%) |
| Female (84 victims, 42%) |
Female (906 victims, 41%) |
|
| Not stated (2 victims, 1%) |
Unspecified (63 victims, 3%) |
|
| Age | 65+ years (98 victims, 49%) |
65+ years (991 victims, 45%) |
| 40 to 54 years (38 victims, 19%) |
40 to 54 years (412 victims, 19%) |
5.2 Fire discovery and escape
Key findings
-
victim activity was generally unknown (46 of 201 victims) but where it was known, victims were often asleep at the time of fire (37 victims)
-
a significant minority of the fatal fires had a smoke alarm present (44% of 185 fires), and one that operated and raised the alarm, but the outcome of the fire was fatal in a number of cases because the victim could not escape (13 victims)
-
a substantial number of victims discovered the fire themselves (88 victims) and the first responder was a neighbour. The first action was often to raise the alarm by calling 999
-
many victims (83) were found in the room where the fire started. This was largely due to not being able to escape due to impairment or being on fire themselves (30 victims)
Fire investigations involve attempting to understand how the fire started, what the victim did once the fire had started, and the actions of witnesses. The outcome of a fire is influenced by when it is discovered and, when needed, the timeliness of notifying the FRS. Activity at the time of fire and actions upon discovery of the fire of the victim(s) and witness(es) are therefore very important factors, and the effect of these actions is explored in this section.
5.2.1 Victim activity at time of fire
In general, it is difficult to establish what exactly the victim was doing at the time of a fatal fire, so it is often listed as ‘unknown’ (46 victims, 23%) or left ‘not stated’ (36 victims, 18%). The most commonly known activity at the time of fire was sleeping (37 victims, 18%), followed by leisure activity (22 victims, 11%). It appears that few victims were known to be active at the time of fire which likely had an impact on their ability to discover or respond to the fire. Seven victims were known to be unconscious and under the influence of either drugs or alcohol.
Figure 20: Number of fatal fire victims by activity at time of fire, year ending March 2017 (n=201)
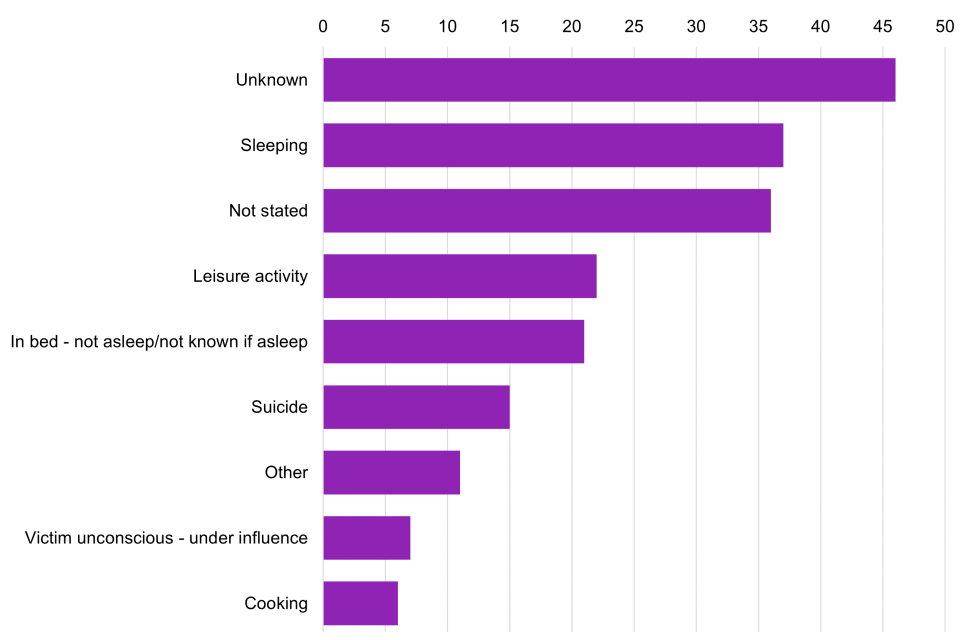
5.2.2 Smoke detection
In 44% (81 fires) of the fatal fires in the year ending March 2017, there was reported to be at least one smoke alarm present, 16% (30 fires) had 2 smoke alarms and 2% (4 fires) had at least 3. As found with the IRS records, it was not always the case that smoke alarm ownership led to a better outcome of fire and this section explores the reasons for this.
Where there was at least one smoke alarm, the nearest one to the fire was most often on the same floor (57, 31%), in the same room (15, 8%) or different floor to the origin of fire (11, 6%). Otherwise, the location was unknown or not stated.
Where smoke alarm status was recorded (114 fires), a substantial minority (44, 39%) operated and raised the alarm. This is the same proportion as the number of dwelling fires where a smoke alarm was present, operated and raised the alarm in the years ending March 2011 to 2019. In a further 13 fatal dwelling fires (11%) in the year ending March 2017, the building had a smoke alarm present that operated but an alarm was not raised, and in 37 (32%) incidents a smoke alarm was present, but it was not clear if it operated. In a small number of fatal fires, alarms were present but had no battery (11, 10%) or were not working (9, 8%).
Figure 21: Number of times reasons were recorded for smoke alarm not working as intended in fatal fires, year ending March 2017 (n = 50)
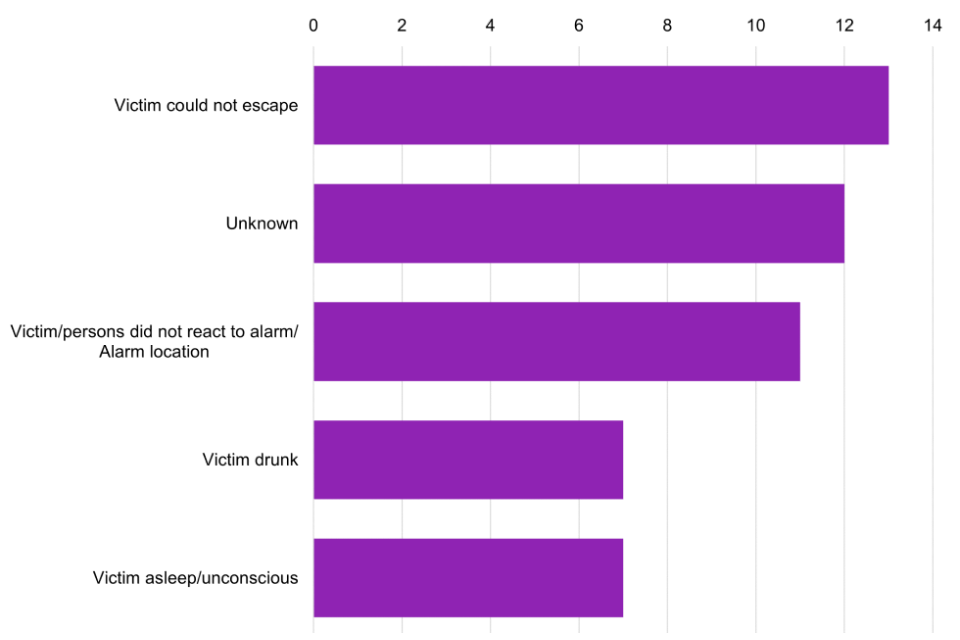
In most recorded cases where the smoke alarm operated but did not work as intended in that a fatality occurred, it was due to the victim’s inability to escape (13 victims). There was also a similar number of cases (12 victims) where it was not known why the smoke alarm did not work as intended.
5.2.3 Fire discovery
For many victims, it was not known (28 victims) or not stated (37 victims) who discovered the fire. A substantial number of victims discovered the fire themselves (88 victims). Other persons to discover the fire include neighbours (15), occupants (15), passers-by (5), emergencies services/other agencies (5) and visitors (5). Considering the outcome of these fires, if the victims discovered the fire, the first action in response to the fire is therefore very important to the outcome.
Raising the alarm is an important action on discovery of a fire, especially notifying the FRSs, however it was not always the first response. Figure 22 shows who were often first responders to the fire other than the victim.
Figure 22: First responder other than the victim in fatal fires, year ending March 2017 (n=201)
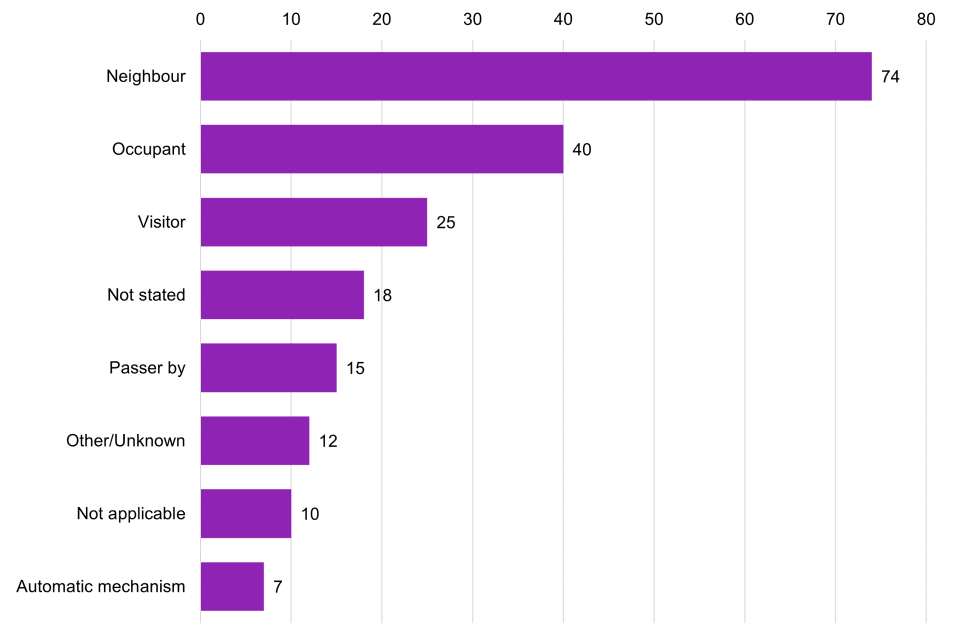
The first responder other than the victim was often a neighbour (74), other occupant (40) or visitor (25). Other responders included passers-by (15) or an automatic mechanism (7). It was unknown (12) or not stated (18) in few cases. The first responder’s initial actions included raising the alarm by calling 999 (67), attempting to alert the victim (11) or raising the alarm in another way (13). Some investigated the fire (36), attempted rescue (15) or attempted to tackle the fire (11). Those who were also involved in the fire in some way attempted escape (11) and in a small number of cases no action was taken (6).
5.2.4 Escape behaviour
Many victims (83) were found in the room where the fire started. This was largely due to impairment (19), being on fire themselves (11) or the victim committed suicide or arson (10). In some cases, the fire/smoke had spread too rapidly (8), the victim was unaware of the fire (5) or their escape route was blocked by the fire (2).
A large number (102), however, were found outside the room of origin and in many of these cases the victim died in an ambulance or at the hospital (41). In some cases, the fire/smoke had spread to a room other than the room of origin (21), or the victim was unable to escape because they were overcome by heat/smoke (9) or the fire blocked their escape (6).
The initial response of the victim was generally unknown (44) or not stated (50). Where the initial response of the victim was recorded, a large number took no action (61) either due to being asleep or unconscious (25), committing suicide (15) or being immobile/impaired (9), while in some instances no reason was given (12). Some attempted to shout or alert outside help (12); some tried to escape (21); and a few attempted to tackle the fire, to put out the fire on their clothing or enter/re-enter the premises (9).
In cases where the escape behaviour was stated or known, and action was taken (40), many attempted immediate escape (15). However, others delayed escape because they were asleep (12) or looking for others or belongings (3). A few re-entered the building or room of origin or attempted to tackle the fire (9).
5.3 Impact of impairments on the outcome of the fire
Key findings
-
the majority of victims had some level of overall impairment (123 of 201 victims)
-
physical impairments were the most prevalent (76 victims); however, there were several victims where this was combined with mental (16 victims) or substance (7 victims) related impairments (10 victims had all three combined)
-
the most frequently recorded impairments were alcohol (56 victims), prescribed drugs (42 victims) and age-related physical impairments (45 victims)
-
the victims’ responses were thought likely to be affected by impairment in the majority of cases (101 victims)
The presence of impairments can have a major effect on both the starting of a fire and the outcome. Impairments are categorised under three major areas: physical – such as mobility-related impairments; mental – such as dementia or hoarding; and substance use – such as the use of prescribed or illicit drugs. The presence of an impairment, either individually or combined with other impairments, can affect a person’s ability to enact fire-safe behaviours and to respond once a fire has started. It is not always clear if an impairment is present and, therefore, the fire investigator may need to rely on testimony from witnesses, support workers and/or family. This section explores the prevalence of impairments where it was determined to contribute to the outcome of the fire.
Most victims (123) had some level of overall impairment that may have impacted their response to the fire. It was not stated (53) or unknown (4) in a large number of cases and some (21) had no impairment at all. Many of the individuals had a physical impairment (43) or combined physical and mental (16) or physical with substance-related impairments (7). Mental and substance-related (15) and mental impairment (10) were also common along with a further 15 who had a substance-related impairment. These included the use of prescribed or illicit drugs, mobility, eyesight or hearing difficulties, oxygen dependency and mental illnesses (see Figure 23).
The most frequently recorded impairments were alcohol (56), presence of prescribed drugs (42) and age-related physical impairments (45). These were also more likely to contribute to the victim’s response than other impairments.
Figure 23: Recorded presence and contribution of impairments for fatal fire victims. year ending March 2017 (n=123)
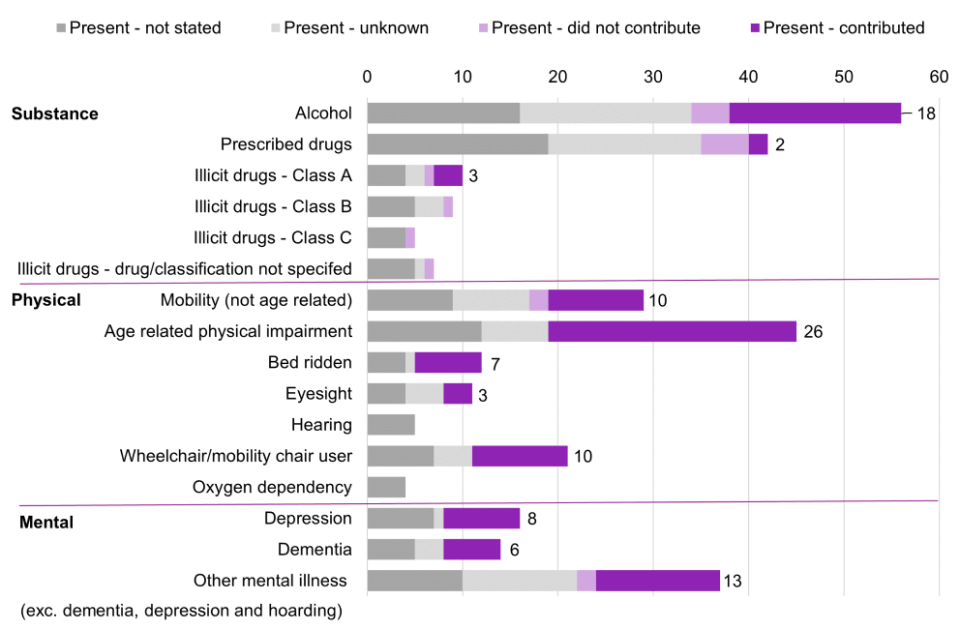
In addition to prescribed medication, people may use emollient creams to help manage dry, itchy or scaly skin conditions such as eczema, psoriasis and ichthyosis. These creams are highly flammable and after use can soak into clothing making the items more susceptible to ignition, when combined with candles or smoking. Information was collected on the prevalence of emollient creams at fatal fires, however there were only 4 cases where it was explicitly noted that emollient creams were present and contributed to the fire.
For 71 individuals, the impairment was found to have contributed to starting the fire or the outcome. There were 8 cases where the victim had an impairment, but it was not thought to contribute. For 101 victims, their response was thought likely to have been affected by impairment and, of these, a high number (44 victims) took no action in the initial response to fire; where the reason was known, this was due to either being asleep, immobile/impaired, committing suicide or being unconscious.
5.4 History of unsafe fire behaviours
Key findings
-
a large proportion of fires (145 of 185) were caused by human behaviour
-
the most common unsafe behaviour was smoking which was attributed to 110 victims, along with discarding cigarettes inappropriately (56 victims), and careless or risky use of materials that may cause fire (79 victims)
-
there was some prevalence of hoarding and poor housekeeping among fatal fire victims which may have contributed to the outcome of the fire (present for 46 victims)
-
over a quarter of victims were in a care environment and some had previous contact with FRSs
The risk of a fatal fire could potentially be realised and mitigated against by spotting unsafe or misguided fire behaviours. This is the responsibility of the individuals themselves, but also those providing care or support to the individuals and include a range of activities such as discarding cigarettes inappropriately, placing items of clothing or furniture too close to heat sources, or misuse of electrical appliances. The prevalence of these behaviours in fatal fire households are explored in this section along with individuals’ history of contact with FRSs or other agencies.
In 78% of fatal fires (145), the fire was caused by human behaviour and there was evidence of unsafe fire behaviours for 96% of victims (192). There were 0 cases in which disregard for children handling items was related to the fire and 3 that involved the neglect of children or others. The most common unsafe behaviour that can contribute to a fire was smoking, which was attributed to 110 victims. The second most common unsafe behaviour was careless or risky use of materials that may cause fire (79 victims), followed by cigarettes discarded unsafely or burns on the furniture (56 victims), which can link to the leading cause of fatal fires (31%) being smoking materials. In the majority of fatal fires, it was clear that unsafe fire behaviours occurred.
There was also evidence of hoarding or poor housekeeping for 46 victims (23%). This can contribute both to the starting of a fire when combined with other behaviours such as misuse of electrical appliances, as well as hoarding flammable or combustible items which can cause the fire to spread more rapidly and make it difficult to escape.
Figure 24: Evidence of unsafe or misguided fire behaviours, year ending March 2017 (n=192)
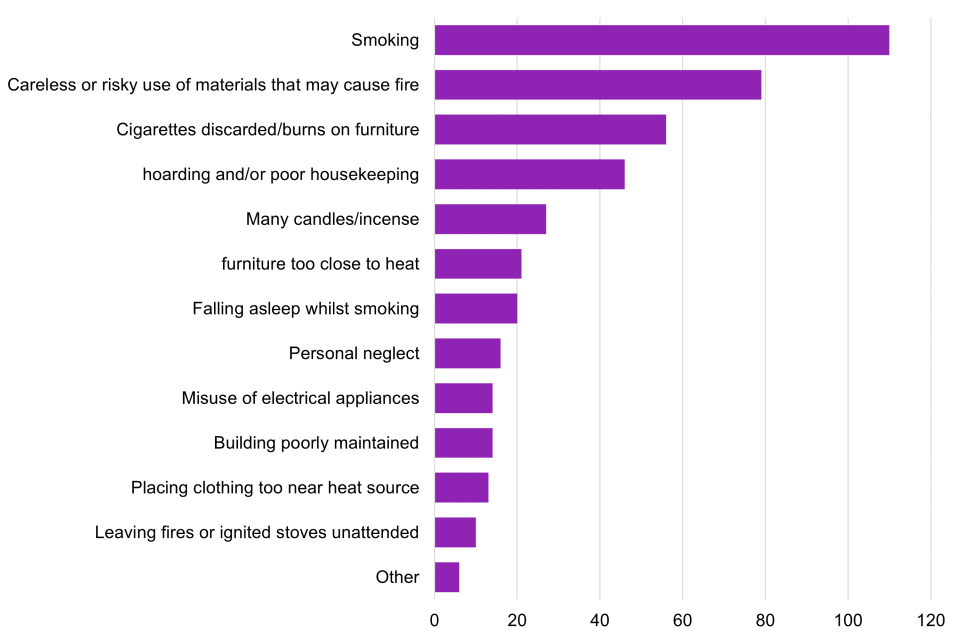
5.4.1 Prior history with FRSs and other agencies
In addition to wider fires safety education initiatives, FRSs and other agencies, such as within the social care sector, undertake a number of activities to ensure the wellbeing of vulnerable people. The scale of these activities varies between services and can be specific to fire safety, or a range of wellbeing activities including avoiding trips and falls.
Thirty-two individuals had specific contact with FRSs prior to the fire, including 26 who had a Home Fire Safety Check (HFSC) and 6 whose alarms were fitted by the FRS. There were also 15 cases where the FRS had come to the building for another resident. There was no information on previous fires that required FRS intervention for any of the victims. The remaining 154 victims had either had no contact with FRSs (66) or it was not stated (84) / unknown (4). It is worth noting that over half (86) were found to have an impairment indicating some level of vulnerability. Sixty-seven were aged 65 and over, 34 were already in a care environment and 27 had contact with other agencies.
Thirty-six victims overall had contact with agencies other than the FRS, and over a quarter were also already in a care environment (28%, 56 victims). In most cases, this contact had either been with social services or carers (26), or mental health/addiction agencies (20). This shows that it is likely that often the victims came from a vulnerable group requiring extra assistance, and that is mirrored in the high number of victims that had an impairment.
5.5 Suicide, arson and accidental self-immolation
It can be difficult to determine if an individual has deliberately set a fire and if, in that deliberate act, they intended to commit arson or suicide. It is important to understand these incidents though, as they represent a different level of prevention intervention needed – specifically, joint working between a number of agencies focussing on wellbeing, mental health and fire safety.
In the fatal fires during the year ending March 2017 where the motive was recorded as deliberate (27, 15%), there were 16 instances where the cause of fire was suicide and, independently, 2 fatal fires in the same year were recorded as arson (the cause of the other 9 deliberate fires were unknown or not stated). In the 16 instances where the cause was suicide, 11 used an accelerant. The majority of these individuals were single males aged between 40 and 54. Nine were in contact with agencies other than the FRSs, such as mental health and addiction agencies, and 3 were in a care environment. Of the 2 that committed arson, the cause of death was smoke inhalation.
It was recorded in 21 fires that the victim accidentally set themselves on fire; 9 of these were ignited due to smoking materials, however these were not linked to arson or suicide. This is an important distinction when considering the factors that cause fires. Whether the victim accidentally set themselves on fire was not collected throughout the analysis and, therefore, there may have been more incidents like this.
5.6 Common fatal fire scenarios
While descriptive statistics can provide a good overview of the prevalence of certain characteristics and behaviours, it is useful to understand how often multiple factors are present at the same incident. Each fatal fire, and victim, is unique and with relatively low numbers this makes analysis of the combined factors difficult. A useful way to analyse combined factors is to use cluster analysis, which groups each of the fires into clusters that have the least difference between them. Not all victims within these fires will be the same but certain characteristics of the victim, or the fire, will follow a common pattern that makes them similar to other fires in the cluster. These groupings can help identify key areas to focus fire safety activity.
The analysis identified seven key clusters; the key factors in the clusters are shown in and the characteristics of which have been summarised as case studies. It is important to note that clusters do not always have an overall factor that brings them together, therefore case studies are a representation of the most prevalent factors within each cluster, but not necessarily the majority of cases. Further details on the results of the cluster analysis can be found at Appendix A.
Figure 25: Key factors in cluster analysis of fatal fires, year ending March 2017
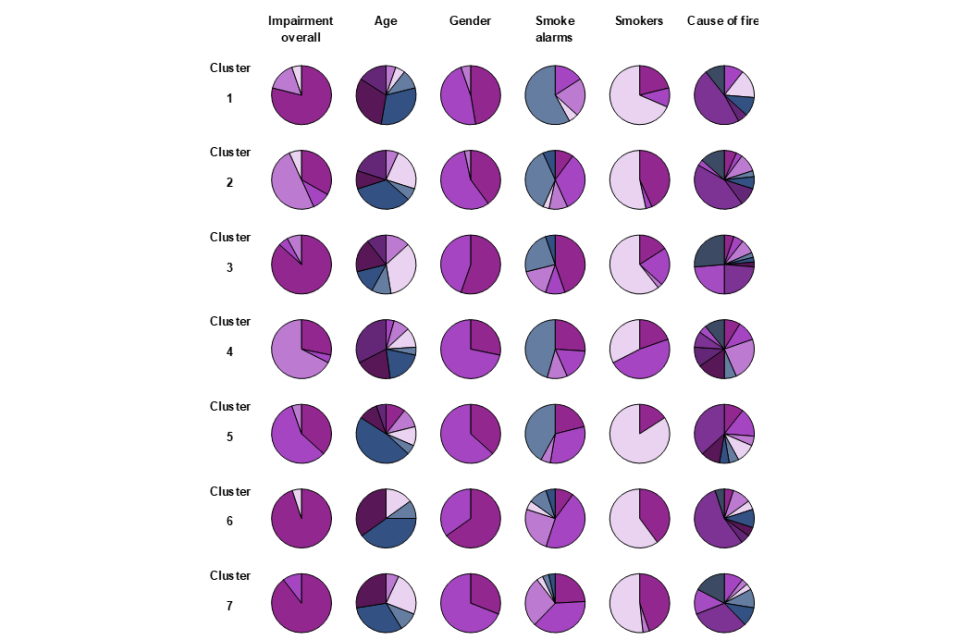
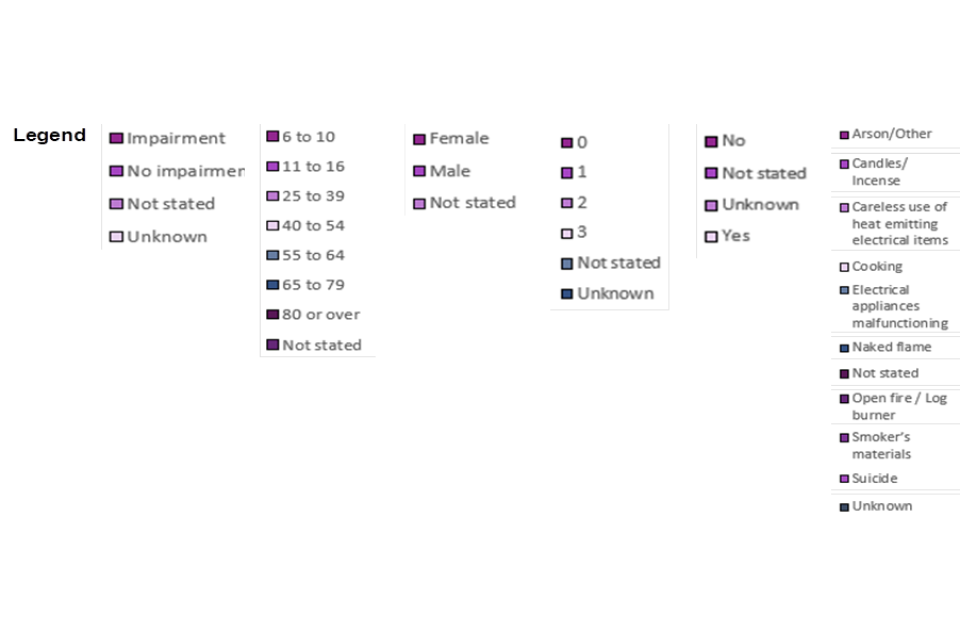
Vulnerable with working smoke alarm (Cluster 1)
A vulnerable older person living alone in social housing was either asleep, undertaking a leisure activity or cooking. They had an impairment including combined mental and physical impairments, and in some cases substance abuse, and their impairment contributed to the fire and its outcome. They had a history of poor fire safety and were often known to local services. The fire started either with kitchen or food items, set alight by cooking appliances, or furnishings or bedding, set alight by smokers’ materials, a naked flame, or candles or incense. The smoke alarm operated and, while it is unclear how the victim responded to the fire, they generally died outside of the room of origin.
Under the influence of alcohol and smoking (Cluster 2)
An older or middle-aged person was drinking and smoking. They had a history of poorly extinguishing their cigarettes with evidence of burns in bedding and furniture. They fell asleep in either their chair or the bedroom, and smoking materials set fire to furnishings or discarded paper. The smoke alarm operated but their reaction was delayed. By this time the fire had already spread and although an escape was attempted, the exit was blocked and so the victim was overcome by smoke.
Individual with mental impairment (Cluster 3)
A single adult, who was either in a care environment or in contact with mental health or social services, was either asleep or attempting suicide. The individual had a mental impairment and potentially a history of substance abuse, and used an accelerant in an attempt to commit suicide. In some cases, where accelerants were not used, the bedding had caught alight with a discarded cigarette and the victim attempted to escape. The victim’s inability to respond to the fire appropriately was considered a key factor in the fatal nature of the fire.
Misused heating devices and poor housekeeping (Cluster 4)
A man who did not have an impairment, but had a history of poor fire safety behaviours, had an electric heater on or a log fire burning. He was either sleeping, or his activity was not known, when the log fire or heater set fire to paper, rubbish or furnishings. Whether he had a working smoke alarm is unknown, however he discovered the fire and may have attempted to tackle it. He was alive when the FRS arrive, but died later in the ambulance or hospital from smoke inhalation. In some cases, he was not the only victim.
Single male falls asleep while smoking (Cluster 5)
A single man living alone, who smoked, was relaxing or sleeping in the sitting room during the week on the ground floor. He had a history of misguided fire safety behaviours such as placing clothes too close to heat, self-neglect, misuse of electrical items, covering lampshades with material, or burning many incense and candles. He was not known to the FRS but had contact with mental health / addiction services or social services. Soft furnishing, such as his clothes or the chair he is in, caught fire, but he was asleep. The status of the smoke alarm was unknown. The victim was alerted to the fire, but the extent of his injuries was such that he died in the ambulance or hospital.
Single female falls asleep while smoking (Cluster 6)
A woman aged over 65, who lived alone and in a care environment, was smoking in bed. She had a history of falling asleep while smoking and was known to the FRS. She fell asleep and accidentally set fire to her clothing and surrounding furnishings with the cigarette. There was a smoke alarm, often in the room of origin, and she was alerted to the fire. However, she was unable to escape due to being physically impaired and died from smoke inhalation or burns.
Male with impairments in mixed circumstances (Cluster 7)
It is unclear what grouped fires and victims in this cluster. Fires often took place in the bedroom, and sometimes the kitchen or sitting room. The victim was an older or middle-aged male, who was physically and/or mentally impaired, and in some cases a substance user. However, his impairment was not thought to have contributed to the fire starting, or his response to the fire. He was relaxing or sleeping when his clothing, bedding or surrounding furniture or furnishings were set alight by smoking materials, candles or incense, an electrical item or a naked flame. In some cases, he had started the fire purposefully in a suicide attempt. He either responded to the fire by immediately attempting escape, was unable to escape due to being asleep, immobile or did not attempt escape due to intention of suicide.
6. Coverage of Fire Investigation Reports
As part of ongoing work into potentially standardising the format of the FIR, the research explored the coverage and variability of those reports that were received for analysis. This section describes the coverage of FIRs in reference to the variables coded as part of the research and the variation between different FIRs. Recommendations for key information to include in reports are then made.
The intention of FIRs is to set out the evidence for how the fire started, and the individuals’ behaviours in the fire, to assist the coroner in establishing the cause of fatality or the police in determining any criminality. There is also an opportunity to identify information that is not known to the firefighters at the time of completing the IRS such as accurate information on victim age and gender, and specific causes of fire and fatality, and to identify potential new factors that are affecting the outcome of fires. The reports therefore need to be able to adapt to the fires that they cover, while also consistently including key pieces of information that should be included in all reports.
Of just over 20,500 variables covered in this FIR analysis (201 cases with 102 questions), around 30% were recorded as ‘not stated’. For a very limited number of fields, it was possible to make some assumptions; for example, if the fire involved someone who lived alone it was unlikely there was overcrowding. In most cases this was not possible, which limited the data available for analysis and therefore the ability to fully understand trends and risks and identify target groups for fire safety.
The least recorded field in the FIRs was ethnicity, with 82% of fatalities (165 victims) not stated. This is despite the fact that the IRS data had much higher levels of ethnicity coverage. In the IRS, 25% of fatalities (666 victims) and 23% of severe casualties (1,326 victims) had ethnicity listed as ‘unspecified’. Ethnicity can be a key indicator of cultural and societal factors that could potentially affect the likelihood and outcome of fires, and therefore should be recorded where possible. Additionally, given difficulties in establishing ethnicity at the scene, the accuracy to which it is recorded is likely to be higher after investigation and therefore should be specified in the FIR.
An individual’s ability to enact fire-safe behaviours or to respond to a fire is also an important factor in the outcome. This information was not collected in the IRS and was mentioned in some FIRs but not necessarily in specific terms. Whether there was an overall impairment was recorded for 74% of victims (148); however, specific impairments were not stated in more than half of the FIRs (Table 9). The type of fire safety measures needed can vary substantially depending on the type of impairment, therefore it is vital that where an impairment is identified it is classified appropriately.
Table 9: Recording of impairment in FIRs, year ending March 2017
| Impairment | Recorded | Not stated |
|---|---|---|
| SUBSTANCE | ||
| Alcohol | 48% | 52% |
| Prescribed drugs | 33% | 67% |
| Illicit drugs – Class A | 37% | 63% |
| Illicit drugs – Class B | 36% | 64% |
| Illicit drugs – Class C | 36% | 64% |
| Illicit drugs – not specified in report which drug/classification | 36% | 64% |
| PHYSICAL | ||
| Mobility (not age-related) | 39% | 61% |
| Age-related physical impairment | 47% | 53% |
| Bed ridden | 63% | 37% |
| Eyesight | 27% | 73% |
| Hearing | 26% | 74% |
| Wheelchair / Mobility chair user | 43% | 57% |
| Oxygen dependency | 40% | 60% |
| MENTAL | ||
| Depression | 28% | 72% |
| Dementia | 30% | 70% |
| Other mental illness (excluding dementia, depression and hoarding) | 36% | 64% |
In addition, smoke alarm presence was not stated in 31% of FIRs. As this is a key safety measure, it is important that this information is included.
For effective fire safety initiatives going forward, it is also important to understand what, if anything, could have prevented these fires. The recording of information on an individual’s or household’s history of fire behaviours (Table 10), and which agencies or FRSs they may have been in contact with, is therefore necessary. Contact with agencies was not stated in 44% of FIRs and, of the behaviours assessed as part of this research, the majority were poorly recorded. However, smoking and smoking-related behaviours were generally well recorded.
Table 10: Recording of household behaviours in FIRs, year ending March 2017
| Inappropriate/misguided household behaviours | Recorded | Not stated |
|---|---|---|
| Disregard for children handling items that could cause fire | 60% | 40% |
| Covering lampshades with materials | 29% | 71% |
| Sitting too close to heat source | 32% | 68% |
| Overheating chip pan (while attended) | 35% | 65% |
| Neglect of children or others | 46% | 54% |
| Leaving fires or ignited stoves unattended | 33% | 67% |
| Placing clothing too near heat source | 36% | 64% |
| Building poorly maintained | 37% | 63% |
| Misuse of electrical appliances | 41% | 59% |
| Personal neglect | 40% | 60% |
| Falling asleep while smoking | 48% | 52% |
| Furniture too close to heat | 31% | 69% |
| Many candles/incense | 50% | 50% |
| Hoarding and/or poor housekeeping | 52% | 48% |
| Cigarettes discarded / burns on furniture | 65% | 35% |
| Careless or risky use of materials that may cause fire | 55% | 45% |
| Smoking | 84% | 16% |
The length of the reports did not always indicate the complexity of the fire or quality of information available. The reports received as part of this research were between 1 and 101 pages long, some including pictures, witness statements and IRS records. Several FRSs included summary cover sheets in their FIRs, however not all summary pages covered the same characteristics, for example presence of illicit substances or impairments. For the sake of expediency in understanding key information such as the cause of fire, victims involved, and any new trends in fire-related fatalities, it is recommended that all FIRs include a summary sheet. Recommendations for this can be found in ‘FIR Summary’.
FIR summary
- date and time of incident
- property type and tenure
- age, sex, gender, and ethnicity
- cause of death or injury for all occupants
- presence of specific mental and physical impairments, and substances, and whether these contributed to the fire or outcome
- brief description of the incident
- household history of contact with FRSs
- household contact with other agencies and specifically if in a care environment
- presence of known products or items of interest (i.e. emollient creams)
There should also be a mechanism for sharing this information between FRSs. Particularly for those that experience few fatal fires per year, it would mean identifying common and new trends earlier, especially in relation to products or items that contribute to the fire or outcome. Similarly, if it was possible to identify these in severe casualty instances, more could be done to understand if some fires had the potential to become a fatality or if a fatality could have been avoided.
Overall, the FIRs provided a rich and detailed account of the fatal fires in the year ending March 2017. With further work to improve the consistency of reporting, the FIRs could become a more useful tool in identifying new trends, in addition to their current purpose.
7. Discussion
There has been a long-term downward trend in fires, fire-related fatalities and severe casualties over time. In the context of an increasing population, the overall risk of being involved in a fire involving a severe casualty or fatality has decreased. However, in the context of the number of fires decreasing, the risk of a fire resulting in a fatality has increased.
The circumstances of fatal and severe casualty fires, for example where the fire occurred, are largely similar. This points to the victim profile and activity providing more of an indicator of whether a fire results in a severe casualty or fatality risk than the specific causes and evidence of unsafe fire behaviours.
Fatal and severe casualty fires are highly prevalent in dwellings, are largely accidental, and there are evident risks associated with smoking material. The geographic location of fatalities and severe casualties do not differ extensively with both being highly correlated with deprivation. Key differences between fatal and severe casualty fires include:
- a higher rate of severe casualty fires starting with cooking
- fatalities being more likely to occur in winter
- severe casualties occurring more outdoors in summer
- more severe casualty incidents happen during the evening than any other time
The overall profile of fatal victims of fire in England is consistent with previous years (Smith & Wright, 2006) and international findings (Fire Service Academy, 2018), meaning fire safety interventions should already be targeting those more at risk. Similar to previous research, males and older individuals were at greater risk of fatal fire than the general population (Xiong, et al., 2015; Jonsson, et al., 2017; Coates, et al., 2019). This profile is generally similar for severe casualties, although to a lesser extent for individuals over 80, given the RR of being a severe casualty in a fire is 1.6 times that of the general population compared to 4 times for fatalities.
The FIRs provided a more detailed and authoritative account of the circumstance and activities which led to the fire and more information about the victims. Analysis of the FIRs identified seven clusters of individuals with shared characteristics or circumstances, and the prevalence of impairments was evident. The connection between these and ability to escape were also apparent. This shows the importance of working with other agencies in order to identify those that are at risk.
In addition, the known history of many individuals undertaking unsafe fire behaviours means that potentially more could be done to identify these individual and intervene earlier. Forty-seven victims had previous contact with FRSs, including 26 individuals who previously had a HFSC, and of the 154 where there was no contact or it was unknown, over half had some level of impairment. It is clear some people are being identified as being at risk, however further work is needed to understand if anything additional could have been done to prevent these fires or identify others at risk.
A key fire safety precaution is to have multiple working smoke alarms. The high number of individuals, however, who were unable to respond appropriately to smoke alarms shows that this should not be the only fire safety measure taken. Many of the individuals were smokers, which can lead to a fire easily when smoking materials are handled inappropriately, evident from the number of fires ignited by smoking materials. This is particularly important for those who cannot move away from the fire to safety.
The data collected throughout the IRS and FIRs provides valuable information on the factors associated with fatal and severe casualty fires, however there are inconsistencies in the recording of information. Improved recording of information would further contribute to understanding these incidents. In particular, data on victim ethnicity, the presence of impairments, and household profile where current recording is particularly poor.
While it is necessary to focus on those factors where there is the highest prevalence of fatality or severe casualty, it is also important to note the rarity of fatal and severe casualty fires and some circumstances that lead to them. There are some instances in which children playing with fire has led to fatalities and severe casualties, and also cases where emollient creams contributed to the outcome of the fire. These cases show that while it is right to focus effort on the more prevalent factors associated with these fires, it is important to ensure that every effort is made to identify and communicate emerging trends and causes, and to understand the local community. This can be done through the consistent collection and use of data in FIRs.
8. Bibliography
Ahrens, M. & Evarts, B., 2017. U.S. Fire Death Rates, s.l.: National Fire Protection Association.
Bryant, S. & Preston, I., 2017. Focus on trends in fires and fire-related fatalities, Online: gov.uk.
Clark, A., Smith, J. & Conroy, C., 2015. Domestic fire risk: a narrative review of social science literature and implications for further research. Journal of Risk Research, 18(9), pp. 1113-1129.
Coates, L. et al., 2019. Preventable residential fire fatalities in Australia July 2003 to June 2017, Online: Bushfire and Natural Hazards CRC.
Doyle, A., Lyons, S. & Lynn, E., 2019. Profile of fire fatalities in Ireland using coronial data. Fire Safety Journal, Volume 110.
Fire Service Academy, 2018. Fatal residential fires in Europe. A preliminary assessment of risk profiles in nine European countries., Arnhem: Institute for Safety.
Giebułtowicz, J. et al., 2017. Analysis of fire deaths in Poland and influence of smoke toxicity. Forensic Science International, Issue 277, pp. 77-87.
Government Social Research Unit, 2011. GSR Professional Guidance - Ethical Assurance for Social Research in Government, Online: gov.uk.
Harpur, A., 2014. A Detailed Investigation into Occupant Behaviours and Influencing Factors Surrounding Fatal Dwelling Fire Incidents in Northern Ireland, s.l.: University of Ulster.
Home Office, 2019. Detailed analysis of fires attended by fire and rescue services, England, April 2018 to March 2019, Online: gov.uk.
Jonsson, A., Bergqvist, A. & Andersson, R., 2015. Assessing the number of fire fatalities in a defined population. Journal of Safety Research, Volume 55, pp. 99-103.
Jonsson, A., Bonander, C., Nilson, F. & Huss, F., 2017. The state of the residential fire fatality problem in Sweden: Epidemiology, risk factors, and event typologies. Journal of Safety Research, Issue 62, pp. 89-100.
Kobes, M. & van den Dikkenberg, R., 2016. An analysis of residential building fire rescues: the difference between fatal and nonfatal casualties., Netherlands: Institute for Safety, Fire Safety Academy (IFV).
Office for National Statistics, 2019. Research report on population estimates by ethnic group and religion, Online: ONS population data
Ordnance Survey, 2018. AddressBase. Available here
Peck, M. & Pressman, M. A., 2013. The correlation between burn mortality rates from fire and flame and ecomonic status of countries. Burns, Volume 39, pp. 1054-1059.
Sadeghian, F. et al., 2019. The trend of burn mortality in Iran — A study of fire, heat and hot substance-related fatal injuries from 1990 to 2015. Burns, Volume 45, pp. 228-240.
Smith, R. & Wright, M., 2006. Human Behaviour in Fatal Residential Fires: Final Report for the Department of Communities and Local Government, s.l.: Greenstreet Berman.
Turner, S. L., Johnson, D. R., Weightman, A. L. & Rodgers, S. E., 2017. Risk factors associated with unintentional house fire incidents, injuries and deaths in high-income countries a systematic review. Injury Prevention, Volume 23, pp. 131-137.
Wells, G. et al., 2011. The Newcastle-Ottawa Scale (NOS) for assessing the quality of nonrandomised studies in meta-analyses, Ottawa: Ottawa Hospital Research Institute.
Winberg, D., 2016. International Fire Death Rate Trends, Borås: SP Technical Research Institute of Sweden.
Xiong, L., Bruck, D. & Ball, M., 2015. Comparative investigation of ‘survival’ and fatality factors in accidental residential fires. Fire Safety Journal, Volume 73, pp. 35-47.
Appendix A. Phase on data sources
A.1 Incident Recording System (IRS)
Since the switch from paper forms (known as FDR1) to the electronic IRS in the year ending March 2010, non-fatal victims of fire are categorised by injury severity. The analysis in this report excludes this transition year as some FRSs could not fully supply their data. The categories are, in order of increasing severity:
- precautionary check recommended (precautionary checks)
- first aid given at scene (first aid)
- victim went to hospital as an out-patient (hospital slight)
- victim went to hospital and stayed overnight as an in-patient (hospital severe)
The analysis in this report focuses on the two most severe casualty types: fatalities and hospital severe, the latter referred to as ‘severe casualties’. Data used for the analysis of trends matches Fire and Rescue Incident Statistics published on 14 November 2019.
A.2 Population by fire and rescue service area
Population data are provided at FRS level and published on GOV.UK in Table FIRE1401. This is available per financial year.
A.3 Index of Multiple Deprivation (IMD)
The IMD is the official measure of relative deprivation for small areas (Lower-layer Super Output Areas LSOAs) in England. The IMD combines 39 measures of deprivation across seven ‘domains’ (income, employment, education, health and disability, crime, barriers to housing and services, and living environment) each measured. ‘Scores’ for each of the 32,844 neighbourhoods in England are ranked, then divided into 10 equal groups ‘deciles’ (i.e. each containing 3,284 or 3,285 neighbourhoods). These deciles range from the most deprived 10 per cent of neighbourhoods nationally to the least deprived 10 per cent of neighbourhoods nationally. IMD decile 1 includes the most deprived 10% of LOSAs, while IMD 10 includes the least deprived 10% of LOSAs.
There have been three publications of the English Indices of Deprivation (including the IMD) 2010, 2015 and 2019 (see Appendix A.3 for a summary of IMD calculation). For this report, all fires in the years ending March 2011 to 2015 were analysed using the 2010 IMD and for all fires in years ending March 2016 to 2019, the 2015 IMD were used to more accurately record the relative deprivation in the area at the time of the fire.
A.4 English Housing Survey
Data from the EHS for 2018 to 2019 on smoke alarm ownership was used to calculate the risk of fatal or severe casualty fires in houses with or without a smoke alarm. The survey is a continuous national survey commissioned by Ministry of Housing and Local Government.
Appendix B. Phase two data sources
In April 2018, a letter was sent via the National Fire Chiefs Council to all FRSs requesting FIRs for the year ending 31 March 2017 and single points of contact. Received reports were coded or services were attended to code reports in person. Coding and quality assurance were completed in October 2019. Quality assurance included checking the logic of answers given and, where necessary, re-reading the FIR. An example of checking the logic would be if a person was listed as living alone, the field for overcrowding was not selected.
B.1 Information collected from FIRs
| 1 | Descriptive information |
|---|---|
| 1.1 | FRS |
| 1.2 | Date |
| 1.3 | Day (auto filled – do not delete text from cells) |
| 1.4 | Month |
| 1.5 | Year |
| 1.6 | Quarter |
| 1.7 | Day of the week |
| 1.8 | Location of fire |
| 1.9 | Room of fire (if dwelling) |
| 1.10 | Cause of death |
| 1.11 | Motive |
| 1.12 | Cause of fire (accidental) |
| 1.13 | Cause of fire (deliberate) |
| 1.14 | Cause of fire (unknown / not stated motive) |
| 1.15 | Time of day |
| 1.16 | Number of non-fatal casualties in fire |
| 1.17 | Number of fatalities in fire |
| 2 | The premises |
|---|---|
| 2.1 | Type of premises (dwelling) |
| 2.2 | Tenure (dwelling) |
| 2.3 | Household type (dwelling) |
| 3 | The circumstances of the fire |
|---|---|
| 3.1 | Did victim accidentally set themselves on fire? |
| 3.2 | Had room of origin been modified for victim’s immobility, e.g. turned into a bedsit? |
| 3.3 | Did person die in room of origin? |
| 3.4 | If person died in room of origin – why? |
| 3.5 | Person died in room other than room of origin – why? |
| 3.6 | Floor of origin |
| 3.7 | Item first ignited |
| 3.8 | Victim’s activity at the time of fire |
| 4 | Smoke detection |
|---|---|
| 4.1 | Smoke alarm status |
| 4.2 | How many smoke alarms in property? |
| 4.3 | Smoke alarm locations (closest to the fire) |
| 4.4 | Victim asleep |
| 4.5 | Victim drunk |
| 4.6 | Victim impaired (by other means than drunk) |
| 4.7 | Victim unconscious |
| 4.8 | Victim already deceased |
| 4.9 | Smoke alarm location |
| 4.10 | Victim deaf |
| 4.11 | Unknown |
| 5 | Fire discovery |
|---|---|
| 5.1 | Initial response to fire |
| 5.2 | Escape behaviour |
| 5.3 | Fire discovered by |
| 5.4 | Response to discovery of fire – 1st person (other than victim) - Who? |
| 5.5 | Response to discovery of fire – 1st person (other than victim) - Action 1 |
| 5.6 | Response to discovery of fire – 1st person (other than victim) - Action 2 |
| 5.7 | Response to fire – 2nd person - Who? |
| 5.8 | Response to fire – 2nd person - Action 1 |
| 5.9 | Response to fire – 2nd person - Action 2 |
| 5.10 | Response to fire – 3rd person - Who? |
| 5.11 | Response to fire – 3rd person - Action 1 |
| 5.12 | Response to fire – 3rd person - Action 2 |
| 6 | Victim information |
|---|---|
| 6.1 | Victim’s age |
| 6.2 | Victim’s gender |
| 6.3 | Relationship of occupant to victim |
| 6.4 | Is ethnicity clearly stated? |
| 6.5 | Ethnicity where clearly stated |
| 6.6 | Ethnicity where inferred |
| 6.7 | Status on arrival |
| 7 | Victim impairment |
|---|---|
| 7.1 | Impairment overall |
| 7.2 | Specific impairment - Mental impairment |
| 7.3 | Specific impairment - Physical impairment |
| 7.4 | Specific impairment - Substance use |
| 8 | Contributing factors | |
| 8.1 | Did the building construction contribute or inhibit the fire? | |
| 8.2 | Is it likely the victim’s impairment contributed to starting / the outcome of fire? | |
| 8.3 | Fire was due to human behaviour? | |
| 8.4 | Was victim’s response likely to be affected by impairment? | |
| 8.5 | Which impairment(s) are likely to have been present/contributed? | Alcohol |
| 8.6 | Prescribed drugs | |
| 8.7 | Illicit drugs – Class A | |
| 8.8 | Illicit drugs – Class B | |
| 8.9 | Illicit drugs – Class C | |
| 8.10 | Illicit drugs – not specified in report which drug/classification | |
| 8.11 | Mobility (not age-related) | |
| 8.12 | Age-related physical impairment | |
| 8.13 | Bed ridden | |
| 8.14 | Eyesight | |
| 8.15 | Hearing | |
| 8.16 | Wheelchair / mobility chair user | |
| 8.17 | Oxygen dependency | |
| 8.18 | Depression | |
| 8.19 | Dementia | |
| 8.20 | Other mental illness (excluding dementia, depression & hoarding) | |
| 8.21 | Did the building impact on the victim’s outcome? | |
| 8.22 | Was there evidence of overcrowding and did it contribute to the fire or victim’s outcome? | |
| 8.23 | Was there evidence of use of emollient creams and did it contribute to the fire or victim’s outcome? | |
| 8.24 | Indicator of household behaviours towards fires | Smoking |
| 8.25 | Cigarettes discarded / burns on furniture | |
| 8.26 | Many candles/incense | |
| 8.27 | Poor housing keeping | |
| 8.28 | Hoarding | |
| 8.29 | Disregard for children handling items that could cause fire | |
| 8.30 | Furniture too close to heat source | |
| 8.31 | Covering lampshades with materials | |
| 8.32 | Building poorly maintained | |
| 8.33 | Inappropriate behaviour | Careless or risky use of materials that may cause fire |
| 8.34 | Falling asleep while smoking | |
| 8.35 | Leaving fires or ignited stoves unattended | |
| 8.36 | Personal neglect | |
| 8.37 | Neglect of children or others | |
| 8.38 | Misguided behaviour | Misuse of electrical appliances |
| 8.39 | Placing clothing too near heat source | |
| 8.40 | Sitting too close to heat source | |
| 8.41 | Leaving furniture too close to fire/heaters | |
| 8.42 | Overheating chip pan (while attended) |
| 9.1 | Prior history of victim with other agencies |
| 9.2 | Which other agencies? |
| 9.3 | Prior history with Community Fire Safety |
| 9.4 | Fire rescue contact |
| 10.1 | Number of pages |
Appendix C. K-Modes analysis
C.1 Selecting K-modes analysis
Cluster analysis is an umbrella term for analysis techniques which group, or ‘cluster’, data points within a data set based on similarities. This type of analysis was chosen to identify common scenarios within the FIR data to summarise as victim ‘case studies’ to target fire safety initiatives.
K-modes analysis was identified as a clustering technique used for categorical data, therefore suitable for analysing the FIR data. It worked by randomly selecting a set number of data points (fire fatality victims) as ‘seeds’ against which to match the other data. Each seed resulted in a cluster.
Non-seed data was assigned and re-assigned to clusters by the analysis, until each cluster contained a set of similar victims. The analysis measured similarity by counting how many differences existed between victims. For example, when comparing two victims on gender, if one victim was male and one was female, this would add a count of one to the overall difference score for that cluster.
C.2 Running K-modes analysis
As the number of clusters is a choice, to select the ‘best’ number of clusters to divide data into, the analysis was conducted multiple times to find the most suitable seeds.
The more clusters there are, the less likely there will be differences between members of the clusters. If there were 201 clusters for 201 cases, there would be no differences as each cluster would have one member. The analysis used 1 to 30 clusters and it compared the total number of differences to find where an additional cluster would make little difference. The results are in Figure 26.
It was decided that between 4 to 7 clusters would be the ‘best’ number – any fewer and the average differences would be too large, and any additional clusters would not reduce the differences within the clusters sufficiently to justify further splitting the data.
Figure 26: Number of clusters and within difference scores
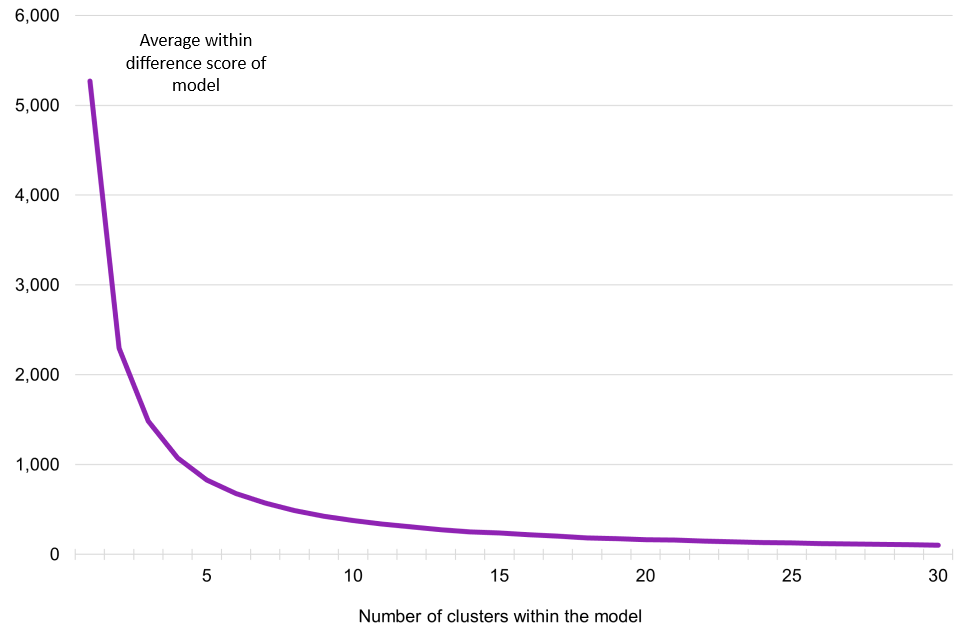
C.3 Choosing models for each number of clusters
The seeds are chosen at random each time a model is run so running the analysis a second time can result in different clusters. The analysis was conducted 201 times using four to seven clusters, to find the ‘start seeds’ that created clusters with the least number of differences within them.
C.4 Selecting the final clusters
Descriptive information on the variables for each cluster were analysed to identify grouping variables. This was, for example, where it was evident a cluster was different to another cluster because of the prevalence of impairment.
Cluster summaries were compared for four to seven clusters to understand where an additional cluster was separating the data. It was identified that seven clusters would separate the cases sufficiently to add value as case studies.
Summaries were then used to create case studies as described in Section 5.6.
Appendix D. Fatalities and severe casualties, years ending March 2011 to 2018
Data were extracted from the IRS to match Fire and Rescue Incident Statistics published on 14 November 2019.
Table 11: Number of fatalities and severe casualties, and fatal and severe casualty fires, years ending March 2011 to 2019
| Year ending 31 March | Fatalities | Fatal fires | Severe casualties | Severe casualty fires |
|---|---|---|---|---|
| 2011 | 335 | 308 | 743 | 642 |
| 2012 | 315 | 287 | 773 | 681 |
| 2013 | 286 | 268 | 662 | 586 |
| 2014 | 278 | 252 | 626 | 563 |
| 2015 | 264 | 250 | 584 | 528 |
| 2016 | 302 | 267 | 593 | 538 |
| 2017 | 265 | 246 | 574 | 517 |
| 2018 | 341 | 249 | 694 | 548 |
| 2019 | 251 | 229 | 568 | 525 |
| Total | 2,637 | 2,356 | 5,817 | 5,128 |
D.1 Local variation
Table 12: Number of fatal and severe casualty fires by FRS population, combined data for years ending March 2011 to 2019
| FRS | Fatal fires | Severe casualty fires |
|---|---|---|
| Avon | 43 | 78 |
| Bedfordshire | 22 | 48 |
| Buckinghamshire | 34 | 54 |
| Cambridgeshire | 35 | 67 |
| Cheshire | 42 | 75 |
| Cleveland | 23 | 38 |
| Cornwall | 25 | 33 |
| Cumbria | 32 | 28 |
| Derbyshire | 47 | 89 |
| Devon & Somerset | 86 | 165 |
| Dorset & Wiltshire | 62 | 102 |
| Durham | 25 | 75 |
| East Sussex | 35 | 73 |
| Essex | 59 | 165 |
| Gloucestershire | 32 | 42 |
| Greater London | 357 | 631 |
| Greater Manchester | 137 | 428 |
| Hampshire | 56 | 121 |
| Hereford & Worcester | 32 | 89 |
| Hertfordshire | 39 | 72 |
| Humberside | 44 | 94 |
| Isle of Wight | 6 | 6 |
| Isles of Scilly | 0 | 1 |
| Kent | 59 | 179 |
| Lancashire | 68 | 215 |
| Leicestershire | 51 | 70 |
| Lincolnshire | 38 | 67 |
| Merseyside | 69 | 178 |
| Norfolk | 51 | 87 |
| North Yorkshire | 33 | 63 |
| Northamptonshire | 28 | 71 |
| Northumberland | 14 | 40 |
| Nottinghamshire | 49 | 93 |
| Oxfordshire | 32 | 56 |
| Royal Berkshire | 28 | 79 |
| Shropshire | 22 | 35 |
| South Yorkshire | 58 | 133 |
| Staffordshire | 55 | 160 |
| Suffolk | 34 | 81 |
| Surrey | 44 | 80 |
| Tyne & Wear | 30 | 115 |
| Warwickshire | 25 | 45 |
| West Midlands | 155 | 423 |
| West Sussex | 36 | 50 |
| West Yorkshire | 104 | 234 |
| Average | 52.36 | 113.96 |
D.2 Deprivation
Table 13: Percentage of fatal and severe casualty fires by deprivation decile, combined data for years ending March 2011 to 2019
| IMD | % of all severe casualty fires (YE March 2011 to 2015) | % of all fatal fires (YE March 2011 to 2015) | % of all severe casualty fires (YE March 2016 to 2019) | % of all fatal fires (YE March 2016 to 2019) |
|---|---|---|---|---|
| 1 (most deprived 10%) | 19% | 15% | 20% | 16% |
| 2 | 13% | 14% | 14% | 14% |
| 3 | 13% | 10% | 12% | 11% |
| 4 | 11% | 10% | 11% | 11% |
| 5 | 10% | 10% | 10% | 10% |
| 6 | 9% | 11% | 9% | 9% |
| 7 | 7% | 9% | 8% | 8% |
| 8 | 7% | 9% | 7% | 8% |
| 9 | 6% | 7% | 6% | 6% |
| 10 (least deprived 10%) | 4% | 6% | 4% | 6% |
D.3 Fires location
Table 14: Number of fatal and severe casualty fires by indoor or outdoor location, combined data for years ending March 2011 to 2019
| Location | Dwellings | Other buildings | Other outdoors** | Road vehicles | Total |
|---|---|---|---|---|---|
| Fatal fires | 1,808 | 144 | 157 | 247 | 2,357 |
| Severe casualty fires | 3,369 | 600 | 586 | 573 | 5,129 |
| Fires* | 290,688 | 152,180 | 917,258 | 199,786 | 1,559,912 |
Key:
-
*From Table FIRE0502 on GOV.UK.
-
**Other outdoor fires include fires defined as secondary fires in the published data
Table 15: Fatal and severe casualty fires by dwelling type, combined data for years ending March 2011 to 2019
| Dwelling type | Fatal fires | Severe casualty fires |
|---|---|---|
| House – single occupancy | 943 | 1,713 |
| Bungalow - single occupancy | 212 | 243 |
| Converted flat/maisonette – single occupancy | 97 | 223 |
| Purpose-built low rise (1 to 3) flats/maisonettes | 256 | 671 |
| Purpose-built medium rise (4 to 9) flats | 79 | 148 |
| Purpose-built high-rise (10 or more) flats | 41 | 75 |
| Dwelling – multiple occupancy | 44 | 120 |
| Other dwelling | 136 | 176 |
| Total | 1,808 | 3,369 |
Table 16: Fatal and severe casualty fires in dwellings by room in origin, combined data for years ending March 2011 to 2019
| Room | Fatal fires | Casualty fires |
|---|---|---|
| Living room | 685 | 808 |
| Bedroom / Bedsit | 563 | 744 |
| Kitchen | 281 | 1,195 |
| Other | 138 | 305 |
| Corridor/Hall/Stairs | 51 | 189 |
| Unknown | 37 | 32 |
| Bathroom/Toilet | 36 | 63 |
| Dining room | 17 | 33 |
| Total | 1,808 | 3,369 |
Table 17: Fatal and severe casualty fires by other building type, combined data for years ending March 2011 to 2019
| Other building type | Fatal fires | Severe casualty fires |
|---|---|---|
| NON-RESIDENTIAL | ||
| Education | 0 | 11 |
| Animal boarding/breeding/kennels (not farm) | 0 | 1 |
| Religious | 1 | 3 |
| Entertainment, culture and sport | 2 | 4 |
| Food and drink | 3 | 54 |
| Other buildings / Use not known | 3 | 16 |
| Permanent agricultural | 4 | 16 |
| Hospitals and medical care | 6 | 34 |
| Offices and call centres | 6 | 11 |
| Retail | 7 | 40 |
| Other public buildings | 8 | 79 |
| Industrial premises | 19 | 123 |
| Private non-residential buildings | 49 | 98 |
| RESIDENTIAL | ||
| Nurse/Doctor accommodation | 0 | 2 |
| Other holiday residence (cottage, flat, chalet) | 0 | 3 |
| Student hall of residence | 0 | 4 |
| Boarding house / B&B other | 0 | 2 |
| Caravan site – in caravan/camper van | 1 | 4 |
| Sheltered housing – not self-contained | 1 | 13 |
| Hostel (e.g. for homeless people) | 3 | 14 |
| Other residential home | 4 | 14 |
| Hotel/Motel | 4 | 8 |
| Residential home | 23 | 46 |
| Total | 144 | 600 |
Table 18: Fatal and casualty fires in other buildings by room, combined fata for years ending March 2011 to 2019
| Room | Fatal fires | Severe casualty fires |
|---|---|---|
| NON-RESIDENTIAL | ||
| Meeting room | 1 | 2 |
| Canteen/Restaurant | 1 | 3 |
| Shop floor / Showroom / Display hall | 2 | 25 |
| Kitchen | 2 | 31 |
| Bathroom/Toilet | 2 | 8 |
| Reception area | 2 | 2 |
| Barn | 3 | 14 |
| Parking garage | 3 | 3 |
| Corridor/Hall/Stairs | 4 | 10 |
| Process/Production room | 5 | 49 |
| Office | 7 | 4 |
| Store room | 7 | 13 |
| Unknown | 8 | 24 |
| Other | 61 | 302 |
| RESIDENTIAL | ||
| Common room / Staff room / Day room | 0 | 2 |
| Cell | 0 | 2 |
| Sauna | 0 | 1 |
| Kitchen | 0 | 26 |
| Corridor/Hall/Stairs | 1 | 5 |
| Dining room | 1 | 1 |
| Bathroom/Toilet | 1 | 3 |
| Unknown | 1 | 1 |
| Other | 10 | 14 |
| Bedroom/Bedsit | 22 | 55 |
| Total | 144 | 600 |
Table 19: Fatal and severe casualty fires in vehicles, combined data for years ending March 2011 to 2019
| Vehicle type | Fatal fires | Severe casualty fires |
|---|---|---|
| Agricultural | 1 | 3 |
| Car | 200 | 353 |
| Caravan / Motor home | 7 | 19 |
| Lorry/HGV/Tanker | 9 | 28 |
| Minibus | 1 | 2 |
| Motorcycle | 1 | 49 |
| Multiple vehicles | 13 | 64 |
| Other | 1 | 20 |
| Van | 14 | 35 |
| Total | 247 | 573 |
Table 20: Fatal and severe casualty fires in vehicles by fire start location, combined data for years ending March 2011 to 2019
| Fire start location | Fatal fires | Severe casualty fires |
|---|---|---|
| Boot | 3 | 6 |
| Driver/Passenger area | 123 | 99 |
| Engine | 44 | 291 |
| Fuel tank | 8 | 49 |
| Other inside / Cargo area | 12 | 24 |
| Wheel/Brakes | 0 | 7 |
| Other | 12 | 38 |
| Unknown | 45 | 59 |
| Total | 247 | 573 |
Table 21: Location of outdoor fatal and severe casualty fires, combined data for years ending March 2011 to 2019
| Outdoor location | Fatal fires | Severe casualty fires |
|---|---|---|
| NON-ROAD VEHICLE | ||
| Aircraft | 18 | 10 |
| Boat | 7 | 41 |
| Rail vehicle | 2 | 1 |
| OUTDOOR | ||
| Domestic garden (vegetation not equipment) | 31 | 76 |
| Grassland, woodland and crops | 15 | 29 |
| Human harm outdoors1 | 34 | 90 |
| Loose refuse | 3 | 61 |
| Other outdoors | 26 | 82 |
| OUTDOOR STRUCTURE | ||
| Outdoor equipment and machinery | 3 | 63 |
| Outdoor structures | 18 | 133 |
| Total | 157 | 586 |
Notes:
- ‘Human harm outdoors’ is defined as fire where the focus of the fire was the individual involved e.g. self-immolation.
Table 22: Outdoor fatal and severe casualty fire start location, combined data for years ending March 2011 to 2019
| Fire start location | Fatal fires | Severe casualty fires |
|---|---|---|
| Other | 47 | 98 |
| On or near tracks or paths | 25 | 46 |
| In open area next to housing | 41 | 197 |
| Unknown | 37 | 211 |
| Non-road vehicle | 7 | 34 |
| Total | 157 | 586 |
D.4 Seasonality
Table 23: Fatal and severe casualty fires by month and season, combined data for years ending March 2011 to 2019
| Season - Month | Fatal fires | Severe casualty fires |
|---|---|---|
| Winter - December | 247 | 469 |
| Winter - January | 243 | 421 |
| Winter - February | 221 | 375 |
| Spring - March | 236 | 434 |
| Spring - April | 221 | 442 |
| Spring - May | 196 | 440 |
| Summer - June | 146 | 427 |
| Summer - July | 156 | 456 |
| Summer - August | 157 | 445 |
| Autumn - September | 163 | 402 |
| Autumn - October | 173 | 376 |
| Autumn - November | 197 | 441 |
| Total | 2,356 | 5,128 |
Table 24: Fatal and severe casualty fires by location and season, combined data for years ending March 2011 to 2019
| Location by Season | Fatal fires | Severe casualty fires |
|---|---|---|
| Dwellings - Winter | 581 | 942 |
| Dwellings - Spring | 499 | 860 |
| Dwellings - Summer | 326 | 766 |
| Dwellings - Autumn | 402 | 801 |
| Other buildings - Winter | 38 | 131 |
| Other buildings - Spring | 47 | 148 |
| Other buildings - Summer | 31 | 174 |
| Other buildings - Autumn | 28 | 147 |
| Other outdoors - Winter | 28 | 82 |
| Other outdoors - Spring | 53 | 162 |
| Other outdoors - Summer | 41 | 209 |
| Other outdoors - Autumn | 35 | 133 |
| Road vehicles - Winter | 64 | 110 |
| Road vehicles - Spring | 54 | 146 |
| Road vehicles - Summer | 61 | 179 |
| Road vehicles - Autumn | 68 | 138 |
| Total | 2,356 | 5,128 |
Table 25: Fatal and severe casualty fires by location and day of the week, combined data for years ending March 2011 to 2019
| Location by Day | Fatal fires | Severe casualty fire |
|---|---|---|
| Dwellings - Monday | 267 | 546 |
| Dwellings - Tuesday | 289 | 446 |
| Dwellings - Wednesday | 239 | 461 |
| Dwellings - Thursday | 249 | 440 |
| Dwellings - Friday | 228 | 502 |
| Dwellings - Saturday | 263 | 454 |
| Dwellings - Sunday | 273 | 520 |
| Other buildings - Monday | 20 | 83 |
| Other buildings - Tuesday | 31 | 82 |
| Other buildings - Wednesday | 22 | 85 |
| Other buildings - Thursday | 18 | 76 |
| Other buildings - Friday | 16 | 82 |
| Other buildings - Saturday | 17 | 92 |
| Other buildings - Sunday | 20 | 100 |
| Other outdoors - Monday | 27 | 97 |
| Other outdoors - Tuesday | 28 | 61 |
| Other outdoors - Wednesday | 17 | 79 |
| Other outdoors - Thursday | 19 | 69 |
| Other outdoors - Friday | 19 | 89 |
| Other outdoors - Saturday | 24 | 88 |
| Other outdoors - Sunday | 23 | 103 |
| Road vehicles - Monday | 35 | 89 |
| Road vehicles - Tuesday | 35 | 76 |
| Road vehicles - Wednesday | 41 | 69 |
| Road vehicles - Thursday | 33 | 65 |
| Road vehicles - Friday | 34 | 84 |
| Road vehicles - Saturday | 31 | 72 |
| Road vehicles - Sunday | 38 | 118 |
| Total | 2,356 | 5,128 |
Table 26: Fatal and severe casualty fires by time of day, combined data for years ending March 2011 to 2019
| Time of day & Hour bands | Fatal fires | Severe casualty fires |
|---|---|---|
| Late night - 00:00 to 00:59 | 105 | 243 |
| Late night - 01:00 to 01:59 | 108 | 215 |
| Late night - 02:00 to 02:59 | 90 | 175 |
| Late night - 03:00 to 03:59 | 82 | 161 |
| Early morning - 04:00 to 04:59 | 80 | 141 |
| Early morning - 05:00 to 05:59 | 74 | 130 |
| Early morning - 06:00 to 06:59 | 94 | 95 |
| Early morning - 07:00 to 07:59 | 105 | 147 |
| Morning - 08:00 to 08:59 | 105 | 151 |
| Morning - 09:00 to 09:59 | 104 | 168 |
| Morning - 10:00 to 10:59 | 108 | 161 |
| Morning - 11:00 to 11:59 | 93 | 221 |
| Afternoon - 12:00 to 12:59 | 92 | 223 |
| Afternoon - 13:00 to 13:59 | 83 | 206 |
| Afternoon - 14:00 to 14:59 | 112 | 272 |
| Afternoon - 15:00 to 15:59 | 118 | 261 |
| Evening - 16:00 to 16:59 | 114 | 264 |
| Evening - 17:00 to 17:59 | 111 | 304 |
| Evening - 18:00 to 18:59 | 92 | 280 |
| Evening - 19:00 to 19:59 | 104 | 287 |
| Night - 20:00 to 20:59 | 107 | 297 |
| Night - 21:00 to 21:59 | 99 | 271 |
| Night - 22:00 to 22:59 | 96 | 251 |
| Night - 23:00 to 23:59 | 80 | 204 |
| Total | 2,356 | 5,128 |
D.5 Circumstances of fire
Table 27: Fatal and severe casualty fires by source of ignition, combined data for years ending March 2011 to 2019
| Source of ignition | Fatal fires | Severe casualty fires |
|---|---|---|
| Other/Unspecified | 776 | 1,799 |
| Smokers’ materials | 590 | 593 |
| Cigarette lighters | 199 | 410 |
| Cooking appliances | 180 | 1,117 |
| Space heating appliances | 175 | 225 |
| Matches | 143 | 229 |
| Other electrical appliances | 106 | 205 |
| Candles | 94 | 204 |
| Electrical distribution | 80 | 267 |
| Blowlamps, welding and cutting equipment | 8 | 69 |
| Central and water heating appliances | 5 | 10 |
| Total | 2,356 | 5,128 |
Table 28: Fatal and severe casualty fires by cause of fire, combined data for years ending March 2011 to 2019
| Cause of fire | Fatal fires | Severe casualty fires |
|---|---|---|
| Careless handling of fire or hot substances | 640 | 698 |
| Deliberate | 511 | 1,040 |
| Other accidental | 450 | 1,083 |
| Placing articles too close to heat | 369 | 611 |
| Misuse of equipment or appliances | 137 | 713 |
| Faulty appliances and leads | 126 | 286 |
| Chip/Fat pan fires | 56 | 395 |
| Faulty fuel supplies | 45 | 192 |
| Playing with fire | 15 | 102 |
| Unspecified | 7 | 8 |
| Total | 2,356 | 5,128 |
Table 29: Item first ignited in fatal and severe casualty fires, combined data for years ending March 2011 to 2019
| Location - Item first ignited | Fatal fire | Severe casualty fire | Fires |
|---|---|---|---|
| Dwellings - Agricultural and forestry product | 17 | 49 | 66 |
| Dwellings - Explosives gases and chemicals | 110 | 285 | 384 |
| Dwellings - Food | 83 | 709 | 788 |
| Dwellings - None | 3 | 13 | 16 |
| Dwellings - Not known | 269 | 264 | 515 |
| Dwellings - Unspecified | 4 | 4 | 8 |
| Dwellings - Other materials | 79 | 169 | 245 |
| Dwellings - Paper, cardboard | 128 | 181 | 302 |
| Dwellings - Rubbish/Waste/Recycling | 49 | 68 | 115 |
| Dwellings - Structure and fittings | 76 | 226 | 294 |
| Dwellings - Textiles, upholstery and furnishings | 990 | 1,401 | 2,360 |
| Other buildings - Agricultural and forestry product | 3 | 19 | 22 |
| Other buildings - Explosives, gases and chemicals | 28 | 145 | 171 |
| Other buildings - Food | 1 | 44 | 45 |
| Other buildings - None | 1 | 6 | 7 |
| Other buildings - Not known | 28 | 56 | 81 |
| Other buildings - Unspecified | 0 | 1 | 1 |
| Other buildings - Other materials | 9 | 36 | 44 |
| Other buildings - Paper, cardboard | 12 | 38 | 49 |
| Other buildings - Rubbish/Waste/Recycling | 2 | 22 | 24 |
| Other buildings - Structure and fittings | 5 | 58 | 62 |
| Other buildings - Textiles, upholstery and furnishings | 55 | 175 | 225 |
| Other outdoors - Agricultural and forestry product | 5 | 93 | 98 |
| Other outdoors - Explosives, gases and chemicals | 59 | 172 | 231 |
| Other outdoors - Food | 1 | 4 | 5 |
| Other outdoors - None | 0 | 4 | 4 |
| Other outdoors - Not known | 27 | 34 | 61 |
| Other outdoors - Unspecified | 2 | 9 | 11 |
| Other outdoors - Other materials | 9 | 32 | 38 |
| Other outdoors - Paper, cardboard | 4 | 34 | 38 |
| Other outdoors - Rubbish/Waste/Recycling | 0 | 46 | 46 |
| Other outdoors - Structure and fittings | 2 | 15 | 17 |
| Other outdoors - Textiles, upholstery and furnishings | 48 | 143 | 190 |
| Road vehicles - Agricultural and forestry product | 1 | 1 | 2 |
| Road vehicles - Explosives, gases and chemicals | 99 | 214 | 305 |
| Road vehicles - None | 0 | 3 | 3 |
| Road vehicles - Not known | 83 | 140 | 216 |
| Road vehicles - Other materials | 15 | 31 | 46 |
| Road vehicles - Paper, cardboard | 1 | 4 | 5 |
| Road vehicles - Rubbish/Waste/Recycling | 0 | 4 | 4 |
| Road vehicles - Structure and fittings | 14 | 103 | 115 |
| Road vehicles - Textiles, upholstery and furnishings | 34 | 73 | 107 |
| Total | 2,356 | 5,128 | 7,366 |
Table 30: Fatal and severe casualty fires by fire spread and location, combined data for years ending March 2011 to 2019
| Location - Fire spread | Fatal fires | Severe casualty fires |
|---|---|---|
| Dwelling - Limited to room of origin | 623 | 1,240 |
| Dwelling - Limited to floor of origin | 534 | 762 |
| Dwelling - Whole building | 234 | 195 |
| Dwelling - Limited to two floors | 148 | 205 |
| Dwelling - Unspecified/Other | 115 | 438 |
| Dwelling - Limited to item first ignited | 53 | 405 |
| Dwelling - Roof space and other floors(s) | 51 | 61 |
| Dwelling - Affecting more than two floors | 46 | 47 |
| Dwelling - Roof and Roof Spaces | 4 | 16 |
| Other non-residential buildings - Whole building | 46 | 88 |
| Other non-residential buildings - Limited to room of origin | 24 | 177 |
| Other non-residential buildings - Limited to floor of origin | 15 | 50 |
| Other non-residential buildings - Unspecified/Other | 9 | 64 |
| Other non-residential buildings - Limited to item first ignited | 7 | 70 |
| Other non-residential buildings - Limited to two floors | 4 | 28 |
| Other non-residential buildings - Roof and Roof Spaces | 2 | 5 |
| Other non-residential buildings - Affecting more than two floors | 1 | 3 |
| Other non-residential buildings - Roof space and other floors(s) | - | 5 |
| Other residential buildings - Limited to room of origin | 17 | 50 |
| Other residential buildings - Limited to floor of origin | 5 | 16 |
| Other residential buildings - Unspecified/Other | 4 | 16 |
| Other residential buildings - Limited to item first ignited | 3 | 21 |
| Other residential buildings - Roof space and other floors(s) | 2 | 2 |
| Other residential buildings - Whole building | 2 | 3 |
| Other residential buildings - Affecting more than two floors | 2 | - |
| Other residential buildings - Limited to two floors | 1 | 2 |
| Non-road vehicle - Non-road vehicles | 25 | 29 |
| Non-road vehicle - Unspecified/Other | 2 | 3 |
| Non-road vehicle - Limited to item first ignited | - | 9 |
| Non-road vehicle - Limited to room of origin | - | 11 |
| Road vehicles - Whole vehicle | 188 | 386 |
| Road vehicles - Driver/Passenger compartment | 52 | 62 |
| Road vehicles - Unspecified/Other | 7 | 38 |
| Road vehicles - Engine/Fuel Tank | - | 87 |
Table 31: Presence of working smoke alarm in fatal and severe casualty fires in dwellings in England, combined data for year ending March 2001 to 20191
| Working smoke alarm | No working smoke alarm | |
|---|---|---|
| Fires | 179,962 | 110,710 |
| Severe | 1,885 | 1,484 |
| Fatal fires | 895 | 913 |
| Proportion of dwellings | 88% | 12% |
| Proportion of fires | 62% | 38% |
| Proportion of severe casualty | 56% | 44% |
| Proportion of fatal fires | 50% | 50% |
Notes:
- Data on smoke alarm ownership are from the English Housing Survey 2018 to 2019.
D.6 Profile
Data used for RR calculations are presented in this section. As specific information on age and gender is missing, totals between tables will not match. Mid-year population estimates from ONS were combined for all years.
Table 32: RR of fire-related fatality by age, combined data for years ending March 2011 to 2019
| Age | Fatalities | Population | Relative risk | Confidence |
|---|---|---|---|---|
| Under 1 | 13 | 6,011,687 | 0.4 | 0.5 |
| 1 to 5 | 41 | 30,493,403 | 0.2 | 0.3 |
| 6 to 10 | 39 | 28,787,088 | 0.2 | 0.3 |
| 11 to 16 | 27 | 33,342,278 | 0.1 | 0.4 |
| 17 to 24 | 107 | 49,912,236 | 0.4 | 0.2 |
| 25 to 39 | 300 | 98,279,324 | 0.5 | 0.1 |
| 40 to 54 | 569 | 101,160,986 | 1.1 | 0.1 |
| 55 to 64 | 365 | 56,092,329 | 1.2 | 0.1 |
| 65 to 79 | 564 | 61,707,863 | 1.9 | 0.1 |
| 80 or over | 507 | 23,289,224 | 4.8 | 0.1 |
| Total | 2,637 | 489,076,418 |
Table 33: RR of severe casualty by age, combined data for years ending March 2011 to 2019
| Age | Severe casualty | Population | Relative risk | Confidence |
|---|---|---|---|---|
| Under 1 | 89 | 6,011,687 | 1.2 | 0.2 |
| 1 to 5 | 110 | 30,493,403 | 0.3 | 0.2 |
| 6 to 10 | 81 | 28,787,088 | 0.2 | 0.2 |
| 11 to 16 | 165 | 33,342,278 | 0.4 | 0.2 |
| 17 to 24 | 613 | 49,912,236 | 1 | 0.1 |
| 25 to 39 | 1,323 | 98,279,324 | 1.2 | 0.1 |
| 40 to 54 | 1,344 | 101,160,986 | 1.2 | 0.1 |
| 55 to 64 | 549 | 56,092,329 | 0.8 | 0.1 |
| 65 to 79 | 598 | 61,707,863 | 0.8 | 0.1 |
| 80 or over | 448 | 23,289,224 | 1.7 | 0.1 |
| Total | 5,817 | 489,076,418 |
Table 34: RR to fire-related fatality by age and gender, combined data for years ending March 2011 to 2019
| Age (by Gender) | Fatality | Population | Relative risk | Confidence |
|---|---|---|---|---|
| FEMALE | ||||
| Under 1 | 5 | 2,929,435 | 0.3 | 0.9 |
| 1 to 5 | 20 | 14,876,797 | 0.3 | 0.4 |
| 6 to 10 | 13 | 14,049,983 | 0.2 | 0.5 |
| 11 to 16 | 11 | 16,256,983 | 0.1 | 0.6 |
| 17 to 24 | 34 | 24,444,816 | 0.3 | 0.3 |
| 25 to 39 | 96 | 49,171,263 | 0.4 | 0.2 |
| 40 to 54 | 187 | 51,070,449 | 0.7 | 0.1 |
| 55 to 64 | 109 | 28,475,978 | 0.7 | 0.2 |
| 65 to 79 | 221 | 32,374,544 | 1.4 | 0.1 |
| 80 or over | 257 | 14,296,212 | 3.8 | 0.1 |
| MALE | ||||
| Under 1 | 7 | 3,082,252 | 0.4 | 0.7 |
| 1 to 5 | 21 | 15,616,606 | 0.3 | 0.4 |
| 6 to 10 | 26 | 14,737,105 | 0.3 | 0.4 |
| 11 to 16 | 16 | 17,085,295 | 0.2 | 0.5 |
| 17 to 24 | 71 | 25,467,420 | 0.5 | 0.2 |
| 25 to 39 | 198 | 49,108,061 | 0.8 | 0.1 |
| 40 to 54 | 378 | 50,090,537 | 1.5 | 0.1 |
| 55 to 64 | 256 | 27,616,351 | 1.9 | 0.1 |
| 65 to 79 | 343 | 29,333,319 | 2.5 | 0.1 |
| 80 or over | 247 | 8,993,012 | 5.8 | 0.1 |
| TOTAL | 2,516 | 489,076,418 |
Table 35: RR of severe casualty by age and gender, combined data for years ending March 2011 to 2019
| Age (by gender) | Severe casualty | Population | Relative risk | Confidence |
|---|---|---|---|---|
| FEMALE | ||||
| Under 1 | 30 | 2,929,435 | 0.9 | 0.4 |
| 1 to 5 | 44 | 14,876,797 | 0.3 | 0.3 |
| 6 to 10 | 35 | 14,049,983 | 0.2 | 0.3 |
| 11 to 16 | 64 | 16,256,983 | 0.4 | 0.2 |
| 17 to 24 | 193 | 24,444,816 | 0.7 | 0.1 |
| 25 to 39 | 372 | 49,171,263 | 0.7 | 0.1 |
| 40 to 54 | 424 | 51,070,449 | 0.7 | 0.1 |
| 55 to 64 | 171 | 28,475,978 | 0.5 | 0.2 |
| 65 to 79 | 228 | 32,374,544 | 0.6 | 0.1 |
| 80 or over | 250 | 14,296,212 | 1.6 | 0.1 |
| MALE | ||||
| Under 1 | 57 | 3,082,252 | 1.7 | 0.3 |
| 1 to 5 | 64 | 15,616,606 | 0.4 | 0.2 |
| 6 to 10 | 46 | 14,737,105 | 0.3 | 0.3 |
| 11 to 16 | 101 | 17,085,295 | 0.5 | 0.2 |
| 17 to 24 | 420 | 25,467,420 | 1.6 | 0.1 |
| 25 to 39 | 951 | 49,108,061 | 2 | 0.1 |
| 40 to 54 | 920 | 50,090,537 | 1.8 | 0.1 |
| 55 to 64 | 378 | 27,616,351 | 1.3 | 0.1 |
| 65 to 79 | 369 | 29,333,319 | 1.2 | 0.1 |
| 80 or over | 198 | 8,993,012 | 2.1 | 0.1 |
| Total | 5,315 | 489,076,418 |
Table 36: RR of fatality in deliberate fires by age and gender, combined data for years ending March 2011 to 2019
| Age (by gender) | Fatality | Population | Relative risk | Confidence |
|---|---|---|---|---|
| FEMALE | ||||
| Under 1 | 2 | 2,929,435 | 0.6 | 1.4 |
| 1 to 5 | 5 | 14,876,797 | 0.3 | 0.9 |
| 6 to 10 | 5 | 14,049,983 | 0.3 | 0.9 |
| 11 to 16 | 1 | 16,256,983 | 0.1 | 2 |
| 17 to 24 | 11 | 24,444,816 | 0.4 | 0.6 |
| 25 to 39 | 34 | 49,171,263 | 0.6 | 0.3 |
| 40 to 54 | 63 | 51,070,449 | 1.1 | 0.3 |
| 55 to 64 | 19 | 28,475,978 | 0.6 | 0.5 |
| 65 to 79 | 16 | 32,374,544 | 0.4 | 0.5 |
| 80 or over | 11 | 14,296,212 | 0.7 | 0.6 |
| MALE | ||||
| Under 1 | 4 | 3,082,252 | 1.2 | 1 |
| 1 to 5 | 7 | 15,616,606 | 0.4 | 0.7 |
| 6 to 10 | 8 | 14,737,105 | 0.5 | 0.7 |
| 11 to 16 | 6 | 17,085,295 | 0.3 | 0.8 |
| 17 to 24 | 22 | 25,467,420 | 0.8 | 0.4 |
| 25 to 39 | 67 | 49,108,061 | 1.3 | 0.3 |
| 40 to 54 | 133 | 50,090,537 | 2.8 | 0.2 |
| 55 to 64 | 63 | 27,616,351 | 2.2 | 0.3 |
| 65 to 79 | 44 | 29,333,319 | 1.4 | 0.3 |
| 80 or over | 23 | 8,993,012 | 2.4 | 0.4 |
| TOTAL | 544 | 489,076,418 |
Table 37: RR of severe casualty in deliberate fires by age and gender, combined data for years ending March 2011 to 2019
| Age (by gender) | Severe casualty | Population | Relative risk | Confidence |
|---|---|---|---|---|
| FEMALE | ||||
| Under 1 | 4 | 2,929,435 | 0.6 | 1 |
| 1 to 5 | 3 | 14,876,797 | 0.1 | 1.1 |
| 6 to 10 | 2 | 14,049,983 | 0.1 | 1.4 |
| 11 to 16 | 9 | 16,256,983 | 0.2 | 0.7 |
| 17 to 24 | 54 | 24,444,816 | 1 | 0.3 |
| 25 to 39 | 100 | 49,171,263 | 0.9 | 0.2 |
| 40 to 54 | 135 | 51,070,449 | 1.3 | 0.2 |
| 55 to 64 | 33 | 28,475,978 | 0.5 | 0.3 |
| 65 to 79 | 29 | 32,374,544 | 0.4 | 0.4 |
| 80 or over | 19 | 14,296,212 | 0.6 | 0.5 |
| MALE | ||||
| Under 1 | 18 | 3,082,252 | 2.7 | 0.5 |
| 1 to 5 | 17 | 15,616,606 | 0.5 | 0.5 |
| 6 to 10 | 12 | 14,737,105 | 0.4 | 0.6 |
| 11 to 16 | 27 | 17,085,295 | 0.7 | 0.4 |
| 17 to 24 | 81 | 25,467,420 | 1.5 | 0.2 |
| 25 to 39 | 198 | 49,108,061 | 2.1 | 0.2 |
| 40 to 54 | 206 | 50,090,537 | 2.1 | 0.1 |
| 55 to 64 | 64 | 27,616,351 | 1.1 | 0.3 |
| 65 to 79 | 38 | 29,333,319 | 0.6 | 0.3 |
| 80 or over | 8 | 8,993,012 | 0.4 | 0.7 |
| TOTAL | 1,057 | 489,076,418 |
Table 38: Fatal and severe casualty fires by household, combined data for years ending March 2011 to 2019
| Household occupancy | Fatal fires | Severe casualty fires |
|---|---|---|
| Three or more adults under pensionable age, no child/ren | 49 | 221 |
| Three or more adults with dependent child/ren | 32 | 95 |
| Couple both under pensionable age with no child/ren | 78 | 233 |
| Couple one or more over pensionable age, no child/ren | 130 | 167 |
| Couple with dependant child/ren | 59 | 288 |
| Lone parent with dependant child/ren | 34 | 154 |
| Lone person over pensionable age | 660 | 580 |
| Lone person under pensionable age | 454 | 897 |
| Not known | 61 | 159 |
| Other | 251 | 575 |
| Total | 1,808 | 3,369 |
Appendix E. Fatal fires, year ending March 2017
Raw data for information collected in the FIRs is presented alongside descriptive information on the clusters. Cluster analysis was conducted at victim level. Where appropriate, some categories have been combined to include a minimum of 5 persons or fires and avoid disclosure.
Table 39: Number of victims in each cluster, year ending March 2017
| Cluster reference | Cluster name | Victims | Fatal fires |
|---|---|---|---|
| C1 | Vulnerable with working smoke alarm | 19 | |
| C2 | Under the influence of alcohol and smoking | 30 | |
| C3 | Individual with impairment | 38 | |
| C4 | Misused heating devices and poor housekeeping | 46 | |
| C5 | Single male falls asleep while smoking | 19 | |
| C6 | Single female falls asleep while smoking | 20 | |
| C7 | Male with impairments in mixed circumstances | 29 | |
| Total | 201 | 185 |
E.1 Location of fatal dwelling fires
Table 40: Dwelling type in fatal dwelling fires, year ending March 2017
| Dwelling type | Fatal fires | Victims | C1 | C2 | C3 | C4 | C5 | C6 | C7 |
|---|---|---|---|---|---|---|---|---|---|
| House | 97 | 109 | 9 | 20 | 24 | 23 | 8 | 12 | 13 |
| Purpose-built flat | 44 | 45 | 7 | 3 | 7 | 7 | 5 | 6 | 10 |
| Bungalow | 20 | 22 | 1 | 4 | 4 | 9 | 1 | 1 | 2 |
| Not stated | 10 | 11 | 2 | 1 | 2 | 4 | 2 | ||
| Converted flat | 9 | 9 | 1 | 1 | 2 | 1 | 4 | ||
| Other | 5 | 5 | 1 | 1 | 2 | 1 | |||
| Total | 185 | 201 | 19 | 30 | 38 | 46 | 19 | 20 | 29 |
Table 41: Fatal dwelling fires where the building construction contributed to the outcome, ending March 2017
| Contribution | Fatal fires |
|---|---|
| Contribute | 4 |
| Inhibit | 7 |
| Not applicable | 25 |
| Not stated | 142 |
| Total | 185 |
Table 42: Room of origin in fatal dwelling fires, year ending March 2017
| Room of origin | Fatal fires | Victims | C1 | C2 | C3 | C4 | C5 | C6 | C7 |
|---|---|---|---|---|---|---|---|---|---|
| Sitting room | 71 | 77 | 10 | 13 | 12 | 16 | 8 | 8 | 10 |
| Bedroom | 55 | 60 | 5 | 10 | 13 | 11 | 4 | 5 | 12 |
| Kitchen | 29 | 31 | 3 | 4 | 3 | 8 | 3 | 5 | 5 |
| Bathroom/ Outside/Other | 14 | 14 | 2 | 5 | 5 | 1 | 1 | ||
| Unknown | 6 | 7 | 1 | 4 | 1 | 1 | |||
| Hallway | 5 | 6 | 1 | 1 | 3 | 1 | |||
| Not stated | 5 | 6 | 1 | 4 | 1 | ||||
| Total | 185 | 201 | 19 | 30 | 38 | 46 | 19 | 20 | 29 |
Table 43: Fatal dwelling fires that started in a bedroom or sitting room modified for the victim’s impairment, year ending March 2017
| Had the room been modified? | Fatal fires |
|---|---|
| No | 41 |
| Not collected | 52 |
| Not stated | 24 |
| Yes | 9 |
| Total | 126 |
Table 44: Tenure in fatal dwelling fires, year ending March 2017
| Tenure | Fatal fires | Victims | C1 | C2 | C3 | C4 | C5 | C6 | C7 |
|---|---|---|---|---|---|---|---|---|---|
| Unknown / Not stated | 80 | 83 | 6 | 16 | 13 | 27 | 10 | 5 | 6 |
| Owned | 52 | 56 | 3 | 8 | 10 | 9 | 4 | 10 | 12 |
| Rented – private | 25 | 33 | 5 | 11 | 8 | 4 | 2 | 3 | |
| Rented – social housing | 28 | 29 | 10 | 1 | 4 | 2 | 1 | 3 | 8 |
| Total | 185 | 201 | 19 | 30 | 38 | 46 | 19 | 20 | 29 |
Table 45: Household makeup in fatal dwelling fires, year ending March 2017
| Household makeup | Fatal fires | Victims | C1 | C2 | C3 | C4 | C5 | C6 | C7 |
|---|---|---|---|---|---|---|---|---|---|
| Single adult | 107 | 107 | 12 | 19 | 20 | 14 | 8 | 15 | 19 |
| Other/Unknown/ Not stated | 31 | 32 | 2 | 1 | 6 | 20 | 1 | 2 | |
| Couple without children | 19 | 24 | 3 | 5 | 5 | 7 | 1 | 1 | 2 |
| Adults (related) | 13 | 15 | 1 | 1 | 1 | 1 | 5 | 3 | 3 |
| With children | 10 | 15 | 1 | 1 | 4 | 4 | 4 | 1 | |
| Adults (not related) | 5 | 8 | 3 | 2 | 1 | 2 | |||
| Total | 185 | 201 | 19 | 30 | 38 | 46 | 19 | 20 | 29 |
Table 46: Relationship of other occupants to victim in fatal dwelling fires, the year ending March 2017
| Relationship to victim | Fatal fires | Victims | C1 | C2 | C3 | C4 | C5 | C6 | C7 |
|---|---|---|---|---|---|---|---|---|---|
| Not applicable | 120 | 120 | 13 | 19 | 22 | 19 | 8 | 16 | 23 |
| Spouse | 19 | 25 | 3 | 6 | 4 | 9 | 1 | 1 | 1 |
| Not stated | 17 | 17 | 1 | 1 | 4 | 11 | |||
| Immediate family (siblings and parents) | 9 | 14 | 1 | 4 | 4 | 3 | 2 | ||
| Other | 7 | 9 | 1 | 1 | 1 | 4 | 1 | 1 | |
| Other resident(s) | 5 | 8 | 3 | 2 | 1 | 2 | |||
| Child(ren) of victim | 8 | 8 | 1 | 1 | 2 | 2 | 2 | ||
| Total | 185 | 201 | 19 | 30 | 38 | 46 | 19 | 20 | 29 |
E.2 Timing of fatal dwelling fires
Table 47: Fire-related fatalities in dwelling fires by quarter, the year ending March 2017
| Quarter | Fatal fires | Victims | C1 | C2 | C3 | C4 | C5 | C6 | C7 |
|---|---|---|---|---|---|---|---|---|---|
| Jan to Mar | 55 | 61 | 4 | 5 | 17 | 22 | 6 | 2 | 5 |
| Ap to Jun | 38 | 40 | 5 | 9 | 4 | 4 | 6 | 5 | 7 |
| Jul to Sep | 25 | 25 | 1 | 4 | 5 | 7 | 2 | 2 | 4 |
| Oct to Dec | 67 | 75 | 9 | 12 | 12 | 13 | 5 | 11 | 13 |
| Total | 185 | 201 | 19 | 30 | 38 | 46 | 19 | 20 | 29 |
Table 48: Fatal dwelling fires by season, the year ending March 2017
| Season | Fatal fires |
|---|---|
| Winter (Dec to Feb) | 63 |
| Spring (Mar to May) | 44 |
| Summer (Jun to Aug) | 27 |
| Autumn (Sep to Nov) | 51 |
| Total | 185 |
Table 49: Fatal dwelling fires by day of week, the year ending March 2017
| Day | Fatal fires | Victims | C1 | C2 | C3 | C4 | C5 | C6 | C7 |
|---|---|---|---|---|---|---|---|---|---|
| Weekday | 121 | 133 | 15 | 19 | 22 | 26 | 14 | 16 | 21 |
| Weekend | 64 | 68 | 4 | 11 | 16 | 20 | 5 | 4 | 8 |
| Total | 185 | 201 | 19 | 30 | 38 | 46 | 19 | 20 | 29 |
Table 50: Fatal dwelling fires by time of day, the year ending March 2017
| Time of day | Fatal fires | Victims | C1 | C2 | C3 | C4 | C5 | C6 | C7 |
|---|---|---|---|---|---|---|---|---|---|
| Morning (06:00 to 11:59) | 35 | 36 | 3 | 6 | 8 | 4 | 4 | 4 | 7 |
| Afternoon (12:00 to 17:59) | 41 | 41 | 2 | 3 | 7 | 8 | 4 | 7 | 10 |
| Evening (18:00 to 23:59) | 45 | 47 | 11 | 6 | 11 | 9 | 3 | 4 | 3 |
| Night (00:00 to 05:59) | 44 | 55 | 1 | 11 | 7 | 17 | 7 | 5 | 7 |
| Not stated | 10 | 11 | 1 | 3 | 6 | 1 | |||
| Unknown | 10 | 11 | 2 | 3 | 2 | 2 | 2 | ||
| Total | 185 | 201 | 19 | 30 | 38 | 46 | 19 | 20 | 29 |
E.3 Cause of fatal dwelling fires
Table 51: Motive in fatal dwelling fires, year ending March 2017
| Motive | Fatal fires | Victims | C1 | C2 | C3 | C4 | C5 | C6 | C7 |
|---|---|---|---|---|---|---|---|---|---|
| Accidental | 152 | 163 | 18 | 28 | 23 | 34 | 17 | 19 | 24 |
| Deliberate | 27 | 30 | 1 | 1 | 12 | 10 | 2 | 4 | |
| Not stated / Unknown | 6 | 8 | 1 | 3 | 2 | 1 | 1 | ||
| Total | 185 | 201 | 19 | 30 | 38 | 46 | 19 | 20 | 29 |
Table 52: Cause of fire in fatal dwelling fires, year ending March 2017
| Cause | Fatal fires | Victims | C1 | C2 | C3 | C4 | C5 | C6 | C7 |
|---|---|---|---|---|---|---|---|---|---|
| Arson/Other | 9 | 11 | 2 | 2 | 4 | 2 | 1 | ||
| Candles/ Incense | 14 | 16 | 2 | 1 | 2 | 5 | 3 | 3 | |
| Careless use of heat emitting electrical items | 19 | 21 | 3 | 3 | 11 | 1 | 2 | 1 | |
| Cooking | 7 | 7 | 3 | 2 | 1 | 1 | |||
| Electrical appliances malfunctioning | 9 | 9 | 1 | 1 | 3 | 1 | 3 | ||
| Naked flame | 11 | 11 | 2 | 2 | 1 | 1 | 2 | 3 | |
| Not stated | 8 | 11 | 1 | 7 | 2 | 1 | |||
| Open fire / Log burner | 9 | 10 | 1 | 3 | 5 | 1 | |||
| Smoker’s materials | 60 | 62 | 9 | 13 | 9 | 4 | 7 | 11 | 9 |
| Suicide | 16 | 16 | 1 | 9 | 2 | 4 | |||
| Unknown | 23 | 27 | 2 | 4 | 10 | 5 | 1 | 5 | |
| Total | 185 | 201 | 19 | 30 | 38 | 46 | 19 | 20 | 29 |
Table 53: Item first ignited in fatal dwelling fires, the year ending March 2017
| Item first ignited | Fatal fires | Victims | C1 | C2 | C3 | C4 | C5 | C6 | C7 |
|---|---|---|---|---|---|---|---|---|---|
| Bedding | 22 | 22 | 4 | 3 | 5 | 2 | 2 | 1 | 5 |
| Carpet/Flooring | 8 | 8 | 1 | 1 | 2 | 1 | 2 | 1 | |
| Clothing | 27 | 28 | 2 | 3 | 5 | 2 | 3 | 7 | 6 |
| Other | 21 | 23 | 2 | 3 | 3 | 8 | 2 | 5 | |
| Electrical equipment | 6 | 6 | 2 | 1 | 1 | 1 | 1 | ||
| Flammable gases/ atmosphere | 8 | 8 | 1 | 3 | 1 | 1 | 1 | 1 | |
| Food and/or kitchen equipment | 7 | 7 | 3 | 2 | 1 | 1 | |||
| Furniture/ Furnishing | 31 | 33 | 4 | 5 | 5 | 6 | 5 | 4 | 4 |
| Not stated | 22 | 27 | 2 | 2 | 2 | 15 | 4 | 2 | |
| Paper | 5 | 6 | 2 | 1 | 3 | ||||
| Unknown | 27 | 33 | 2 | 8 | 12 | 4 | 4 | 3 | |
| Total | 185 | 201 | 19 | 30 | 38 | 46 | 19 | 20 | 29 |
Table 54: Victim status on arrival of FRSs in fatal dwelling fires, the year ending March 2017
| Victim status | Victims | C1 | C2 | C3 | C4 | C5 | C6 | C7 |
|---|---|---|---|---|---|---|---|---|
| Alive | 68 | 8 | 4 | 5 | 22 | 9 | 6 | 14 |
| Deceased | 109 | 6 | 26 | 29 | 16 | 6 | 12 | 14 |
| Unknown / Not stated | 24 | 5 | 4 | 8 | 4 | 2 | 1 | |
| Total | 201 | 19 | 30 | 38 | 46 | 19 | 20 | 29 |
Table 55: Cause of death in fatal dwelling fires, the year ending March 2017
| Cause of death | Victims | C1 | C2 | C3 | C4 | C5 | C6 | C7 |
|---|---|---|---|---|---|---|---|---|
| Not stated | 84 | 12 | 7 | 22 | 34 | 4 | 4 | 1 |
| Smoke inhalation | 57 | 4 | 8 | 9 | 9 | 9 | 8 | 10 |
| Burns or smoke | 30 | 1 | 14 | 2 | 1 | 1 | 11 | |
| Burns | 17 | 2 | 1 | 5 | 1 | 1 | 5 | 2 |
| Other/Unknown | 13 | 1 | 5 | 2 | 5 | |||
| Total | 201 | 19 | 30 | 38 | 46 | 19 | 20 | 29 |
E.4 Victim profile in fatal dwelling fires
Table 56: Number of non-fatal casualties in fatal dwelling fires, the year ending March 2017
| Number of non-fatal casualties | Fatal fires | Fatal victims | C1 | C2 | C3 | C4 | C5 | C6 | C7 |
|---|---|---|---|---|---|---|---|---|---|
| 0 | 157 | 168 | 19 | 26 | 33 | 37 | 14 | 17 | 22 |
| 1 | 15 | 16 | 3 | 2 | 3 | 3 | 5 | ||
| 2 | 4 | 6 | 1 | 3 | 2 | ||||
| 3+ | 4 | 6 | 2 | 2 | 2 | ||||
| Not stated | 5 | 5 | 1 | 4 | |||||
| Total | 185 | 201 | 19 | 30 | 38 | 46 | 19 | 20 | 29 |
Table 57: Number of fatalities in fatal dwelling fires, year ending March 2017
| Fatalities | Fatal fires | Victims | C1 | C2 | C3 | C4 | C5 | C6 | C7 |
|---|---|---|---|---|---|---|---|---|---|
| 1 | 172 | 172 | 17 | 25 | 31 | 36 | 15 | 19 | 29 |
| 2 | 10 | 20 | 2 | 2 | 7 | 7 | 2 | ||
| 3 | 3 | 9 | 3 | 3 | 2 | 1 | |||
| Total | 185 | 201 | 19 | 30 | 38 | 46 | 19 | 20 | 29 |
Table 58: Victim age in fatal dwelling fires, year ending March 2017
| Age | Victims | C1 | C2 | C3 | C4 | C5 | C6 | C7 |
|---|---|---|---|---|---|---|---|---|
| Under 40 | 20 | 1 | 2 | 5 | 6 | 4 | 2 | |
| 40 to 54 | 38 | 1 | 7 | 13 | 5 | 2 | 3 | 7 |
| 55 to 64 | 16 | 2 | 2 | 4 | 2 | 1 | 2 | 3 |
| 65 to 79 | 56 | 6 | 10 | 5 | 9 | 9 | 8 | 9 |
| 80 or over | 42 | 6 | 3 | 7 | 9 | 2 | 7 | 8 |
| Not stated | 29 | 3 | 6 | 4 | 15 | 1 | ||
| Total | 201 | 19 | 30 | 38 | 46 | 19 | 20 | 29 |
Table 59: Victim gender in fatal dwelling fires, year ending March 2017
| Gender | Victims | C1 | C2 | C3 | C4 | C5 | C6 | C7 |
|---|---|---|---|---|---|---|---|---|
| Female | 84 | 9 | 12 | 21 | 13 | 7 | 13 | 9 |
| Male | 115 | 9 | 17 | 17 | 33 | 12 | 7 | 20 |
| Not stated | 2 | 1 | 1 | |||||
| Total | 201 | 19 | 30 | 38 | 46 | 19 | 20 | 29 |
E.5 Fire discovery in fatal dwelling fires
Table 60: Victim activity at time of fire in fatal dwelling fires, the year ending March 2017
| Activity | Victims | C1 | C2 | C3 | C4 | C5 | C6 | C7 |
|---|---|---|---|---|---|---|---|---|
| Unknown | 46 | 4 | 8 | 5 | 7 | 7 | 5 | 10 |
| Sleeping | 37 | 6 | 11 | 5 | 6 | 4 | 5 | |
| Not stated | 36 | 5 | 2 | 3 | 24 | 1 | 1 | |
| Leisure activity | 22 | 1 | 5 | 2 | 1 | 1 | 7 | 5 |
| In bed – not asleep / not known if asleep | 21 | 4 | 2 | 5 | 6 | 1 | 1 | 2 |
| Suicide | 15 | 9 | 2 | 4 | ||||
| Other | 11 | 3 | 2 | 2 | 1 | 1 | 2 | |
| Victim unconscious – under influence | 7 | 5 | 1 | 1 | ||||
| Cooking | 6 | 2 | 2 | 2 | ||||
| Total | 201 | 19 | 30 | 38 | 46 | 19 | 20 | 29 |
Table 61: Person who discovered fatal dwelling fires, the year ending March 2017
| Person | Victims | C1 | C2 | C3 | C4 | C5 | C6 | C7 |
|---|---|---|---|---|---|---|---|---|
| Victim | 88 | 5 | 14 | 21 | 12 | 6 | 10 | 20 |
| Not stated | 37 | 8 | 1 | 5 | 19 | 2 | 1 | 1 |
| Other/Unknown | 31 | 2 | 5 | 5 | 4 | 5 | 6 | 4 |
| Neighbour | 15 | 1 | 1 | 2 | 8 | 1 | 2 | |
| Occupant | 15 | 2 | 2 | 3 | 1 | 5 | 1 | 1 |
| Passer by | 5 | 2 | 2 | 1 | ||||
| Visitor | 5 | 3 | 1 | 1 | ||||
| Emergency service / other agencies | 5 | 1 | 4 | |||||
| Total | 201 | 19 | 30 | 38 | 46 | 19 | 20 | 29 |
Table 62: First responder other than victim in fatal dwelling fires, the year ending March 2017
| First responder | Victims |
|---|---|
| Neighbour | 74 |
| Occupant | 40 |
| Visitor | 25 |
| Not stated | 18 |
| Passer by | 15 |
| Other/Unknown | 12 |
| Not applicable | 10 |
| Automatic mechanism | 7 |
| Total | 201 |
Table 63: Action of first responder other than victim in fatal dwelling fires, year ending March 2017
| Action | Number |
|---|---|
| Raising alarm (dial 999) | 67 |
| Investigate the incident | 36 |
| Not applicable | 15 |
| Attempt rescue | 15 |
| Not stated | 13 |
| Raising alarm (other) | 13 |
| Attempt to alert victim | 11 |
| Attempt to escape | 11 |
| Attempt to tackle fire | 11 |
| No action taken | 6 |
| Other/Unknown | 3 |
| Total | 201 |
E.6 Smoke detection in fatal dwelling fires
Table 64: Number of smoke alarms in property in fatal dwelling fires, year ending March 2017
| Smoke alarms | Fatal fires | Victims | C1 | C2 | C3 | C4 | C5 | C6 | C7 |
|---|---|---|---|---|---|---|---|---|---|
| 0 | 41 | 45 | 3 | 17 | 12 | 4 | 2 | 7 | |
| 1 | 47 | 51 | 3 | 10 | 4 | 8 | 6 | 9 | 11 |
| 2 | 30 | 32 | 4 | 3 | 6 | 5 | 1 | 5 | 8 |
| 3 | 4 | 4 | 1 | 1 | 1 | 1 | |||
| Not stated | 58 | 63 | 11 | 11 | 9 | 21 | 8 | 2 | 1 |
| Unknown | 5 | 6 | 2 | 2 | 1 | 1 | |||
| Total | 185 | 201 | 19 | 30 | 38 | 46 | 19 | 20 | 29 |
Table 65: Location of alarm closest to fire in fatal dwelling fires, year ending March 2017
| Smoke alarm location | Fatal fires | Victims | C1 | C2 | C3 | C4 | C5 | C6 | C7 |
|---|---|---|---|---|---|---|---|---|---|
| Different floor to origin of fire | 11 | 12 | 1 | 2 | 4 | 1 | 1 | 3 | |
| Not applicable | 50 | 54 | 2 | 3 | 19 | 17 | 4 | 2 | 7 |
| Not stated | 46 | 49 | 10 | 8 | 9 | 13 | 8 | 1 | |
| Same floor as origin of fire | 57 | 61 | 5 | 12 | 3 | 11 | 5 | 11 | 14 |
| Same room as origin of fire | 15 | 17 | 1 | 5 | 2 | 1 | 5 | 3 | |
| Unknown | 6 | 8 | 5 | 1 | 1 | 1 | |||
| Total | 185 | 201 | 19 | 30 | 38 | 46 | 19 | 20 | 29 |
Table 66: Status of at least one of the smoke alarms in the property in fatal dwelling fires, year ending March 2017
| Smoke alarm status | Fatal fires | Victims | C1 | C2 | C3 | C4 | C5 | C6 | C7 |
|---|---|---|---|---|---|---|---|---|---|
| Not applicable | 37 | 40 | 3 | 15 | 11 | 3 | 1 | 7 | |
| Not stated | 24 | 25 | 5 | 5 | 10 | 5 | |||
| Operated – did not raise the alarm | 13 | 15 | 1 | 7 | 3 | 1 | 1 | 2 | |
| Operated – raised the alarm | 44 | 46 | 17 | 5 | 3 | 2 | 3 | 5 | 11 |
| Present – no battery | 11 | 15 | 2 | 3 | 3 | 5 | 1 | 1 | |
| Present – not sure if operational | 37 | 39 | 1 | 6 | 7 | 14 | 1 | 7 | 3 |
| Present but not working | 9 | 9 | 1 | 1 | 3 | 4 | |||
| Unknown | 10 | 12 | 1 | 2 | 5 | 1 | 2 | 1 | |
| Total | 185 | 201 | 19 | 30 | 38 | 46 | 19 | 20 | 29 |
Table 67: Reason why smoke alarm did not work as intended where stated, year ending March 2017
| Reason for smoke alarm not working | Victims | C1 | C2 | C3 | C4 | C5 | C6 | C7 |
|---|---|---|---|---|---|---|---|---|
| Victim impaired (by other means than drunk) | 0 | 0 | 0 | 0 | 0 | 0 | 0 | 0 |
| Victim already deceased | 0 | 0 | 0 | 0 | 0 | 0 | 0 | 0 |
| Victim too far / Could not hear alarm | 0 | 0 | 0 | 0 | 0 | 0 | 0 | 0 |
| Victim deaf | 0 | 0 | 0 | 0 | 0 | 0 | 0 | 0 |
| Victim asleep | 7 | 0 | 6 | 1 | 0 | 0 | 0 | 1 |
| Victim drunk | 7 | 0 | 4 | 0 | 1 | 1 | 0 | 1 |
| Victim/persons did not react to alarm / Alarm location | 11 | 0 | 2 | 1 | 1 | 1 | 1 | 5 |
| Victim could not escape | 13 | 3 | 3 | 0 | 0 | 2 | 1 | 4 |
| Total | 38 | 3 | 15 | 2 | 2 | 4 | 2 | 11 |
E.7 Victim response and escape in fatal dwelling fires
Table 68: Victim’s initial response to fire in fatal dwelling fires, year ending March 2017
| Initial response | Victims | C1 | C2 | C3 | C4 | C5 | C6 | C7 |
|---|---|---|---|---|---|---|---|---|
| Not stated | 50 | 14 | 2 | 2 | 26 | 3 | 2 | 1 |
| Unknown | 44 | 3 | 7 | 5 | 6 | 10 | 8 | 5 |
| No action (asleep/unconscious) | 25 | 8 | 7 | 3 | 1 | 1 | 5 | |
| Attempt to escape | 21 | 1 | 5 | 9 | 1 | 1 | 1 | 3 |
| Other | 16 | 3 | 2 | 5 | 2 | 4 | ||
| No action (suicide) | 15 | 1 | 8 | 2 | 4 | |||
| No action (no reason given) | 12 | 3 | 3 | 2 | 2 | 2 | ||
| Shout out for help | 9 | 1 | 1 | 1 | 1 | 2 | 3 | |
| No action (due to being immobile/ impaired) | 9 | 1 | 4 | 4 | ||||
| Total | 201 | 19 | 30 | 38 | 46 | 19 | 20 | 29 |
Table 69: Victim’s escape behaviour in fatal dwelling fires, year ending March 2017
| Escape behaviour | Victims | C1 | C2 | C3 | C4 | C5 | C6 | C7 |
|---|---|---|---|---|---|---|---|---|
| Delayed escape – asleep/ unconscious | 12 | 5 | 5 | 1 | 1 | |||
| Immediate escape attempted | 15 | 2 | 2 | 2 | 2 | 1 | 2 | 4 |
| No action (asleep/unconscious) | 13 | 3 | 4 | 1 | 1 | 2 | 2 | |
| No action (due to being immobile/impaired) | 14 | 3 | 1 | 4 | 6 | |||
| No action (no reason given) | 8 | 1 | 2 | 3 | 1 | 1 | ||
| No action (suicide) | 16 | 1 | 9 | 2 | 4 | |||
| No action (victim on fire) | 10 | 1 | 1 | 1 | 1 | 2 | 3 | 1 |
| Not stated | 52 | 13 | 3 | 2 | 28 | 4 | 1 | 1 |
| Other | 10 | 3 | 2 | 3 | 1 | 1 | ||
| Re-entering building or room of origin | 5 | 1 | 1 | 1 | 2 | |||
| Unknown | 46 | 2 | 9 | 6 | 5 | 10 | 7 | 7 |
| Total | 201 | 19 | 30 | 38 | 46 | 19 | 20 | 29 |
Table 70: Location victim died in fatal dwelling fires, year ending March 2017
| Location | Victims | C1 | C2 | C3 | C4 | C5 | C6 | C7 |
|---|---|---|---|---|---|---|---|---|
| Not stated | 10 | 3 | 5 | 1 | 1 | |||
| Outside room of origin | 102 | 10 | 10 | 14 | 29 | 16 | 7 | 16 |
| Room of origin | 83 | 6 | 19 | 20 | 12 | 2 | 12 | 12 |
| Unknown | 6 | 1 | 4 | 1 | ||||
| Total | 201 | 19 | 30 | 38 | 46 | 19 | 20 | 29 |
Table 71: Reason for location of victim in fatal dwelling fires by location found, year ending March 2017
| Reason | Not stated | Outside room of origin | Room of origin | Unknown | Total |
|---|---|---|---|---|---|
| Could not escape room of origin due to impairment | 19 | 19 | |||
| Other | 3 | 2 | 5 | ||
| Fire was between victim and means of escape | 6 | 2 | 8 | ||
| Fire/smoke spread rapidly | 8 | 8 | |||
| Fire/smoke spread to room other than origin | 21 | 21 | |||
| Not stated | 10 | 14 | 24 | ||
| Overcome by heat/smoke when trying to escape | 9 | 9 | |||
| Suicide/Arson | 10 | 10 | |||
| Unaware of fire | 5 | 5 | |||
| Unknown | 17 | 12 | 6 | 35 | |
| Victim on fire | 5 | 11 | 16 | ||
| Victim died in ambulance/hospital | 41 | 41 | |||
| Total | 10 | 102 | 83 | 6 | 201 |
Table 72: Reason for location of victim in fatal dwelling fires by cluster, year ending March 2017
| Reason for location | Victims | C1 | C2 | C3 | C4 | C5 | C6 | C7 |
|---|---|---|---|---|---|---|---|---|
| Could not escape room of origin due to impairment | 19 | 1 | 3 | 4 | 3 | 5 | 3 | |
| Fire was between victim and means of escape | 8 | 3 | 2 | 1 | 2 | |||
| Fire/smoke spread rapidly | 8 | 3 | 2 | 1 | 2 | |||
| Fire/smoke spread to room other than origin | 21 | 1 | 3 | 6 | 4 | 3 | 4 | |
| Not stated | 24 | 6 | 2 | 2 | 12 | 1 | 1 | |
| Other | 5 | 2 | 1 | 1 | 1 | |||
| Overcome by heat/smoke when trying to escape | 9 | 2 | 1 | 2 | 2 | 1 | 1 | |
| Suicide/Arson | 10 | 1 | 5 | 2 | 2 | |||
| Unaware of fire | 5 | 1 | 1 | 3 | ||||
| Unknown | 35 | 4 | 8 | 8 | 6 | 5 | 2 | 2 |
| Victim on fire | 16 | 2 | 5 | 1 | 4 | 4 | ||
| Victim died in ambulance/hospital | 41 | 7 | 2 | 15 | 4 | 5 | 8 | |
| Total | 201 | 19 | 30 | 38 | 46 | 19 | 20 | 29 |
E.8 Impacts on impairments on outcome of fire in fatal dwelling fires
Table 73: Overall victim impairment where recorded in fatal dwelling fires, year ending March 2017
| Impairment | Victims | C1 | C2 | C3 | C4 | C5 | C6 | C7 |
|---|---|---|---|---|---|---|---|---|
| Overall | 123 | 15 | 10 | 33 | 13 | 7 | 19 | 26 |
| No impairment | 21 | 3 | 2 | 2 | 11 | 3 | ||
| Mental | 56 | 8 | 3 | 18 | 2 | 4 | 5 | 16 |
| Physical | 76 | 11 | 5 | 13 | 7 | 3 | 15 | 22 |
| Substance use | 42 | 6 | 5 | 9 | 6 | 4 | 5 | 7 |
Table 74: Combined overall impairments in fatal dwelling fires, year ending March 2017
| Impairment | Victims |
|---|---|
| Unknown | 2 |
| Substance only | 15 |
| Physical only | 43 |
| Physical and substance | 7 |
| Mental only | 20 |
| Mental and substance | 10 |
| Mental and physical | 16 |
| Mental, physical, and substance | 10 |
Table 75: Presence of specific impairments and if contributed to fire in fatal dwelling fires, year ending March 2017
| Impairment | Not present | Not stated | Present and contributed | Present but did not contribute | Present but contribution unknown |
|---|---|---|---|---|---|
| SUBSTANCE | |||||
| Alcohol | 40 | 105 | 18 | 4 | 34 |
| Prescribed drugs | 24 | 135 | 2 | 5 | 35 |
| Illicit drugs – Class A | 65 | 126 | 3 | 1 | 6 |
| Illicit drugs – Class B | 63 | 129 | 0 | 1 | 8 |
| Illicit drugs – Class C | 67 | 129 | 0 | 1 | 4 |
| Illicit drugs – not specified in report which drug/classification | 66 | 128 | 0 | 1 | 6 |
| PHYSICAL | |||||
| Mobility (not age-related) | 49 | 123 | 10 | 2 | 17 |
| Age-related physical impairment | 50 | 106 | 26 | 0 | 19 |
| Bed ridden | 115 | 74 | 7 | 0 | 5 |
| Eyesight | 44 | 146 | 3 | 0 | 8 |
| Hearing | 47 | 149 | 0 | 0 | 5 |
| Wheelchair/mobility chair user | 66 | 114 | 10 | 0 | 11 |
| Oxygen dependency | 76 | 121 | 0 | 0 | 4 |
| MENTAL | |||||
| Depression | 40 | 145 | 8 | 0 | 8 |
| Dementia | 46 | 141 | 6 | 0 | 8 |
| Other mental illness (excluding dementia, depression & hoarding) | 35 | 129 | 13 | 2 | 22 |
Table 76: Specific impairments listed as present and contributed in fatal dwelling fires by cluster, year ending March 2017
| Impairment | Victims | C1 | C2 | C3 | C4 | C5 | C6 | C7 |
|---|---|---|---|---|---|---|---|---|
| SUBSTANCE | ||||||||
| Alcohol | 18 | 1 | 6 | 3 | 3 | 1 | 2 | 2 |
| Prescribed drugs | 2 | 1 | 0 | 0 | 0 | 0 | 1 | 0 |
| Illicit drugs – Class A | 3 | 0 | 1 | 1 | 1 | 0 | 0 | 0 |
| Illicit drugs – Class B | 0 | 0 | 0 | 0 | 0 | 0 | 0 | 0 |
| Illicit drugs – Class C | 0 | 0 | 0 | 0 | 0 | 0 | 0 | 0 |
| Illicit drugs – not specified in report which drug/classification | 0 | 0 | 0 | 0 | 0 | 0 | 0 | 0 |
| PHYSICAL | ||||||||
| Mobility (not age-related) | 10 | 1 | 1 | 2 | 0 | 0 | 3 | 3 |
| Age-related physical impairment | 26 | 2 | 2 | 3 | 2 | 0 | 11 | 6 |
| Bed ridden | 7 | 1 | 0 | 2 | 1 | 0 | 2 | 1 |
| Eyesight | 3 | 0 | 0 | 0 | 0 | 0 | 2 | 1 |
| Hearing | 0 | 0 | 0 | 0 | 0 | 0 | 0 | 0 |
| Wheelchair/mobility chair user | 10 | 2 | 1 | 0 | 0 | 0 | 4 | 3 |
| Oxygen dependency | 0 | 0 | 0 | 0 | 0 | 0 | 0 | 0 |
| MENTAL | ||||||||
| Depression | 8 | 0 | 0 | 4 | 0 | 0 | 1 | 3 |
| Dementia | 6 | 1 | 0 | 0 | 0 | 0 | 3 | 2 |
| Other mental illness (excluding dementia, depression & hoarding) | 13 | 1 | 0 | 11 | 0 | 1 | 0 | 0 |
Table 77: Victims for whom their response was likely affected by their impairment in fatal dwelling fires, year ending March 2017
| Response affected by impairment | Victims |
|---|---|
| No | 4 |
| Not applicable (no impairment) | 21 |
| Not stated | 64 |
| Unknown | 11 |
| Yes | 101 |
| Total | 201 |
Table 78: Victims for whom their impairment contributed to start or outcome of fatal dwelling fires, year ending March 2017
| Impairment contributed | Victims |
|---|---|
| No – has impairment but did not contribute | 8 |
| Not applicable | 26 |
| Not stated | 76 |
| Unknown | 20 |
| Yes – had impairment and it did contribute | 71 |
| Total | 201 |
E.9 Unsafe fire behaviours in fatal dwelling fires
Table 79: Fatal dwelling fires caused by human behaviour, year ending March 2017
| Due to human behaviour | Fatal fires | Victims | C1 | C2 | C3 | C4 | C5 | C6 | C7 |
|---|---|---|---|---|---|---|---|---|---|
| No | 11 | 11 | 1 | 1 | 1 | 4 | 1 | 1 | 2 |
| Not stated | 17 | 20 | 3 | 2 | 15 | ||||
| Unknown | 12 | 14 | 2 | 1 | 4 | 2 | 2 | 3 | |
| Yes | 145 | 156 | 13 | 26 | 33 | 25 | 18 | 17 | 24 |
| Total | 185 | 201 | 19 | 30 | 38 | 46 | 19 | 20 | 29 |
Table 80: Fatal dwelling fires where there was evidence of overcrowding, year ending March 2017
| Evidence | Fatal fires | Victims | C1 | C2 | C3 | C4 | C5 | C6 | C7 |
|---|---|---|---|---|---|---|---|---|---|
| No overcrowding | 155 | 164 | 15 | 29 | 29 | 24 | 18 | 20 | 29 |
| Not stated | 24 | 29 | 3 | 7 | 19 | ||||
| Yes | 6 | 8 | 1 | 1 | 2 | 3 | 1 | ||
| Total | 185 | 201 | 19 | 30 | 38 | 46 | 19 | 20 | 29 |
Table 81: Evidence of inappropriate or misguided fire behaviours in fatal dwelling fires, year ending March 2017
| Behaviours | Victims | C1 | C2 | C3 | C4 | C5 | C6 | C7 |
|---|---|---|---|---|---|---|---|---|
| Smoking | 110 | 13 | 16 | 23 | 15 | 16 | 12 | 15 |
| Cigarettes discarded, burns on furniture | 56 | 7 | 14 | 8 | 2 | 5 | 8 | 12 |
| Many candles/incense | 27 | 3 | 3 | 4 | 9 | 3 | 0 | 5 |
| Building poorly maintained | 14 | 2 | 1 | 3 | 4 | 1 | 2 | 1 |
| Careless or risky use of materials that may cause fire | 79 | 12 | 19 | 11 | 12 | 5 | 12 | 8 |
| Falling asleep while smoking | 20 | 1 | 6 | 4 | 1 | 1 | 5 | 2 |
| Leaving fires or ignited stoves unattended | 10 | 2 | 1 | 2 | 1 | 0 | 1 | 3 |
| Personal neglect | 16 | 1 | 2 | 6 | 2 | 2 | 2 | 1 |
| Misuse of electrical appliances | 14 | 0 | 4 | 2 | 2 | 2 | 2 | 2 |
| Placing clothing too near heat source | 13 | 1 | 0 | 2 | 3 | 2 | 4 | 1 |
| Hoarding and/or poor housekeeping | 46 | 5 | 4 | 12 | 9 | 5 | 3 | 8 |
| Furniture too close to heat | 21 | 3 | 5 | 3 | 6 | 1 | 2 | 1 |
| Other | 6 | 0 | 1 | 3 | 0 | 1 | 1 | 0 |
E.10 History of contact with agencies
Table 82: Prior history of victim with other agencies in fatal dwelling fires, year ending March 2017
| Other agency contact | Victims | C1 | C2 | C3 | C4 | C5 | C6 | C7 |
|---|---|---|---|---|---|---|---|---|
| Already in care environment | 56 | 10 | 6 | 12 | 1 | 1 | 14 | 12 |
| Contact with agencies other than FRS | 36 | 2 | 1 | 18 | 2 | 4 | 1 | 8 |
| No prior contact | 19 | 6 | 1 | 6 | 4 | 2 | ||
| Not stated | 88 | 6 | 17 | 7 | 43 | 8 | 1 | 6 |
| Unknown | 2 | 1 | 1 | |||||
| Total | 201 | 19 | 30 | 38 | 46 | 19 | 20 | 29 |
Table 83: Other agencies with previous contact in fatal dwelling fires, year ending March 2017
| Agencies | Victims | C1 | C2 | C3 | C4 | C5 | C6 | C7 |
|---|---|---|---|---|---|---|---|---|
| Health services | 5 | 3 | 1 | 1 | ||||
| Mental health / addiction agencies | 20 | 1 | 11 | 1 | 2 | 2 | 3 | |
| Multiple agencies | 2 | 1 | 1 | |||||
| Not applicable | 140 | 14 | 23 | 12 | 43 | 14 | 16 | 18 |
| Other | 4 | 1 | 1 | 2 | ||||
| Police | 5 | 1 | 4 | |||||
| Social services/carers or care agency/telecare | 25 | 2 | 6 | 6 | 3 | 2 | 6 | |
| Total | 201 | 19 | 30 | 38 | 46 | 19 | 20 | 29 |
Table 84: Victims who had had previous contact with community fire safety in fatal dwelling fires, year ending March 2017
| Community fire safety | Victims | C1 | C2 | C3 | C4 | C5 | C6 | C7 |
|---|---|---|---|---|---|---|---|---|
| No | 71 | 2 | 7 | 14 | 7 | 13 | 11 | 17 |
| Not stated | 104 | 13 | 22 | 21 | 35 | 5 | 4 | 4 |
| Unknown | 7 | 1 | 1 | 5 | ||||
| Yes | 19 | 4 | 3 | 3 | 1 | 5 | 3 | |
| Total | 201 | 19 | 30 | 38 | 46 | 19 | 20 | 29 |
Table 85: Previous FRS contact in fatal dwelling fires, year ending March 2017
| FRS contact | Victims | C1 | C2 | C3 | C4 | C5 | C6 | C7 |
|---|---|---|---|---|---|---|---|---|
| FRS came to the building for another resident | 15 | 5 | 4 | 2 | 1 | 3 | ||
| FRS had fitted an alarm | 6 | 1 | 1 | 1 | 1 | 2 | ||
| Home fire safety check | 26 | 8 | 1 | 4 | 2 | 6 | 5 | |
| No FRS contact | 66 | 4 | 2 | 15 | 8 | 13 | 10 | 14 |
| Not stated | 84 | 6 | 20 | 14 | 33 | 5 | 2 | 4 |
| Unknown | 4 | 1 | 1 | 1 | 1 | |||
| Total | 201 | 19 | 30 | 38 | 46 | 19 | 20 | 29 |
E.11 Suicide, arson and accidental self-immolation
Table 86: Suicide by fire, year ending March 2017
| Suicide | Victims |
|---|---|
| Suicide – accelerant not used | 5 |
| Suicide – accelerant used | 11 |
| Total | 16 |
Table 87: Gender of fire-related suicides, year ending March 2017
| Gender | Victims |
|---|---|
| Female | 5 |
| Male | 11 |
| Total | 16 |
Table 88: Age of fire-related suicides, year ending March 2017
| Age | Victims |
|---|---|
| 25 to 54 | 7 |
| 55 to over | 5 |
| Not stated | 4 |
| Total | 16 |
Table 89: Fires where victim accidentally set themselves on fire, year ending March 2017
| Accidental self-immolation | Fatal fires |
|---|---|
| No | 56 |
| Not collected | 85 |
| Not stated | 17 |
| Unknown | 6 |
| Yes | 21 |
| Total | 185 |
Table 90: Cause of fire where victim accidentally set themselves on fire, year ending March 2017
| Cause | Fatal fires |
|---|---|
| Careless use of heat emitting electrical items | 3 |
| Chip pan / Cooking | 2 |
| Naked flame / Open fire / Log burner | 4 |
| Smoker’s materials | 9 |
| Suicide | 2 |
| Unknown | 1 |
| Total | 21 |