Public Health England publishes latest statistics on NHS Health Check
Public Health England has today published the latest data on NHS Health Check.

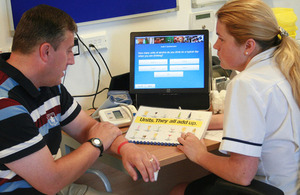
Man receiving a health check
This is the first data release since responsibility for the programme moved from primary care trusts to local authorities in April 2013 and covers activity in April, May and June 2013.
Data released today (4 September 2013) found 598,876 NHS Health Checks were offered in the first quarter of 2013 to 2014 and a total of 286,717 people received an NHS Health Check in the same period. Across England, average uptake was 47.9%. This compares with an average of 47.5% for the first quarter of 2012 to 2013.
The range of the percentage of appointments offered and received from April to June 2013 is shown in table 1. This includes the 5 local authorities where 0 offers were recorded and 4 local authorities where 0 appointments received were recorded.
Professor Kevin Fenton, Director of Health and Wellbeing for Public Health England (PHE) said:
This is a promising start and it is very encouraging that there has been no loss of ground during transition. However, there is still much work to do and the challenge is to now move faster and further, making sure programmes are accessible and uptake is increased. There is a huge burden of disease associated with conditions that can be avoided by modifying our behaviour and lifestyles and taking early action; this is what the NHS Health Check programme aims to do, why it’s a priority and why PHE has a 10 point action plan of support.
Publishing information about offers and take up helps local authorities to commission effective programmes and help people locally to see the position in their area. These statistics show local programmes have held steady over the handover period from the former primary care trusts to local government.
Table 1. Range of NHS Health Checks offered and received as recorded by PHE for April to June 2013
| Appointments offered 2013 to 2014 (percentage) | Appointments received 2013 to 2014 (percentage) | Of offered, percentage received | |
|---|---|---|---|
| Minimum | 0.0 | 0.0 | 0.0 |
| Median | 4.2 | 2.0 | 46.6 |
| Maximum | 14.5 | 9.2 | 100.0 |
Source: PHE 2013 to 2014
People can find the latest data on their council’s programme through a new, easy to use interactive map on the NHS Health Check website including:
-
number of people eligible for the programme
-
number of NHS Health checks offered
-
number of NHS Health Checks taken up
-
percentage of people who have taken up the offer
Nationally, there are 15,323,148 people aged 40 to 74 who should be offered an NHS Health Check once every 5 years.
Ends
Notes to Editors
-
The statistics are based on returns from 152 upper tier and unitary authorities. Returns from 4 local authorities recorded no offers or NHS Health Checks received and one local authority recorded only checks received. PHE is working closely with these local authorities to understand their reasons for reporting no activity.
-
Local authorities and Public Health England took on responsibility for the implementation of the NHS Health Check programme in April 2013. The commissioning and monitoring of the risk assessment element of the NHS Health Check is a mandatory public health function for local authorities. Requirements are set out in The Local Authorities Public Health Functions and Entry to Premises by Local Healthwatch Representatives Regulations 2013. Local authorities are required to report summary detail about offers and take up to Public Health England to support commissioning, for data transparency and to ensure data is accessible to local people. Quarter two data (July to September 2013) will be published in November.
-
The percentage of offers made and take up of NHS Health Check by the eligible population within the financial year are indicators in the Public Health Outcome Framework (indicators 2.22i and 2.22ii). These indicators are updated annually. The next planned update for these indicators is May 2014.
-
Previous statistics on NHS Health Check were generated by primary care trusts and reflect former PCT boundaries. These do not always match to current local authority boundaries. Trend data, therefore, is presented at England level only.
-
Public Health England’s mission is to protect and improve the nation’s health and to address inequalities through working with national and local government, the NHS, industry and the voluntary and community sector. PHE is an operationally autonomous executive agency of the Department of Health.
www.gov.uk/phe Follow us on Twitter @PHE_uk
Press office
Email ukhsa-pressoffice@ukhsa.gov.uk
Contact form https://www.gov.uk/gov...
National press office 020 7654 8400
Chemicals, radiation and environmental hazards press office 01235 825 405/406
Out of hours 020 8200 4400
Only for use by journalists and the media