Part three: Five things you didn't know about...
Our third selection of posts from across the Analysis Function, each sharing five facts about a topic or project

As part of Analysis in Government month, this is the third in our series of ‘Five things you didn’t know about…’ blog posts. Analysis in government is being used more than ever in policy, decision making and the media, this series of blog posts will share, showcase and celebrate the vast variety of professions and work within the Analysis Function.
Jump to one of our posts:
- Five things you didn’t know about how we make data understandable
- Five things you didn’t know about evaluation
- Five things you didn’t know about actuaries
- Five things you didn’t know about the data masterclass
- Five policy areas where ADR UK is having an impact
Five things you didn’t know about how we make data understandable

By Catherine Hope, Department for Work and Pensions (DWP)
I’ve been passionate about presenting data clearly for over 10 years now, and recently took the lead of a cross-government group of presentation champions. We share best practice for designing charts and tables, and we’re learning about writing for the web to help everyone understand the huge amount of data that government publishes.
In this role and in my day job as a statistician for DWP Digital, I tell stories with data.
Sometimes these stories help teams to make decisions about whether a change they made to a process has worked, or if they need to try something else. Or sometimes the stories make government data available to the public in an easy-to-understand way.
In all cases, the most important thing is to write for everyone, and to tell the story in a way that readers understand. With that in mind, I’ve pulled together some ways in which we present data to try and make it as understandable, open and accessible as possible.
1. We think about our users
It’s really easy to write something or present data in a way that you understand. The problem is, you have a lot of baggage: your subject knowledge of the thing you’re presenting, its historical context, your technical knowledge of the way you did the analysis, and what conclusions can be made from the analysis.
It would be very unusual for everyone seeing your data presentation to have exactly the same knowledge as you. Otherwise, what would be the benefit of sharing that knowledge with them?
It’s essential to think about who your audience is going to be, and to write for them. If you don’t know who your audience is going to be, like when I present government data for the public, you can’t make any assumptions about what they already know.
2. We keep it simple
The use of plain English will make your analysis easier to understand for everyone - even those as steeped in jargon as you are. Nobody ever read a simple sentence and thought “well, that was too easy to understand.”
Jargon and acronyms, which are often used in government, can alienate people. You might be presenting your work to a team you know really well and assume everyone knows what HRTs and JBCs are (habitual residence test and the Joint Biosecurity Centre, if you were wondering). However, if one member of the team is new to the role, you risk making them feel excluded because they cannot keep up.
Explain your acronyms and give a bit of context about the subject. This is the case with technical concepts and language too. When I analyse whether a change to a process has made a difference, I use statistical tests to see whether that change might have happened by chance, or whether it was a “significant” change. When I present the results to the team, I will always talk about what the test means and what conclusions we can or can’t make.
3. We tell the story
I’m steeped in the detail of the things I present analysis about, but my audience might not be. I try to tell the story and give enough context so that people can understand why the data I’m showing them is important.
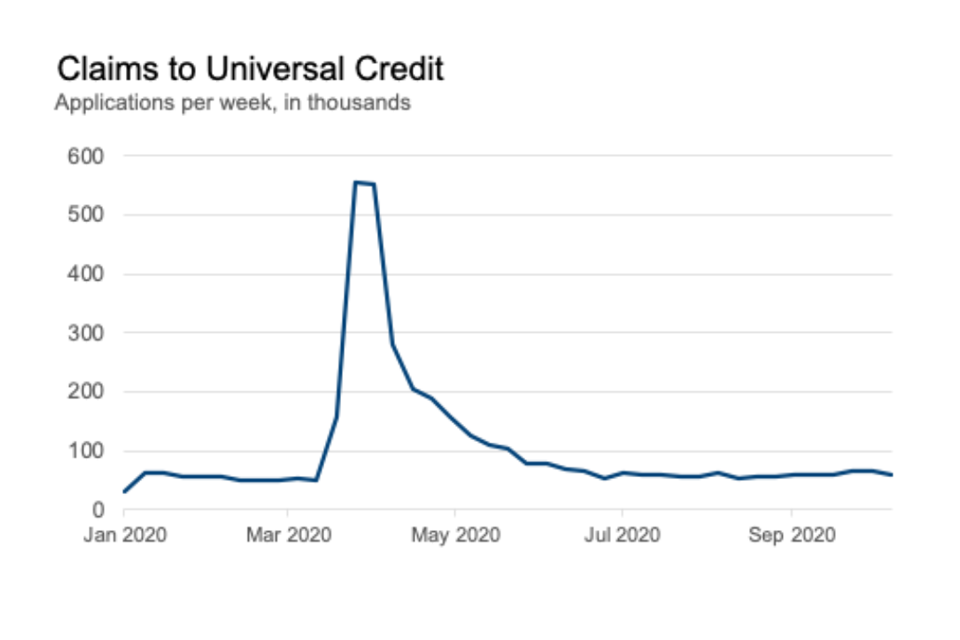
Simple annotations can really help this. Below are two charts I made from data about the social security benefit Universal Credit (UC). It is a payment to help with your living costs. You may be able to get it if you’re on a low income, out of work or you cannot work.
A line chart showing claims in universal credit over time, with a sharp peak in March
The title of this chart tells you what the chart shows: the number of claims to UC. It shows a massive peak during the year, and that the number has gone back down again. But it doesn’t say what caused that peak.
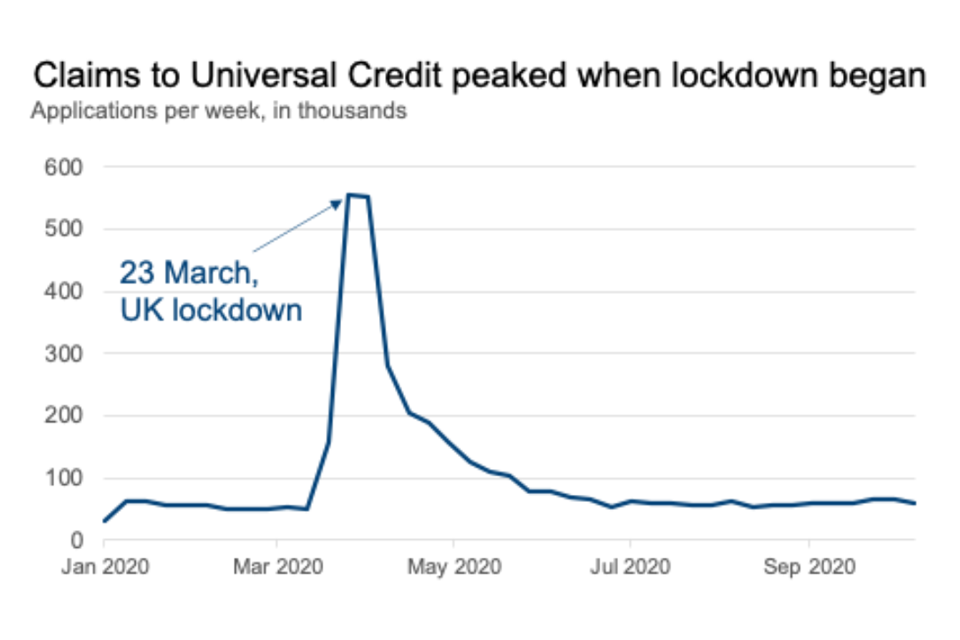
A line chart showing claims in universal credit over time, with a sharp peak in March, with an annotation
Simply by adding an “active title” to the second chart, I’m explaining more: that claims to UC peaked when lockdown began. I’ve also added an annotation directly onto the chart to point out where 23 March is - I’ve not assumed that you know when the lockdown happened in the UK.
Doing this helps people to think “oh, I see” and it helps me to know that they’ve understood from the chart what I wanted them to. I’ve told my story.
4. We include everyone
Accessibility isn’t (just) a legal box to tick, it helps us make sure that everyone can use government statistics and data, regardless of the technology they use. This is for everybody.
Making data easy to understand is only one of the ways of making it accessible: information published on the internet needs to meet all of the Web Content Accessibility (WCAG) Guidelines.
In the cross-government group of presentation champions that I lead, we’ve been focusing on how to make government statistics meet these guidelines. WCAG asks that content should be:
- perceivable: having captions on video/audio, and contrasting colours that can be seen by people with colour-blindness
- operable: can be navigated by people who use only a keyboard not a mouse, or use screen-readers
- understandable: using plain English, or identifying errors and helping people correct them if a website needs input from you, like applying for UC
- robust: being compatible with assistive technologies, and using mark-up correctly
The GOV.UK platform does a lot of the technical side of this for us, which is why we have focused on the way we present charts and use words to describe what’s happening.
The presentation champions carry out reviews of government publications and offer advice to the authors about meeting best practice in how we design charts and the words we use. While similar to user research, where researchers would talk to people who use the statistics, but it can help to get an “outsider’s” perspective - to take a step back from the detail.
5. We help people make decisions
Data has taken much more of the limelight this year than before. Charts were being shown on the television on a daily basis during the early phase of the coronavirus COVID-19 pandemic.
People need access to information like this in an easy-to-understand way, because they are making decisions about how safe it is to leave the house. This may sound overly dramatic, but these could be life and death decisions for some people. It is our duty to make sure they can make well-informed decisions.
If you’d like to learn more about presenting data, there are some resources that are free to use:
- Department for Work and Pensions Data Visualisation Thinking
- GSS guidance on Writing about Statistics guidance
- GSS Introduction to Data Visualisation guidance
Five things you didn’t know about evaluation

Written by Steven Finch, Department for Transport, Chair of Cross-Government Evaluation Group
There have been some important changes in government evaluation over the past year or so, with more to follow in the coming year. Here are five things that you may not know.
1. Last year’s Magenta Book was a substantial revision
The revised Magenta Book was launched at the height of the Covid-19 crisis on 1 April 2020, so you wouldn’t be a fool if you missed it!
You may not realise how substantial a revision this was, the product of a few years’ work by analysts in the Cross-Government Evaluation Group (CGEG), which comprises the evaluation leads in government departments. Among the changes reflected in the new guidance were:
Changes in government evaluation such as the experimentation agenda (eg ‘Test, Learn Adapt’ in 2012), the What Works Network and Trial Advice Panel.
The growth of new evaluation methods, notably theory-based impact evaluation methods which can complement or provide an alternative to experimental and quasi-experimental methods.
New thinking about evaluation in complex settings by the ESRC Centre for the Evaluation of Complexity Across the Nexus(CECAN).
2. It came with several new annexes
While the core Magenta Book document is more concise than its predecessor, it is accompanied by several new annexes which expand the guidance significantly.
There are new annexes covering Analytical Methods used in evaluation, Handling Complexity in Policy Evaluation (authored by CECAN), Guidance for Conducting Regulatory Post Implementation Reviews and Realist Evaluation.
Another important new element is a Government Analytical Evaluation Capabilities Framework which can be used by analysts as a tool for planning skills development and training.
3. It has been followed by a wave of capability-building activity
Across government, there is a concerted effort underway to build capabilities in evaluation.
CGEG, which aims to improve the supply of, stimulate demand for, and encourage the use of, good quality evaluation evidence in government, has recently undertaken a mapping of evaluations of COVID-19 response interventions, to facilitate joining up of evaluation approaches and evidence. Several of its members have been delivering evaluation training courses within their departments
A new entrant in this field is the Best Practice and Impact (BPI) division in the Office for National Statistics which is working for the Analysis Function to provide on-the-ground support in evaluation for parts of central government and devolved administrations where this is not available. CGEG is supporting the BPI to develop its offer and has enlisted its support with making the case to Civil Service Learning to include introductory training for analysts and policy makers in its curriculum.
4. Evaluation has been embedded in Spending Review processes
The Spending Review 2020 (SR20) saw a step change in the focus on evaluation in the context of spending decisions.
HM Treasury included new requirements for spending bids to state both:
- what evidence supported the case that funding would deliver its intended outcomes, where this was available
- what monitoring and evaluation plans were in place to demonstrate what outcomes would be achieved
These returns were scrutinized and feedback on evaluation plans was incorporated in departmental settlement letters. A subsequent Outcome Delivery Plan process has captured departmental evaluation plans for priority outcomes.
5. The Evaluation Task Force is here!
Announced the Chancellor’s SR20 policy paper, the Evaluation Task Force started work in April.
This new unit, which is based in the Cabinet Office and HM Treasury, aims to improve people’s lives by ensuring robust evidence on the effectiveness of policies and programmes sits at the heart of spending and operational decisions. It will do this by scrutinising evaluation plans in business cases submitted to HM Treasury and by working with departments to advise them on the design and delivery of robust, proportionate evaluation, in particular for priority programmes. It will also track the delivery of evaluations and their emerging results.
For all the reasons stated here, we can expect growing attention to government evaluation in the coming year. If you would like to know more, please contact:
- Cross-Government Evaluation Group: Steven.Finch@DfT.gov.uk
- Analysis Function evaluation support: Evaluation.Support@statistics.gov.uk
- Evaluation Task Force: Catherine.Hutchinson@CabinetOffice.gov.uk
Five things you didn’t know about actuaries

Written by Keith Gourlay from the Government Actuary’s Department
So, what are actuaries and what do they do? Fundamentally, actuaries are problem solvers and strategic thinkers who use mathematical skills to help measure the probability and risk of future events. Actuaries use these skills to predict the financial impact of these events on their clients.
Businesses and governments increasingly depend on the skills of actuaries to help them model and plan. But it’s not all about applying mathematical skills - actuaries also need to be strong communicators who are able to explain complicated technical issues in simple terms.
1. The actuarial profession is smaller than most
The actuarial profession in the UK is small but highly influential. In fact, there are only around 17,000 qualified and student actuaries in the UK. This contrasts with over 450,000 in the accountancy profession and more than 200,000 in the legal profession.
Traditionally actuaries have mainly worked in insurance, pensions and investment management. Increasingly though, actuaries are working in new areas where their analytical and communication skills can be usefully employed. These include wider risk management, data science and banking.
2. Training to be an actuary is tough
It takes a lot of hard work to fully qualify as an actuary. Most trainees have a good university degree in an analytical subject such as mathematics.
After that there are a significant number of professional exams to pass. These cover core subjects (such as mathematics of finance) and specialist areas (such as pensions or insurance).
Fortunately, most actuarial employers offer support including time off to study. Nonetheless it normally takes at least four years to pass all the exams and become a Fellow of the Institute and Faculty of Actuaries. It’s a lot of hard work and dedication but it’s definitely worth it!
The training does not stop with the exams. New actuaries have a lifetime of continuing professional development ahead of them. They must keep their technical skills up to date and acquire expertise in other areas such as client relationship management, leadership and communication. Have a look at the Government Actuary’s Department (GAD) blog site where we have a range of blogs from colleagues across GAD.
3. We provide actuarial advice to the public sector
Most actuaries work in the private sector but actuaries also work in government. GAD has a unique and important role close to the heart of government and provides actuarial analysis to support the public sector.
GAD has around 150 trainees and qualified actuaries. and provides analysis and advice in areas such as pensions and social security benefits as well as insurance and investments.
Our advice impacts many stakeholders. As an example, advice on public servicer pensions affects around 15 million current and former public service employees.
4. GAD’s work is as varied as government’s challenges
GAD actuaries apply their training and experience to provide advice on a wide range of interesting and important issues.

A recent project was to investigate and report on funding for disaster relief, looking at how disaster risk financing can meet as many humanitarian needs as possible.
In another assignment GAD participated in a cross-government project to set insurance requirements and provide risk analysis for the new UK spaceflight launch industry. Sign up to our upcoming Analysis in Government month webinar on 12 May to find out more about our work with the UK Space Agency.
5. Most actuaries find their job challenging and rewarding
Most actuaries value the intellectual challenge of the job and the influential nature of their role. Above all actuaries gain satisfaction from solving problems and helping to makes peoples’ lives better.
Actuaries say the work-life balance is excellent (well at least most of the time!) and job and financial security are good. An actuarial career is regularly rated highly in independent surveys. In the long run, the exams and training are worth it.
Find out more about the actuarial profession.
Find out more about GAD and the work it does.
Or you can email enquiries@gad.gov.uk for further information.
Visit Eventbrite for more details of Analysis in Government month webinars including GAD’s forthcoming webinar on 24 May.
Five things you didn’t know about the data masterclass for senior leaders

Written by James Kuht, Cabinet Office
1. There is a Data Science Team in 10 Downing Street, working on a number of projects, one of which is the Data Masterclass for Senior Leaders
Hello and welcome to another one of the ‘Five things’ blog series! I’m James Kuht, an Royal Air Force doctor on secondment to 10 Downing Street’s Data Science Team, ‘10DS’. And with that statement, I suspect we hit our first thing you perhaps didn’t know - that 10DS exists! We are a small team, based behind the famous black door, with the role of elevating the data and evidence agenda in the heart of government.
Our work mainly fits into two categories:
- firstly providing the Prime Minister and other Senior decision-makers with better data and evidence to inform their decisions
- secondly taking a more outward-looking approach to improve the use of data and evidence across government.
I work in the ‘Special Projects’ part of the team with the wonderful Jen Gold, which largely supports the second of these two aims, and one of my main projects has been the ‘Data masterclass for senior leaders’.
2. The ‘Data masterclass for senior leaders’ aims to equip leaders with the knowledge and skills to put data at the heart of their work
For those of you who haven’t heard of the data masterclass, let me give you a whistle-stop tour. It’s an unusually-accessible, exceptionally-engaging and deeply-vocational online course to help equip non-analyst senior leaders across government with the knowledge and skills they need to put data and evidence at the heart of their work.
Why? Well, it is no secret that central government wants to drive the data and evidence agenda, just take a look at the Rt Hon Michael Gove’s (CDL) Ditchley lecture - which includes quotes such as “Government needs to evaluate data more rigorously” and follows this section by asking “Government must also ask itself if its people have the skills necessary for the challenges that I have set out”.
Our hypothesis is that by centrally driving the data upskilling agenda at the most senior levels through building a data masterclass we can improve the use of data and evidence within government, and thereby deliver more effective public service.
3. We built the data masterclass in 64 days
Having proposed the idea to create a data masterclass for senior leaders to CDL and gained his endorsement late in September, I set about building a ‘dream-team’ of stakeholders from across Government - including the Analysis Function, the Behavioural Insight Team, Cabinet Office Visualisation team, the Data Science Campus, Government Digital Services and Government Statistical Services (GSS). We set-out a high-level vision, and defined the three main topic areas we wanted to cover:
- data-driven decision-making and policy-making
- communicating compelling narratives through data
- data science and new frontiers
We then set out assembling a world-class cast of speakers to deliver TED-style talks on these topics (such as Sir Ian Diamond, Dr Hannah Fry, Sir David Spiegelhalter and many more) and solicited ten brilliant case studies of exemplary use of data and evidence within Government that really brought these topics to life within the context of Government (our sincere thanks to the Analysis Function and DDAN network for help in sourcing these).
Then, 64 days (and a few late nights, admittedly!) later we had met our deadline with barely a moment to spare, and launched a pilot study of the data masterclass with Senior Civil Servants in the Foreign, Commonwealth and Development Office, Department for Business Energy and Industrial Strategy (BEIS) and the Department for Digital, Culture, Media and Sport.
4. The results of the Data Masterclass pilot were highly promising
All 200 spaces for the Data Masterclass were gone within a flash when we opened it up - so quickly in fact, that we had to buy more licenses immediately! Over the next 7 weeks, we were delighted to see 38% of those who enrolled complete the course - an outstanding completion rate when you consider that online learning course completion rates are usually in the region of 5-15%, and we were asking SCS to complete this over a period which included Christmas, the beginning of another lockdown, and Brexit!
The average rating of the Masterclass was 9.5/10, and we were delighted to receive such kind quotes as “leaps ahead of any other HMG online training I’ve done” (Sian MacLeod, HM Ambassador to Serbia) and “A really fabulous course […] you managed to bring what could have been quite a dry issue to life, and make it not too complicated for the data challenged” (Corin Robertson, HM Ambassador to Mexico)…. Though we’re sure some of you are reeling from the fact that someone could possibly have suggested that the subject matter could be dry though…!
But what of the impact? To refer back to my first paragraph, can we robustly say that we have ‘improved the use of data in government’? Not categorically, yet. But we are seeing some promising signs in the comments we’ve received so far. Take Sarah Redwood (Director Renewable Energy Deployment, BEIS) who said “I’ve already started using the learnings in my job - including rehauling some maps we are using in a presentation for the PM and asking lots of questions of the analysts I work with”. Or Harriet Cross (High Commissioner to Trinidad and Tobago) who, inspired by the Masterclass, organised a well-received 90-minute session on data-driven diplomacy at the Heads of Mission conference for the Americas last month. Or this quote, from an anonymous participant of the masterclass: “It sparked thinking on a host of new potential applications of data science […], and signposted the range of resources and teams across government that can help”.
5. We are now seeking to scale the data masterclass across government, we would love analysts across government to help facilitate this!
‘So what next?’ I hear you ask. Well, the wonderful team at the Data Science Campus (part of ONS) have now taken on the data masterclass, actioned a number of improvements from the pilot, and are seeking to scale the course across government later this year. All being well, it should be available to SCS (Senior Civil Servant) and potentially even Grade 6’s and 7’s in most departments and some parts of local government later in the year.
But to do this - we need your help!
In the pilot, SCS were extremely engaged in the course materials and left 8 comments each on average - many of which were absolutely fascinating. Analysts from the pilot departments benefited greatly from linking in with their SCS who were doing the course, both helping to develop their SCS’ ideas and learning, but also to build connections. If this sounds like you - and you could spare a couple of hours a week for 2 months to facilitate the Masterclass in your department, please do send an email to Data.Masterclass@ons.gov.uk who will log your interest!
If you’d like to learn more about the data masterclass you can watch James’s talk at the Institute for Government’s ‘Data Bites’ series, at 1:00:28. You can also follow James on Twitter @KuhtJames or on his blog; www.DrJK.co.uk.
Five policy areas where ADR UK is having an impact
Written by Emma Gordon, Administrative Data Research UK
Administrative data is an invaluable resource for public good. ADR UK (Administrative Data Research UK) is an Economic and Social Research Council (ESRC) programme transforming the way researchers access the UK’s existing wealth of public sector data, so that policy can be based upon the best evidence possible. ADR UK’s work spans a variety of UK and devolved government policy areas; here are five where our work is fast progressing.
1. Crime and justice
One of ADR UK’s flagship projects with huge potential for crime and justice policy impact is Data First: a major data linkage programme led by the Ministry of Justice (MoJ) which is linking existing data from across the justice system for the first time for research. The possibilities for improving justice system experiences – such as enabling people to access support quicker and more effectively, and avoiding the escalation of civil justice problems into the criminal courts – are vast.
The £3 million ADR UK investment in Data First has already been making waves. It featured in the 2020 National Data Strategy and the UK Research and Development Roadmap, and three linkable de-identified, research-ready datasets have already been deposited into the Office for National Statistics (ONS) Secure Research Service (SRS), so external researchers can apply to access them. We have already launched a funding opportunity to support some of the first users of Data First data and will announce similar opportunities as more datasets from Data First and other projects become available.
2. Education
The past year has evidenced the importance of good education policy, and how damaging disruptions to education can be. Forming a more complete understanding of children and young people’s lives, including how education provision affects later life, is vital for developing policy and services to properly support them and enable positive outcomes as adults.
ADR UK has lots of work going on to facilitate better evidence to inform education policy. One example is the Understanding Children’s Lives and Outcomes in Scotland project, which is led by ADR Scotland and involves linking pupil census data for Scotland with Scottish Government data on looked-after children, children’s health, births and deaths, and the 2001/2011 national census. The linked data will give researchers a snapshot of the academic achievement, health, economic activity and wellbeing of children in Scotland, providing evidence for policymaking that aligns with the Scottish Government National Performance Framework.
3. Health
One of our pioneering projects with huge potential for both education and health policy impact is Education and Child Health Insights from Linked Data (ECHILD ), which is linking children’s health and education records for all children in England for the first time. This newly linked data will allow detailed analyses to be carried out on the trajectories of groups of children, making it possible to assess variation in provision and unmet need for children with diagnosed health conditions. Research using ECHILD will then help government and the providers of children’s services to better understand their needs and to see which groups might be falling through the gaps. This will be particularly important in the context of understanding the impact of the COVID-19 pandemic on these children.
For both children and adults, maintaining good health and wellbeing is dependent on many factors, including the air we breathe. Ambient air pollution is the biggest environmental risk factor worldwide and a leading environmental cause of early death in the United Kingdom. Researchers from ADR Northern Ireland are exploring the effect of air pollution on health and mortality, including relationships between pollution exposure and health conditions such as diabetes, dementia and Parkinson’s disease. This will generate critical insights on the individual health costs of air pollution in Northern Ireland, and where changes to policy may be needed to mitigate the health risks.
4. Homelessness
The provision of emergency accommodation for people sleeping rough as part of the government’s COVID-19 response had the positive effect of reducing rough sleeping in 2020. However, this short-term crisis response may have less of an impact in the long-term, and good quality data is essential for understanding how policy can work better to tackle rough sleeping, and homelessness more broadly, for good.
Homelessness Data England is a collaboration between ONS, the Ministry of Housing, Communities and Local Government and ADR UK, aimed at creating a linked dataset about homelessness in England. The project involves linking together Homelessness Case Level Data Collection (H-CLIC) data – which records local authorities’ actions under the 2017 Homelessness Reduction Act (HRA) – from across England, and subsequently to other administrative datasets.
The HRA significantly reformed England’s homelessness legislation by placing duties on local authorities to intervene at earlier stages to prevent and reduce homelessness, and the H-CLIC data provides a unique opportunity to improve our understanding of the issue to in turn develop more effective policies to overcome it.
5. Agriculture
Now that the UK has left the European Union, the government is tasked with rapidly developing new policies aimed at improving business prosperity, enhancing environmental stability and strengthening business and personal resilience outside of the EU – and agricultural policy is essential to this.
ADR UK is funding a project in partnership with government in all four UK nations to link de-identified data from across the country to create the first UK-wide data platform focused on agriculture. The AD ARC (Administrative Data Agricultural Research Collection) project, led by researchers from ADR Wales, will enable researchers to uncover unique insights to better understand and support farmers, their households and communities. ADARC is also the first ADR UK project to truly involve all four nations of the UK, and the newly linked data will be hugely valuable for shedding light on ‘what works’ in agricultural policy that properly supports farming communities.
These five policy areas represent just a taste of where ADR UK is having an impact by enabling greater access to administrative data for research – and in turn putting the most comprehensive evidence possible at the fingertips of policymakers. Register to the ADR UK mailing list to stay up to date with our projects, emerging datasets, funding opportunities, and more.
You can hear Emma talk more on this subject at this Analysis in Government Month panel session on 24 May, How do we use data to improve children’s lives.