Chapter 5: inequalities in health
Published 11 September 2018

© Crown copyright 2018
This publication is licensed under the terms of the Open Government Licence v3.0 except where otherwise stated. To view this licence, visit nationalarchives.gov.uk/doc/open-government-licence/version/3 or write to the Information Policy Team, The National Archives, Kew, London TW9 4DU, or email: psi@nationalarchives.gov.uk.
Where we have identified any third party copyright information you will need to obtain permission from the copyright holders concerned.
This publication is available at https://www.gov.uk/government/publications/health-profile-for-england-2018/chapter-5-inequalities-in-health
1. Main messages
Health inequalities are avoidable and unfair differences in health status between groups of people or communities. In 2014 to 2016, the level of inequality, or gap, in life expectancy between the most and least deprived areas of England was 9.3 years for males and 7.3 years for females.
Higher mortality rates in more deprived areas from heart disease, lung cancer, and chronic lower respiratory diseases account for around a third of the total gap in life expectancy for both sexes. Smoking and obesity are the main risk factors for these diseases (Chapter 3). Although smoking prevalence in England has declined, people in the more deprived areas are still more likely to smoke than people in the least deprived areas.
There is no evidence that inequalities in life expectancy have narrowed in recent years. Inequality in life expectancy for females has widened since 2001 to 2003, and for males, although inequality has fluctuated over time, it remains the same as that in 2001 to 2003.
The gap in healthy life expectancy (years lived in good health) between the most and least deprived areas of England was around 19 years for both males and females in 2014 to 2016. People living in the most deprived areas spend nearly a third of their lives in poor health, compared with only about a sixth for those in the least deprived areas. Inequality in healthy life expectancy has not changed since 2011 to 2013 for either sex.
This inequality in health begins early in life with wide inequalities in child health outcomes (Chapter 4). In 2014 to 2016, children in the most deprived areas were twice as likely to be born with low birthweight than children in the least deprived areas, and this inequality has not changed since 2010 to 2012. The latest data show that children in the most deprived areas were more than three times as likely to experience tooth decay than children in the least deprived areas, although inequality has narrowed in absolute terms since academic year 2014 to 2015.
The proportion of children aged 10 to 11 years who are overweight or obese has been increasing in England as a whole (Chapter 4). Alongside this, inequalities in child excess weight between the most and least deprived areas, and between ethnic groups, have also been widening.
There have been long-term improvements in infant mortality (Chapter 4) and rates of premature deaths from cancer and cardiovascular disease (Chapter 2). However, stark inequalities remain. In 2014 to 2016, people in the most deprived areas were more than twice as likely to die prematurely from cancer compared with those in the least deprived areas, and there has been no significant change in this inequality since 2010 to 2012. People in the most deprived areas were almost 4 times as likely to die prematurely from cardiovascular disease, and this inequality has significantly widened since 2010 to 2012.
There are inequalities in many behavioural risk factors among adults. In 2016, people in routine and manual occupations were more likely to smoke, and there were wide variations in smoking prevalence by sexual orientation. In addition, people living in the most deprived areas were more likely to be admitted to hospital for an alcohol related condition than those in the least deprived areas.
There are inequalities in the prevalence of mental health problems between population groups, and levels of smoking and indicators of alcohol misuse are higher for people with mental health problems.
2. Introduction
As described in previous chapters, there are differences in health outcomes between males and females, for different age groups and for different countries. There are also differences in outcomes relating to socioeconomic status, ethnicity, geographical area and other social factors. These health inequalities, avoidable and unfair differences in health status between groups of people or communities[footnote 1], reflect historic and present-day social inequalities in our population. Reducing inequalities should allow everyone to have the same opportunities to lead a healthy life.
This chapter provides an overview of inequality in health in England, concentrating primarily on inequalities by deprivation. A different approach has been taken for this chapter compared with the Health Profile for England 2017. This year, the chapter is based on the indicators selected by PHE’s Health Equity Board to form part of the PHE Health Equity Dashboard. The dashboard and this chapter quantify inequalities in these indicators and, where possible, present trends over time to determine whether the level of inequality has increased or decreased.
The indicators are drawn from the Public Health Outcomes Framework and include indicators on life expectancy and mortality, and PHE priority areas including risk factors, child health and mental health. Inequalities in the wider determinants of health are covered in detail in Chapter 6.
Although the chapter focusses on inequalities within England as a whole, there are also considerable variations within and between the geographic areas of England. The Public Health Outcomes Framework provides data at local authority level, which can be used to examine these geographic inequalities.
3. Inequalities in life expectancy and healthy life expectancy
Life expectancy at birth in England has generally increased in recent decades and provisional data for 2017 show that it has reached 79.6 years for males and 83.2 years for females (Chapter 1). However, life expectancy is not uniform across England and inequalities exist.
If neighbourhood areas within England are ranked from most to least deprived and then organised into 10 groups, life expectancy increases in each group as the level of deprivation decreases (Figures 1 and 2). In other words, there is a ‘social gradient’ in health[footnote 2] (see Methods, data and definitions for further information on these ‘deprivation decile’ groups).
The slope index of inequality (SII) is a summary measure of this social gradient, which indicates how much life expectancy varies with deprivation. Between the most and least deprived areas of England, the level of inequality, or gap, in life expectancy is 9.3 years for males and 7.3 years for females (as measured by the SII).
The level of inequality in healthy life expectancy (years lived in good health) is larger than for life expectancy (Figures 1 and 2). The gap in healthy life expectancy between the most and least deprived areas of England is around 19 years for both males and females (as measured by the SII).
Figure 1: slope index of inequality in life expectancy and healthy life expectancy at birth, males, England, 2014 to 2016
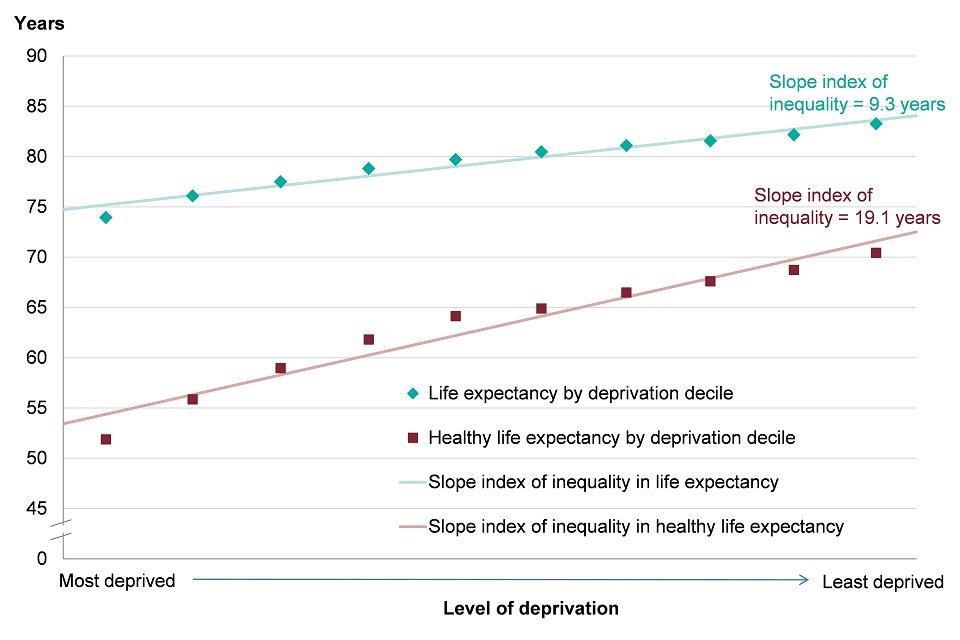
Figure 1: slope index of inequality in life expectancy and healthy life expectancy at birth, males, England, 2014 to 2016 [Source: Public Health Outcomes Framework.]
*deprivation deciles based on groups of lower super output areas in England (Index of Multiple Deprivation 2015).
Figure 2: slope index of inequality in life expectancy and healthy life expectancy at birth, females, England, 2014 to 2016
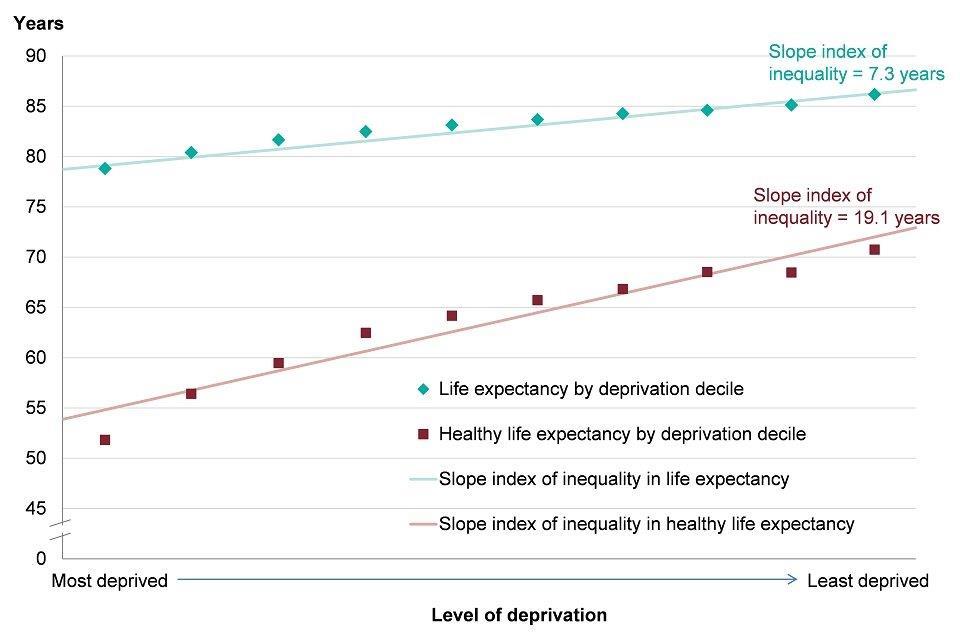
Figure 2: slope index of inequality in life expectancy and healthy life expectancy at birth, females, England, 2014 to 2016 [Source: Public Health Outcomes Framework.]
*deprivation deciles based on groups of lower super output areas in England (Index of Multiple Deprivation 2015).
See how your area compares: Life expectancy
4. Trend in inequality in life expectancy and healthy life expectancy
Inequality in life expectancy between the most and least deprived areas in England has fluctuated over recent years for males. Between the periods 2001 to 2003 and 2006 to 2008 there was a statistically significant widening of the gap, to 9.7 years. This was followed by a narrowing of the gap to 9.0 years in 2011 to 2013. Between 2011 to 2013 and 2014 to 2016, the gap has significantly widened again, to 9.3 years, the same value as in 2001 to 2003 (Figure 3).
For females, there has been a gradual widening of inequality in life expectancy since 2001 to 2003. The gap has widened from 6.3 years in 2001 to 2003 to 7.3 years in 2014 to 2016. This change is statistically significant (Figure 3).
There has been no significant change in inequality in healthy life expectancy between 2011 to 2013 and 2014 to 2016 for either males or females. Due to changes in methodology, a longer term trend for inequality in healthy life expectancy is not available.
Figure 3: trend in inequality in life expectancy at birth and healthy life expectancy at birth, males and females, England, 2001 to 2003 up to 2014 to 2016
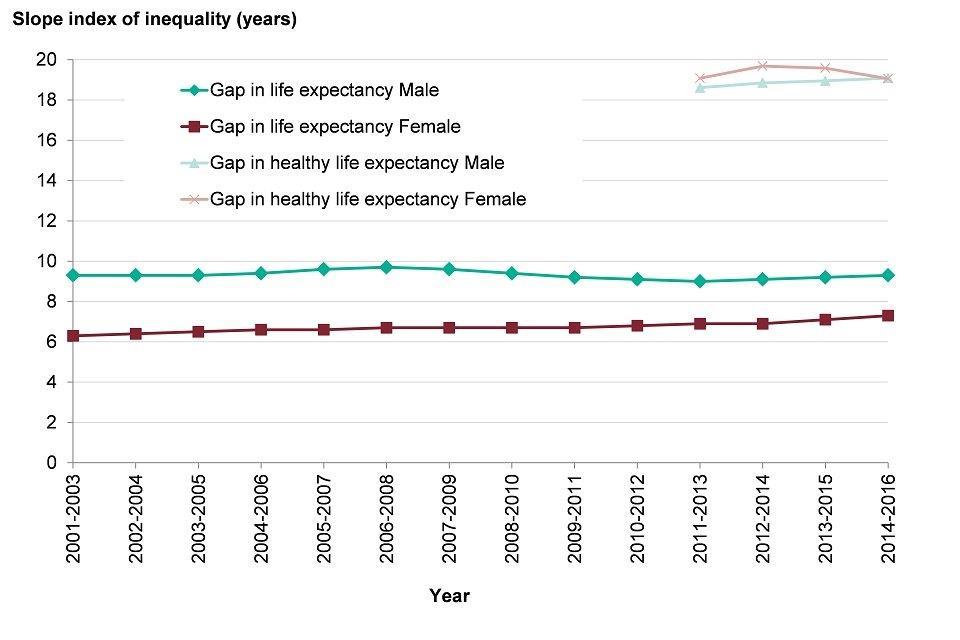
Figure 3: trend in inequality in life expectancy at birth and healthy life expectancy at birth, males and females, England, 2001 to 2003 up to 2014 to 2016 [Source: Public Health Outcomes Framework based on Index of Multiple Deprivation 2010 (2001 to 2003 to 2009 to 2011) and Index of Multiple Deprivation 2015 (2010 to 2012 onwards)]
5. Contribution of age groups and causes of death to the gap in life expectancy
The contribution of different age groups to the gap in life expectancy between most and least deprived areas can be summarised using a method of ‘life expectancy decomposition’(see Methods, data and definitions for further details).
From 2014 to 2016, mortality rates were higher in the most deprived decile for all age groups. For males, 8.0 years (85%) of the 9 year gap in life expectancy between the most and least deprived deciles could be accounted for by higher mortality rates among those aged between 40 and 89 in the most deprived decile (Figure 4). Higher mortality rates among males in the 60 to 69 age group in the most deprived decile made the biggest contribution of any age group, accounting for 2.1 years of the total gap.
Reducing higher mortality rates in the age groups making the biggest contributions will have the biggest effect on reducing the life expectancy gap.
Figure 4: breakdown of the life expectancy inequality gap between the most and least deprived deciles, by age group, males, England, 2014 to 2016
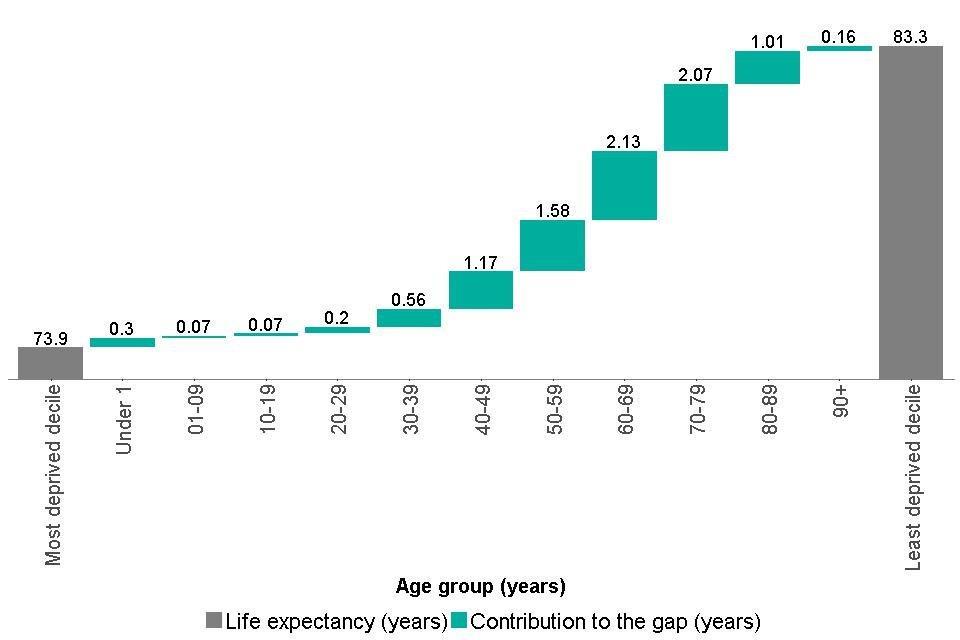
Figure 4: breakdown of the life expectancy inequality gap between the most and least deprived deciles, by age group, males, England, 2014 to 2016 [Source: Public Health England analysis based on mortality and population data from ONS and Index of Multiple Deprivation 2015 from Ministry of Housing, Communities and Local Government]
For females, there is a similar picture, with higher mortality rates among the older age groups in the most deprived decile accounting for most of the 7 year life expectancy gap. Higher mortality among females aged between 40 and 89 years accounts for 6.4 years (87%) of the total gap, with females aged between 70 and 79 years making the largest contribution of any age group, 1.9 years. (Figure 5).
Figure 5: breakdown of the life expectancy inequality gap between the most and least deprived deciles, females, England, 2014 to 2016
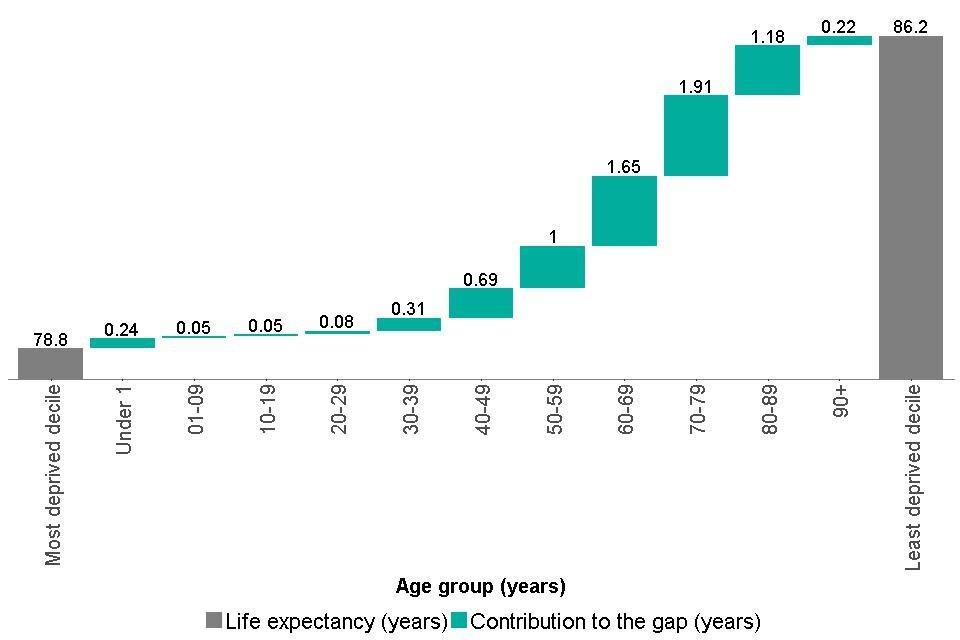
Figure 5: breakdown of the life expectancy inequality gap between the most and least deprived deciles, females, England, 2014 to 2016 [Source: Public Health England analysis based on mortality and population data from ONS and Index of Multiple Deprivation 2015 from Ministry of Housing, Communities and Local Government]
The contribution that different causes of death make to the gap in life expectancy between the most deprived and least deprived deciles can also be assessed. Figures 6 and 7 show these contributions for the 10 leading causes of death for males and females discussed in Chapter 2. These causes accounted for approximately 60% of all deaths in 2014 to 2016.
Higher mortality rates in the most deprived decile for heart disease, lung cancer, and chronic lower respiratory diseases contribute the most to the life expectancy gap in both sexes. Higher mortality rates from these causes of death account for around a third of the total gap. Smoking and obesity are the main risk factors for these diseases.
In males, 1.5 years of the 9 year life expectancy gap was accounted for by a higher mortality rate for heart disease in the most deprived decile, and for females, higher mortality for chronic lower respiratory diseases made the largest contribution (1.0 years of the 7 year gap) (Figures 6 and 7).
In both sexes, higher mortality in the most deprived decile from causes of death other than the 10 leading causes, accounted for just over 40% of the life expectancy gap. The ‘other’ group is comprised of deaths from a wide range of causes and further examination did not reveal a dominant cause contributing to the life expectancy gap. Among men, the largest contributions to the ‘other’ group were from higher mortality rates in the most deprived decile from accidental poisoning (contributing 0.5 years), and suicide (contributing 0.3 years). Among females, the largest contribution to the ‘other’ group was from higher mortality from cirrhosis and other liver disease (contributing 0.3 years).
Figure 6: breakdown of the life expectancy inequality gap between the most and least deprived deciles, males, England, 2014 to 2016
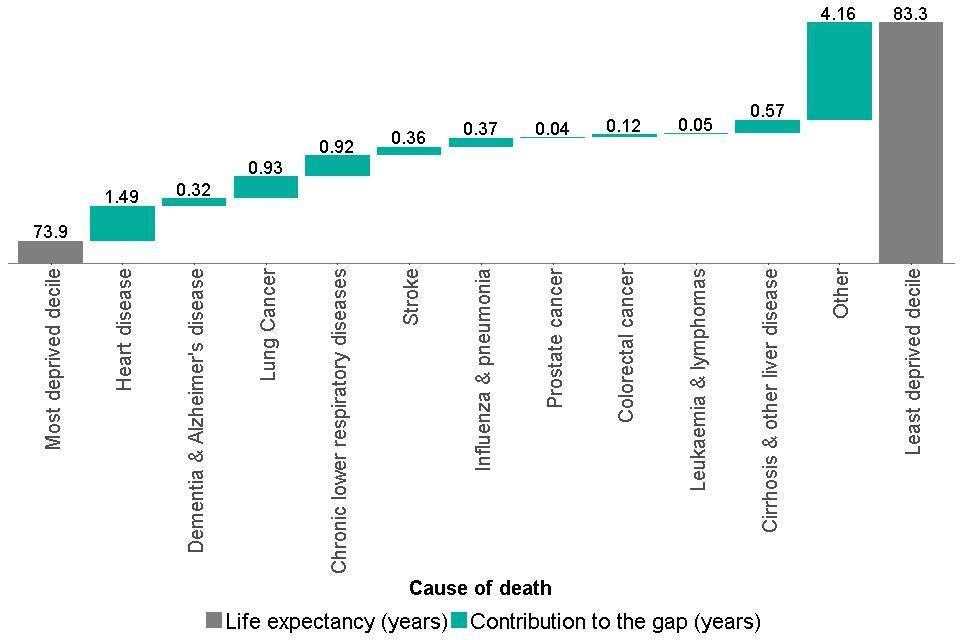
Figure 6: breakdown of the life expectancy inequality gap between the most and least deprived deciles, males, England, 2014 to 2016 [Source: Public Health England analysis based on mortality and population data from ONS and Index of Multiple Deprivation 2015 from Ministry of Housing, Communities and Local Government]
Figure 7: breakdown of the life expectancy inequality gap between the most and least deprived deciles, females, England, 2014 to 2016
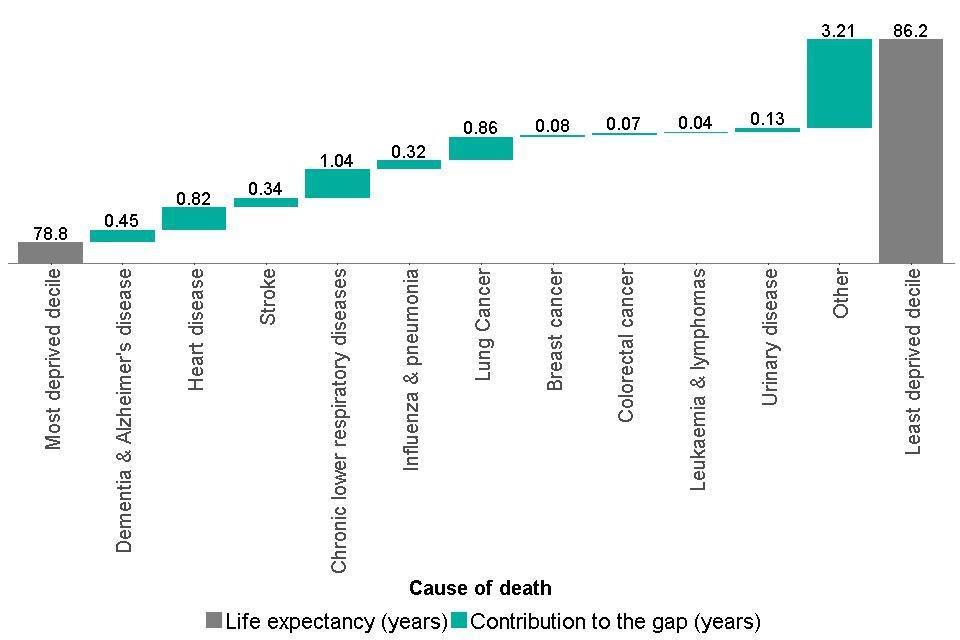
Figure 7: breakdown of the life expectancy inequality gap between the most and least deprived deciles, females, England, 2014 to 2016 [Source: Public Health England analysis based on mortality and population data from ONS and Index of Multiple Deprivation 2015 from Ministry of Housing, Communities and Local Government]
6. Inequalities in mortality from specific causes
The social gradient observed for life expectancy is also apparent for other priority health outcomes. Premature mortality rates in people (under 75 years) from cancer and cardiovascular disease (heart disease and stroke) have declined in recent years in England (Chapter 2), however, stark inequalities remain (Figure 8).
People in the most deprived areas are more than twice as likely to die prematurely from cancer (as measured by the relative index of inequality), and there has been no significant change in this inequality since 2010 to 2012.
People in the most deprived areas are almost 4 times as likely to die prematurely from cardiovascular disease compared with those in the least deprived areas (measured by the relative index of inequality), and this has significantly widened since 2010 to 2012.
Figure 8: age-standardised premature (aged <75) mortality rate for cancer and cardiovascular disease, by deprivation decile*, persons, England, 2014 to 2016
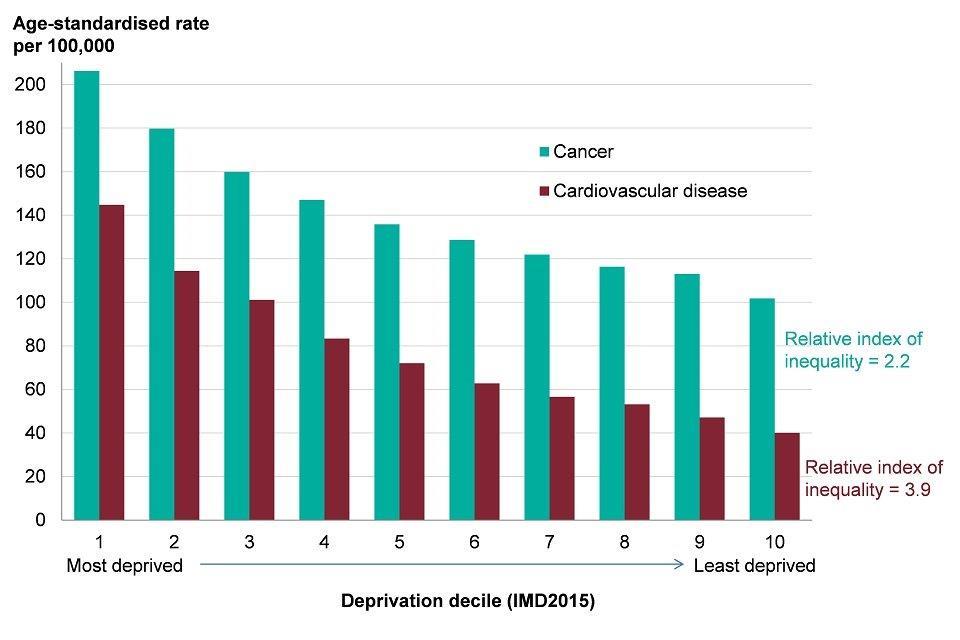
Figure 8: age-standardised premature (aged <75) mortality rate for cancer and cardiovascular disease, by deprivation decile*, persons, England, 2014 to 2016 [Source: Public Health England analysis based on mortality and population data from ONS and Index of Multiple Deprivation 2015 from Ministry of Housing, Communities and Local Government.]
*deprivation deciles based on groups of lower super output areas in England (Index of Multiple Deprivation 2015).
Suicide provides another example. The rate of suicide has gradually increased in England since 2006 to 2008, although there was a small fall in the rate in 2014 to 2016. The most deprived areas of England have the highest mortality from suicide (Figure 9). In 2014 to 2016, people in the most deprived areas were twice as likely to die from suicide compared with those in the least deprived areas (as measured by the relative index of inequality), and there has been no change in this inequality since 2010 to 2012.
Figure 9: age-standardised mortality rate for suicide, by deprivation decile*, persons, England, 2014 to 2016
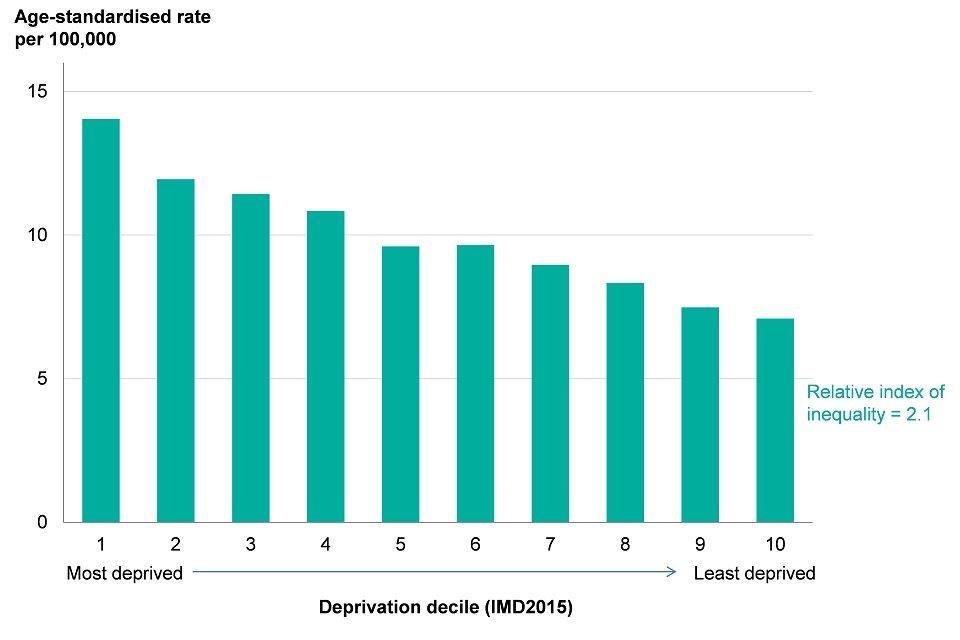
Figure 9: age-standardised mortality rate for suicide, by deprivation decile*, persons, England, 2014 to 2016 [Source: Public Health England analysis based on mortality and population data from ONS and Index of Multiple Deprivation 2015 from Ministry of Housing, Communities and Local Government.]
*deprivation deciles based on groups of lower super output areas in England (Index of Multiple Deprivation 2015).
7. Inequalities in child health
This section summarises inequalities in child health outcomes and builds on the analysis presented in Chapter 4. Inequality in health outcomes begins early in life. Chapter 4 presents inequalities in the percentage of babies born with a low birth weight, infant mortality rates, excess weight in children and the level of dental decay in children between different areas according to the level of deprivation.
This chapter quantifies the level of inequality using measures explained in the Methods, data and definitions section, and analyses trends in these measures over time. These measures and trends are presented in the PHE Health Equity Dashboard.
In the most deprived areas of England, in 2014 to 2016, the percentage of term babies born with a low birthweight was twice as high as in the least deprived areas (as measured by the relative index of inequality), and there has been no change in this level of inequality since 2010 to 2012.
The infant mortality rate in the most deprived areas was over twice as high as the rate in the least deprived areas in 2014 to 2016 (as measured by the relative index of inequality), and there has been no change in this level of inequality since 2010 to 2012.
If the most deprived decile group had the same infant mortality rate as the least deprived, there would have been 873 fewer infant deaths in 2014 to 2016 in England. However, if all decile groups had the same infant mortality rate as the least deprived, there would have been 2,211 fewer infant deaths (see data pack).
In addition, large social gradients exist for other child health indicators. The percentage of children with dental decay was over three times higher in the most deprived areas than the least deprived areas (measured by the relative index of inequality). There has been a narrowing of inequality in absolute terms between academic years 2011 to 2012 and 2016 to 2017.
Among 10 to 11 year olds in the most deprived areas, 40.9% were overweight or obese in academic year 2016 to 2017 (Chapter 4). The proportion of children overweight or obese was 1.8 times higher in the most deprived areas compared with the least deprived areas (based on the relative index of inequality). There has been a significant widening of this inequality since academic year 2013 to 2014.
There are also large variations in the percentage of children who are overweight or obese by ethnic group. Among children aged 10 to 11 years, in the academic year 2016 to 2017, children in the Black African and Black Caribbean ethnic groups were most likely to be overweight or obese. However, almost all Black and Minority Ethnic (BME) groups had high percentages of 10 to 11 year olds with excess weight (Figure 10).
The level of inequality by ethnic group was 7.4 percentage points in the academic year 2016 to 2017, as measured by the mean deviation, and this inequality has widened since academic year 2013 to 2014. This analysis does not take into account the differences in the level of deprivation between ethnic groups.
Inequalities in the percentage of children aged 4 to 5 years who are overweight or obese also exist, although these inequalities are narrower than those at age 10 to 11 years.
Figure 10: percentage of 10 to 11 year old children classified as overweight or obese, by ethnic group, England, academic year 2016 to 2017
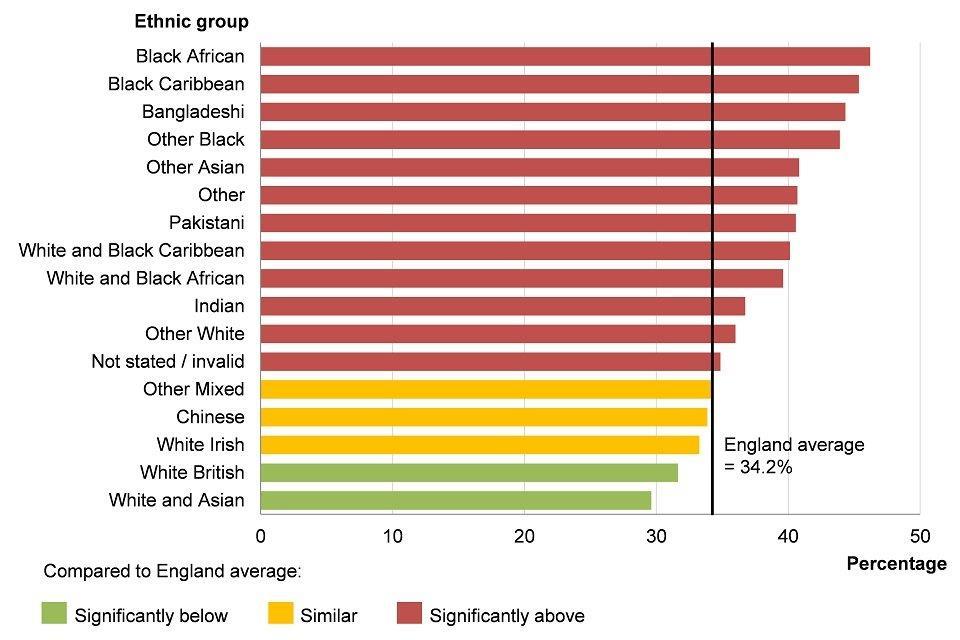
Figure 10: percentage of 10 to 11 year old children classified as overweight or obese, by ethnic group, England, academic year 2016 to 2017 [Source: Public Health Outcomes Framework]
8. Behavioural risk factors
As well as differences in life expectancy, healthy life expectancy and mortality rates among adults, there are also differences in the prevalence of many behavioural risk factors between population groups.
For example, there is a clear social gradient in smoking prevalence. In 2016, 27.2% of adults in the most deprived decile smoked, compared with 7.9% of those in the least deprived decile. Prevalence of smoking is also higher among those who work in routine and manual occupations compared with those in managerial and professional occupations. Smoking prevalence also differs by sexual orientation, with a prevalence of 24.1% and 23.6% among those identifying as bisexual and gay/lesbian respectively, compared with 16.3% in the heterosexual group in 2016 (Figure 11).
Figure 11: smoking prevalence by sexual orientation, age 18+ years, England, 2016
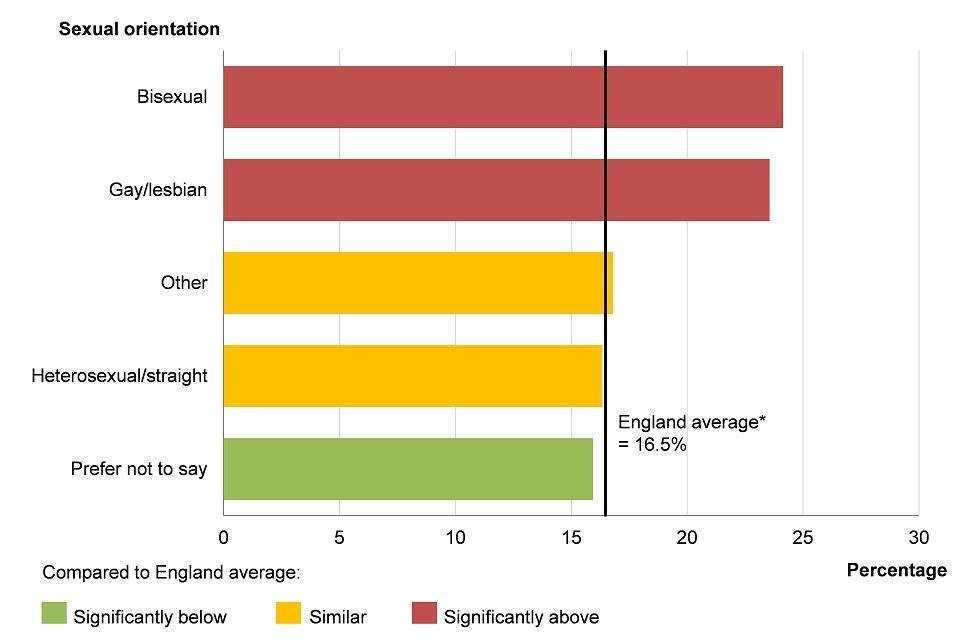
Figure 11: smoking prevalence by sexual orientation, age 18+ years, England, 2016 [Source: Public Health Outcomes Framework]
*England average presented in this chart differs from the England smoking prevalence figure presented in the Public Health Outcomes Framework (see Methods, data and definitions).
As discussed in the Health Profile for England 2017, inequalities also exist for other behavioural risk factors including fruit and vegetable consumption and physical exercise. People who have multiple risk factors are likely to have the poorest health outcomes, and there is significant co-occurrence of smoking, drinking, physical inactivity and poor diet among individuals in England[footnote 3]. Data for these individual indicators can be accessed in the Public Health Outcomes Framework.
Admissions to hospital for alcohol related conditions also vary by level of deprivation. In financial year 2015 to 2016, the admission rate in the most deprived areas was more than twice as high as in the least deprived areas (as measured by the relative index of inequality).
9. Mental health and wellbeing
Mental health and wellbeing are important influences on health behaviours and physical health, as well as being health outcomes in their own right. Wellbeing is measured in a number of ways, including feeling worthwhile, anxious, happy, or satisfied with life.
Data in the Public Health Outcomes Framework shows that there has been a general improvement in the percentage of people reporting unfavourable levels on all these measures in recent years. However, there are inequalities between different groups of the population. For example, in financial year 2016 to 2017, females were more likely than males to report feeling anxious but males were more likely to feel their life is not worthwhile.
In financial year 2016 to 2017, 4.5% of the population reported low life satisfaction, but this varied considerably by employment status. Low life satisfaction among the unemployed was almost four times higher than among the employed, while for the economically inactive it was over twice as high. Inequality in life satisfaction between employment groups was 5.9 percentage points in financial year 2016 to 2017 as measured by the mean deviation (see Methods, data and definitions for further information), and this inequality has reduced since financial year 2013 to 2014.
The prevalence of mental health disorders varies considerably between population groups. Although the Adult Psychiatric Morbidity Survey 2014 does not describe the prevalence of mental health disorders in relation to deprivation directly, it considers some important factors that contribute. For example, rates of common mental health disorders and psychotic disorders were higher among those who are unemployed and economically inactive and were also higher among those in receipt of benefits. Chapter 3 discusses the prevalence of common mental health disorders by age and sex.
Among men, the prevalence of having a common mental health disorder (such as an anxiety disorder or depressive episode) does not vary greatly by ethnic group. In 2014, prevalence for White British males, in the week prior to being questioned, was 13.5% and levels were similar for the other main ethnic groups. However, Black or Black British females are more likely than White British females to report common mental health disorders (29.3%, compared with 20.9%) while females in the White Other ethnic group are least likely to report symptoms (15.6%). For psychotic disorders, prevalence is not available for all ethnic groups for females, but prevalence is higher in Black males (3.2%) than in males from the White (0.3%) and Asian (1.3%) ethnic groups.
It is very common for people to experience problems with their mental health and alcohol or drug use at the same time. Research shows that the majority of drug users (70%) and alcohol users (86%) in community substance misuse treatment also experience mental health problems[footnote 4].
In England, smoking prevalence among adults with mental health conditions is higher than the general population, although the prevalence varies by specific condition[footnote 5]. In financial year 2014 to 2015, 40% of adults with a serious mental illness were reported to be smokers.
10. Wider determinants of health
In addition to behavioural risk factors and health outcomes, there are considerable variations in the wider determinants of health between population groups. These inequalities are covered in detail in Chapter 6.
11. Further information
The indicators presented in this chapter are taken from the Public Health Outcomes Framework. More detailed metadata about the indicators and how they are constructed is available from the data tool.
The 2018 PHE Health Equity Dashboard is an interactive tool which allows users to explore and visualise the data. A static version of the dashboard is also available which allows users to access the underlying data in Excel.
In 2017, the PHE Health Equity Dashboard was published as part of the Public Health Outcomes Framework: Health Equity Report - Focus on ethnicity. This report provides commentary for each of the indicators in the PHE Health Equity Dashboard, and additional breakdowns of inequality, in particular by ethnic group.
The Ethnicity facts and figures website was first published in 2017 and brought together indicators by ethnic group from across government departments. This forms part of the Government’s Race Disparity Audit.
The purpose of the audit is to help to understand and assess differences between ethnic groups, and to identify those public services where disparities are diminishing and those where work is needed to develop effective strategies to reduce disparities between ethnic groups.
12. References
-
Public Health England (2017) Reducing health inequalities in local areas. Accessed 26 July 2018. ↩
-
The Marmot Review Team (2010) The Marmot Review: Fair Society, Healthy Lives. Accessed 9 May 2018. ↩
-
Kings Fund (2018) Tackling multiple unhealthy risk factors. Emerging lessons from practice. Accessed 11 June 2018. ↩
-
Public Health England (2017) Better care for people with co-occurring mental health, and alcohol and drug use conditions. Accessed 27 June 2018. ↩
-
Royal College of Physicians (2013) Smoking and mental health. Accessed 27 July 2018. ↩