Workplace pension participation and savings trends of employees: 2009 to 2025
Published 30 July 2026

© Crown copyright 2026
This publication is licensed under the terms of the Open Government Licence v3.0 except where otherwise stated. To view this licence, visit nationalarchives.gov.uk/doc/open-government-licence/version/3 or write to the Information Policy Team, The National Archives, Kew, London TW9 4DU, or email: psi@nationalarchives.gov.uk.
Where we have identified any third party copyright information you will need to obtain permission from the copyright holders concerned.
This publication is available at https://www.gov.uk/government/statistics/workplace-pension-participation-and-savings-trends-2009-to-2025/workplace-pension-participation-and-savings-trends-of-employees-2009-to-2025
This latest release of statistics on Workplace Pension Participation and Savings Trends explores information on the workplace pension participation for employees eligible for Automatic Enrolment (AE). Information on the trends in private pension withdrawals is also included. This latest edition extends the data series to 2025 and provides further additions to the statistical series with new breakdowns by age, gender and earnings.
After years of growth in participation during the roll-out of AE, participation rates have stabilised in recent years. While trends in stopping saving levels and contribution opt-outs have both risen in the latest year they remain low as a proportion of the AE-eligible population.
There are two important groups considered in this publication:
1. Eligible Employees – these are the group of employees who are eligible for AE (those aged 22 to State Pension age and earn over £10,000 a year)
2. All Employees – this captures all employees, regardless of AE eligibility
The most comprehensive data source which enables analysis of AE participation and contributions amongst employees is the Office for National Statistics (ONS) Annual Survey of Hours and Earnings (ASHE). The latest data available is the 2025 survey. The ONS have continued to improve methods for processing returns to the survey for the 2025 provisional data and 2024 revised data (which has been updated in this release).
1. Trends in Workplace Pension Participation
Around 9-in-10 (90%) of eligible employees in Great Britain were saving into a workplace pension in 2025, continuing the trend of previous years, with 22.6 million eligible employees saving. This is an increase of 0.6 million more eligible employees saving and a 1ppt increase in the pension participation rate compared to 2024.
The overall workplace pension participation rate of all employees in Great Britain continued to be around 8 in 10 (82%) in 2025, with 24.2 million employees saving. This is a 0.6 million greater number of employees saving compared to 2024.
The number of employees saving continues to increase year on year. This can be attributed to an increase in the number of employees brought into AE eligibility, as the earnings trigger (currently £10,000) has remained frozen in recent years.
Figure 1: Eligible Employee pension participation rate to 2025
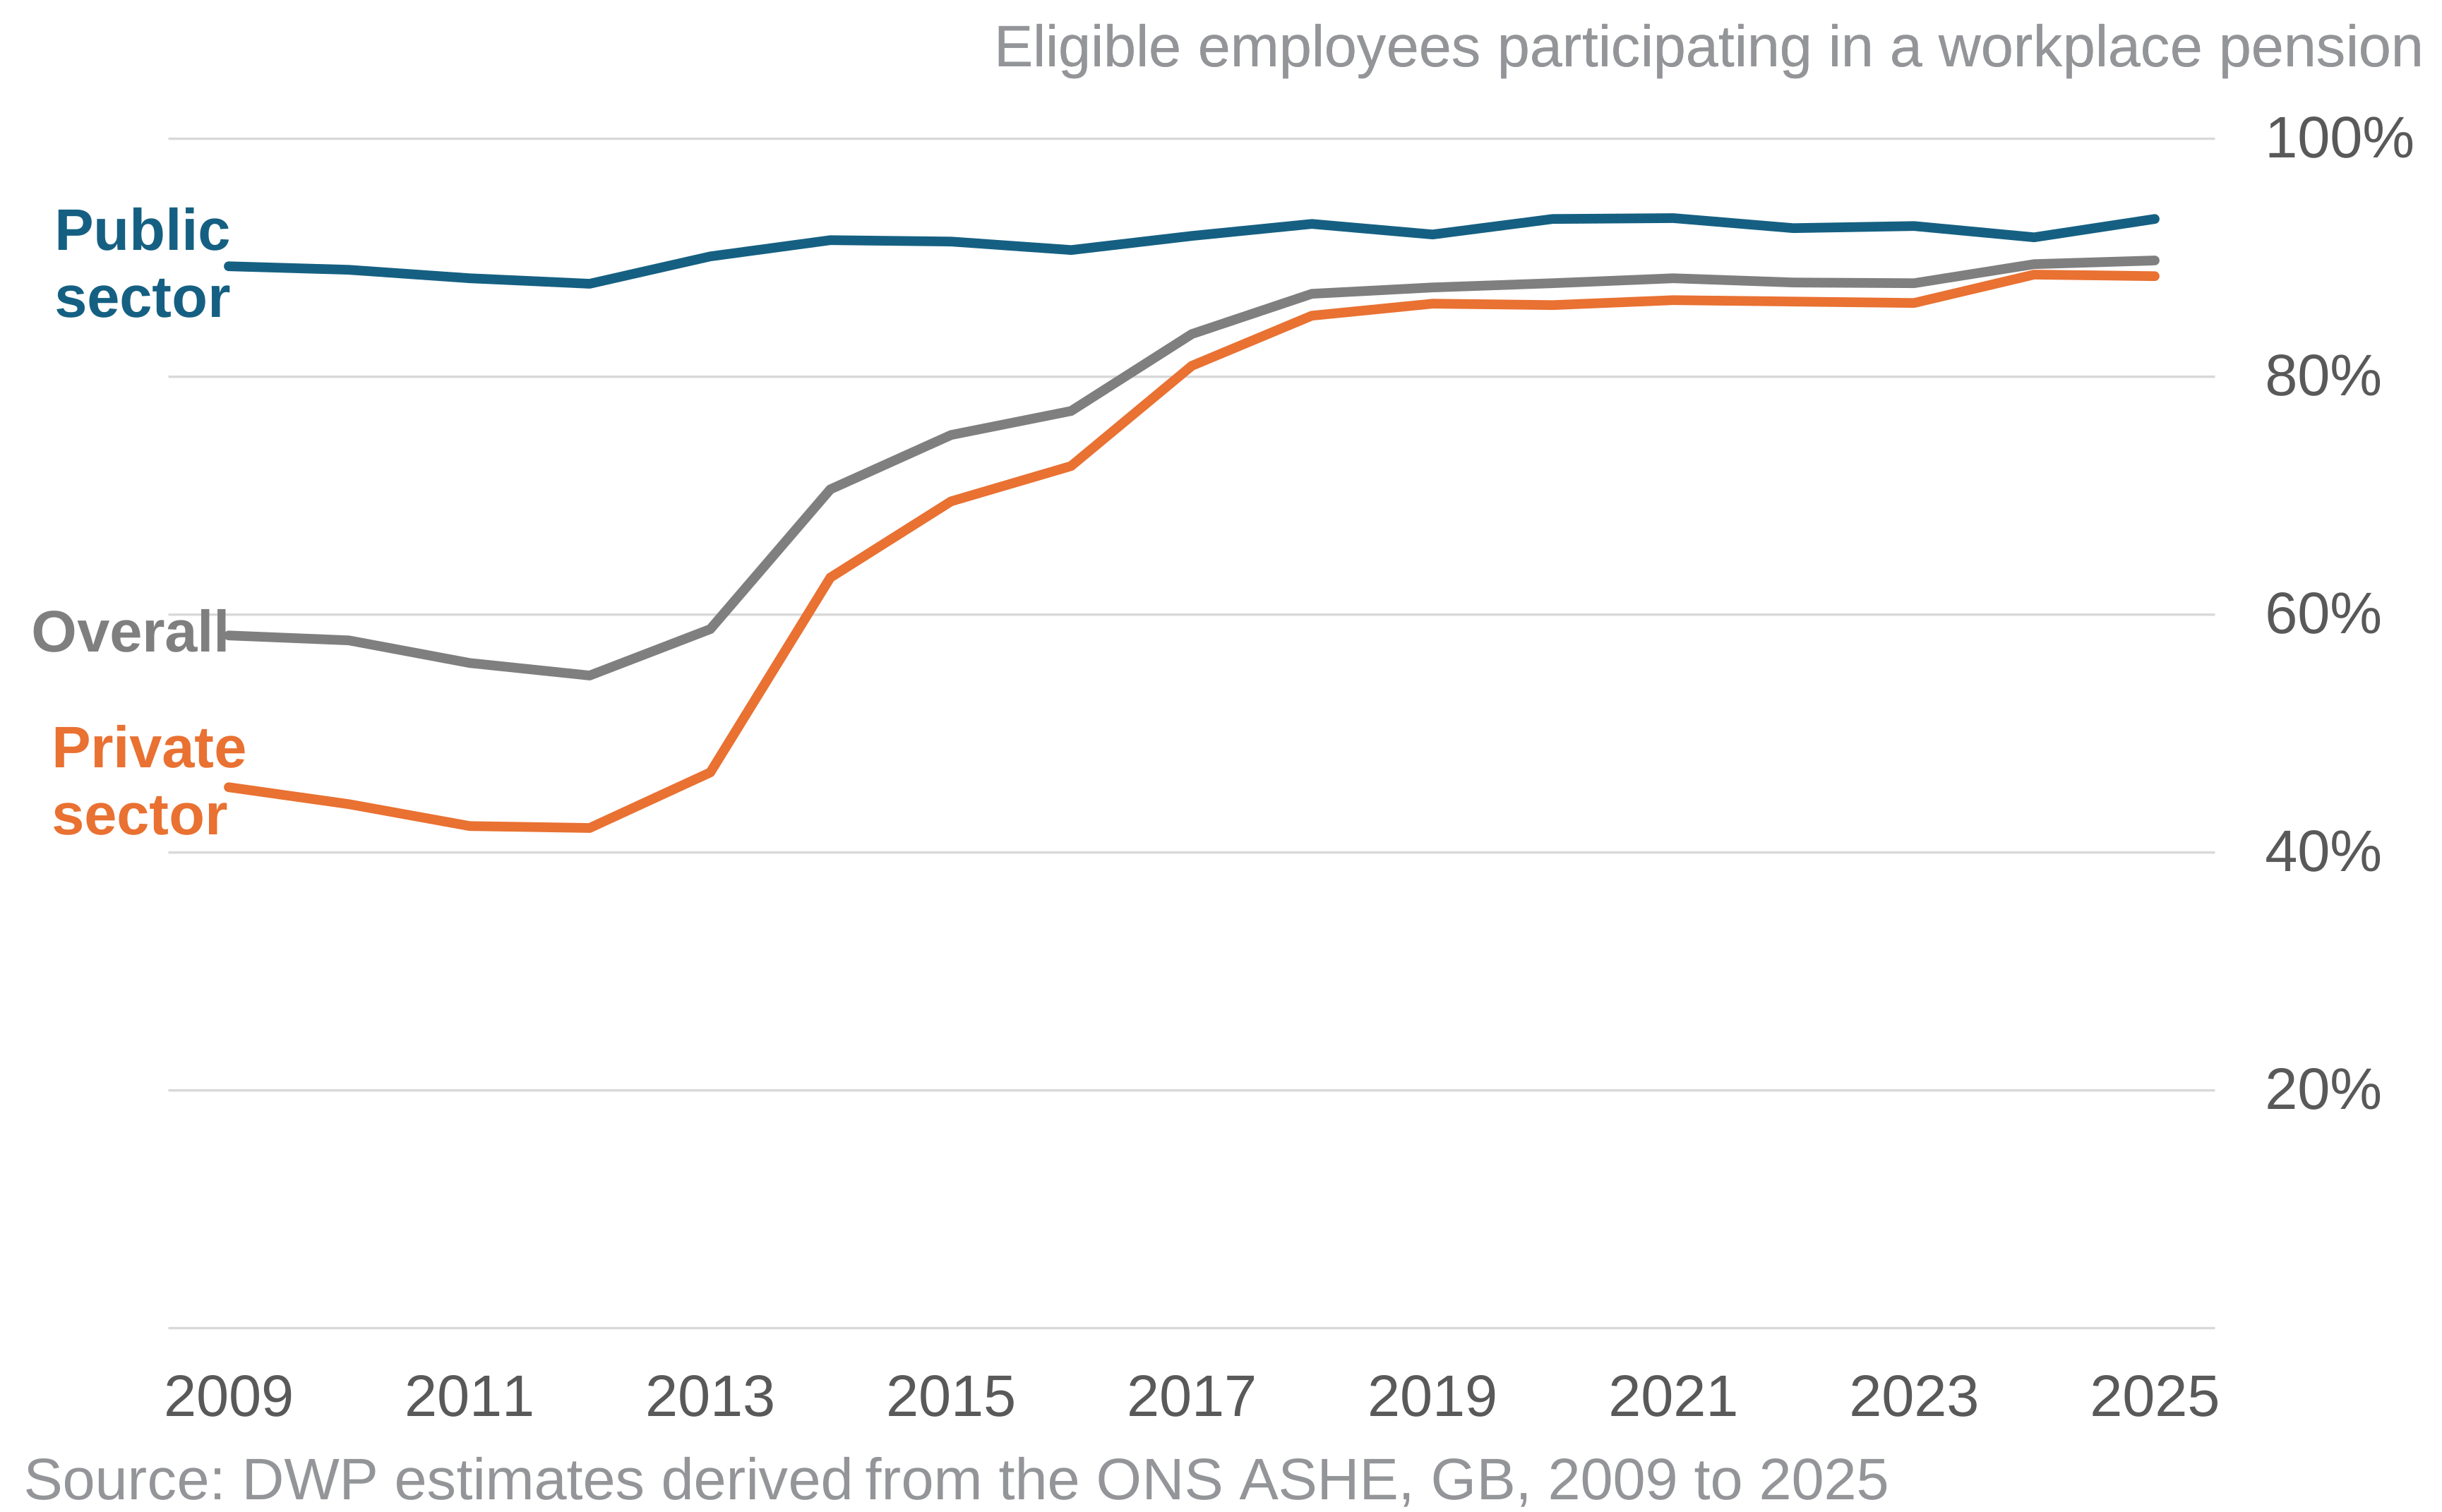
Figure 2: All Employee pension participation rate to 2025
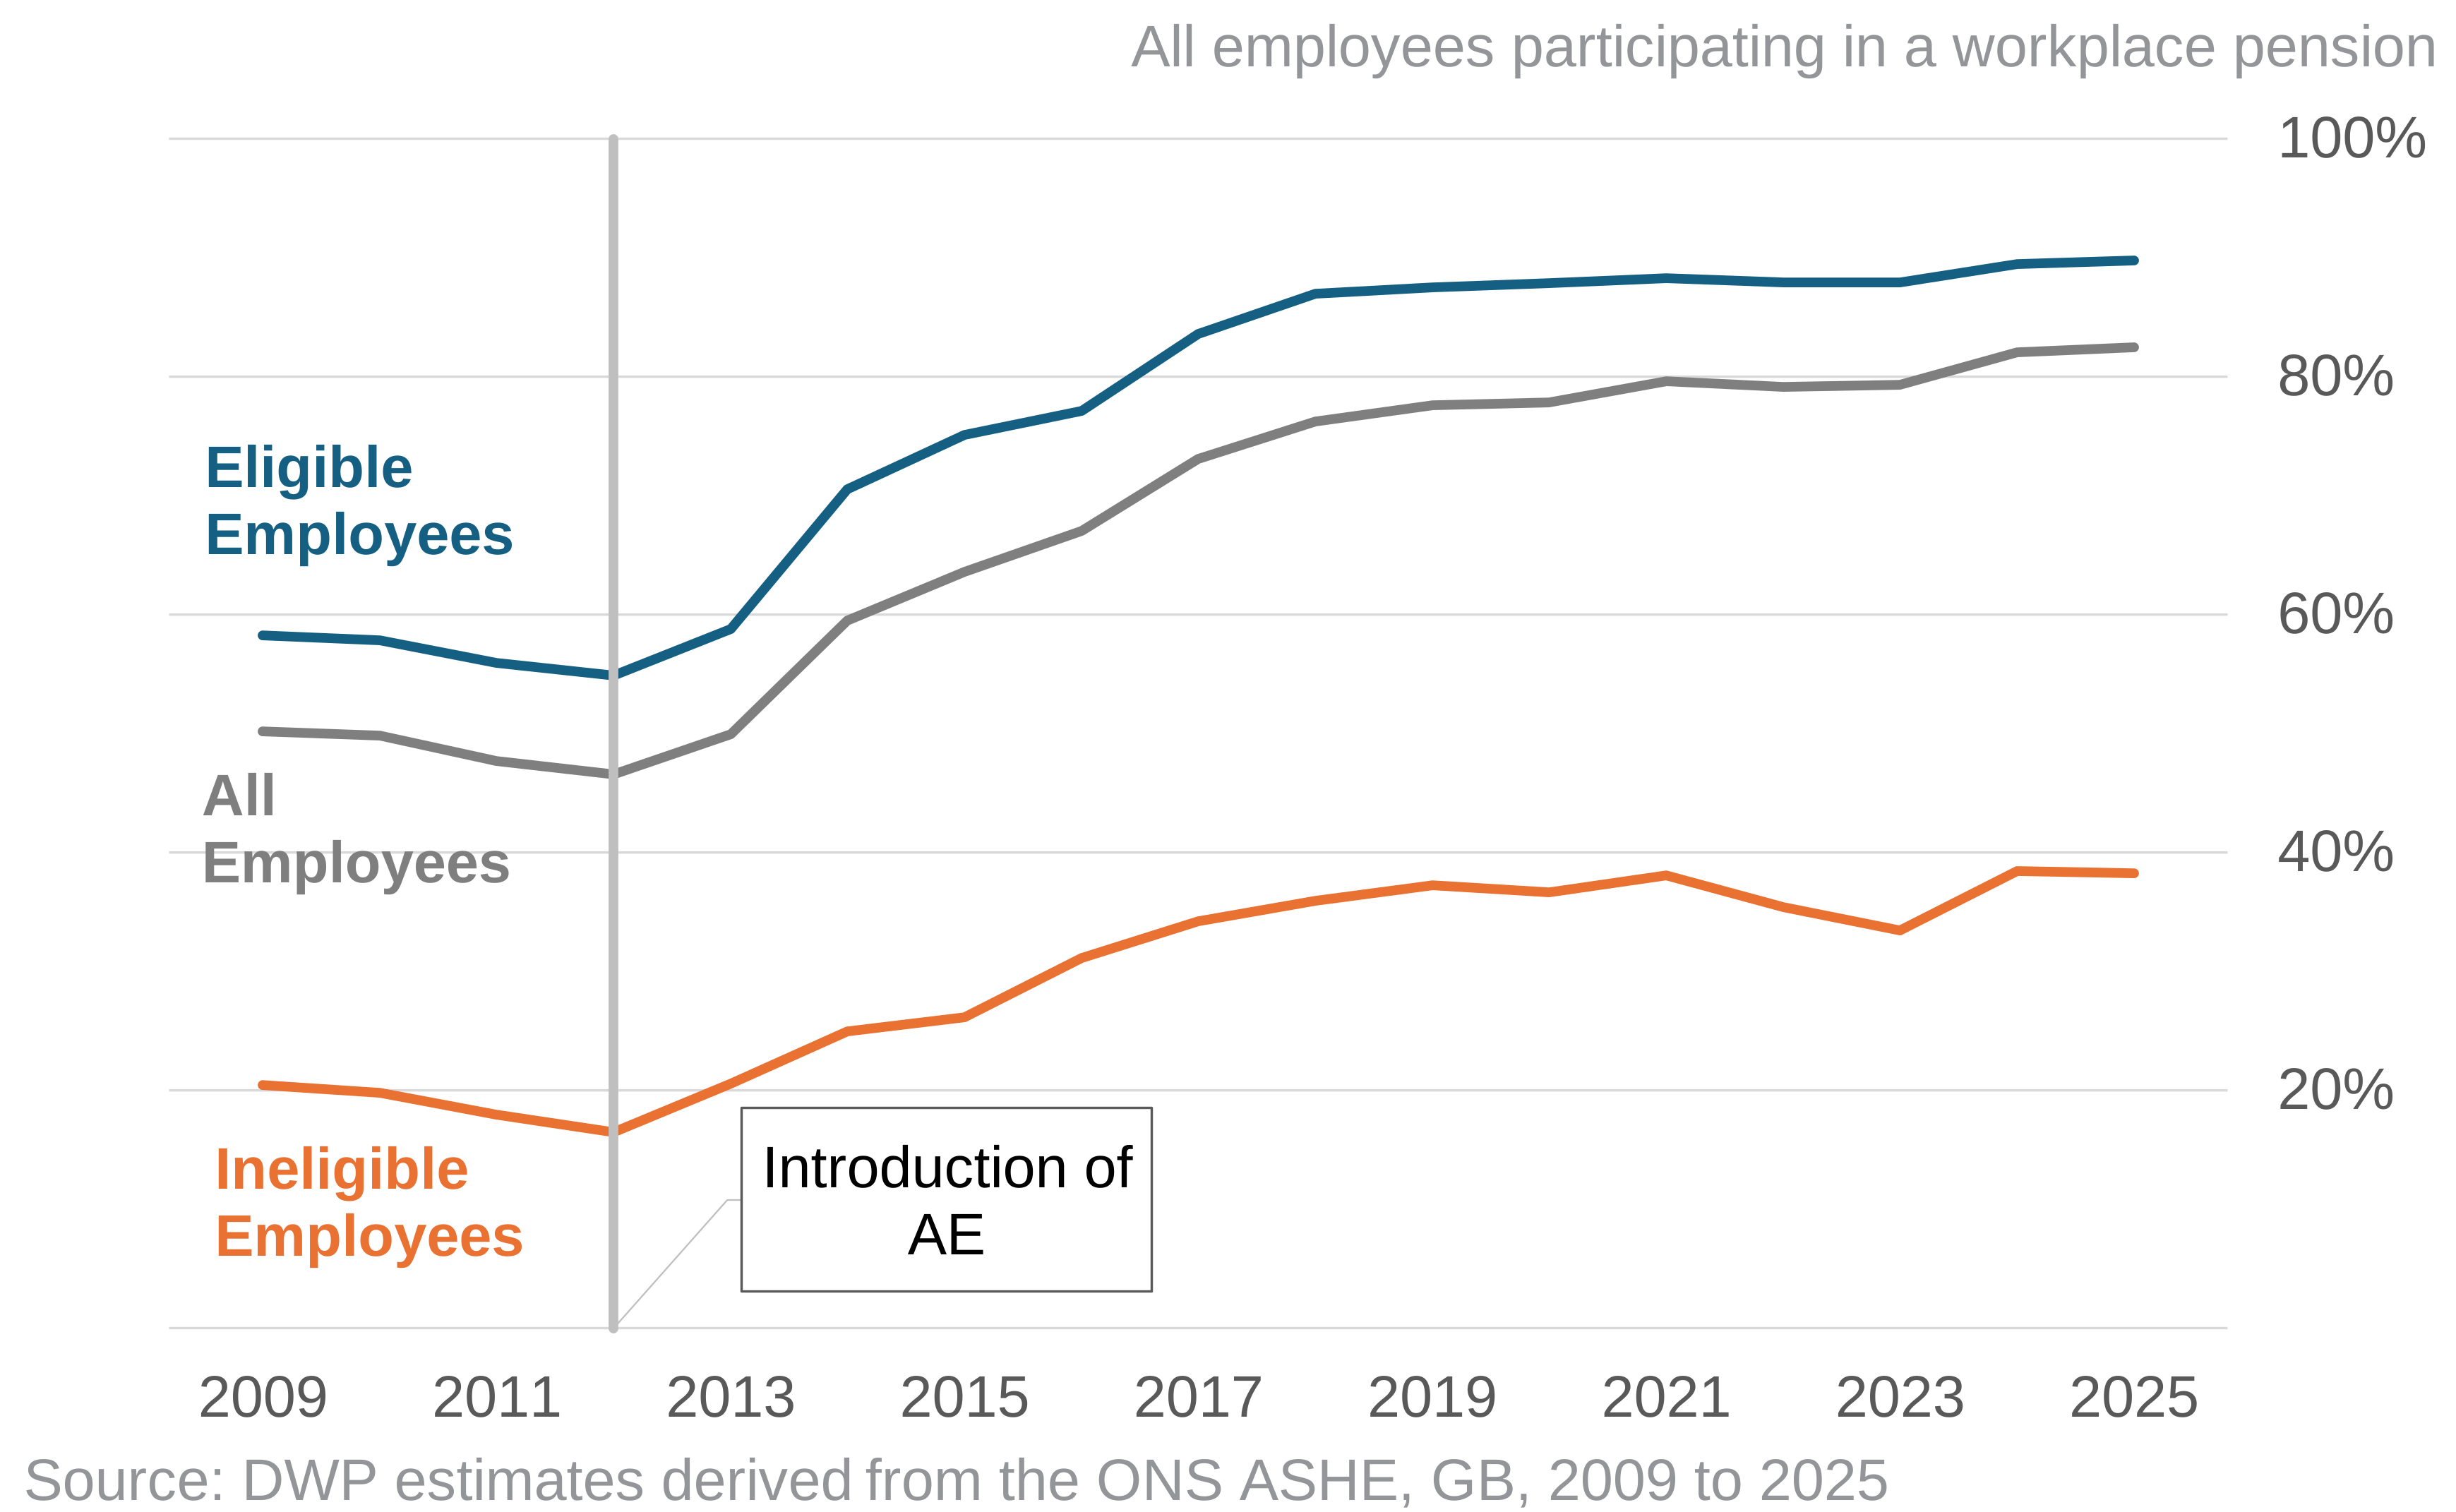
Since AE was introduced in 2012, participation differences across the population have narrowed and most groups have seen trends in participation stabilise in recent years. However, there are some groups where there remains a noticeable pension participation gap, for example:
-
only around 55% of eligible employees working for a micro employer (those with less than 5 employees) in the private sector are saving into a workplace pension
-
67% of Pakistani and Bangladeshi eligible employees are saving into a workplace pension (note, ethnicity participation rates are derived from the Family Resources Survey (FRS) and calculated using a 3-year average due to small sample sizes)
Estimates of workplace pension participation by different breakdowns can be found in the accompanying tables 1.1 to 1.12.
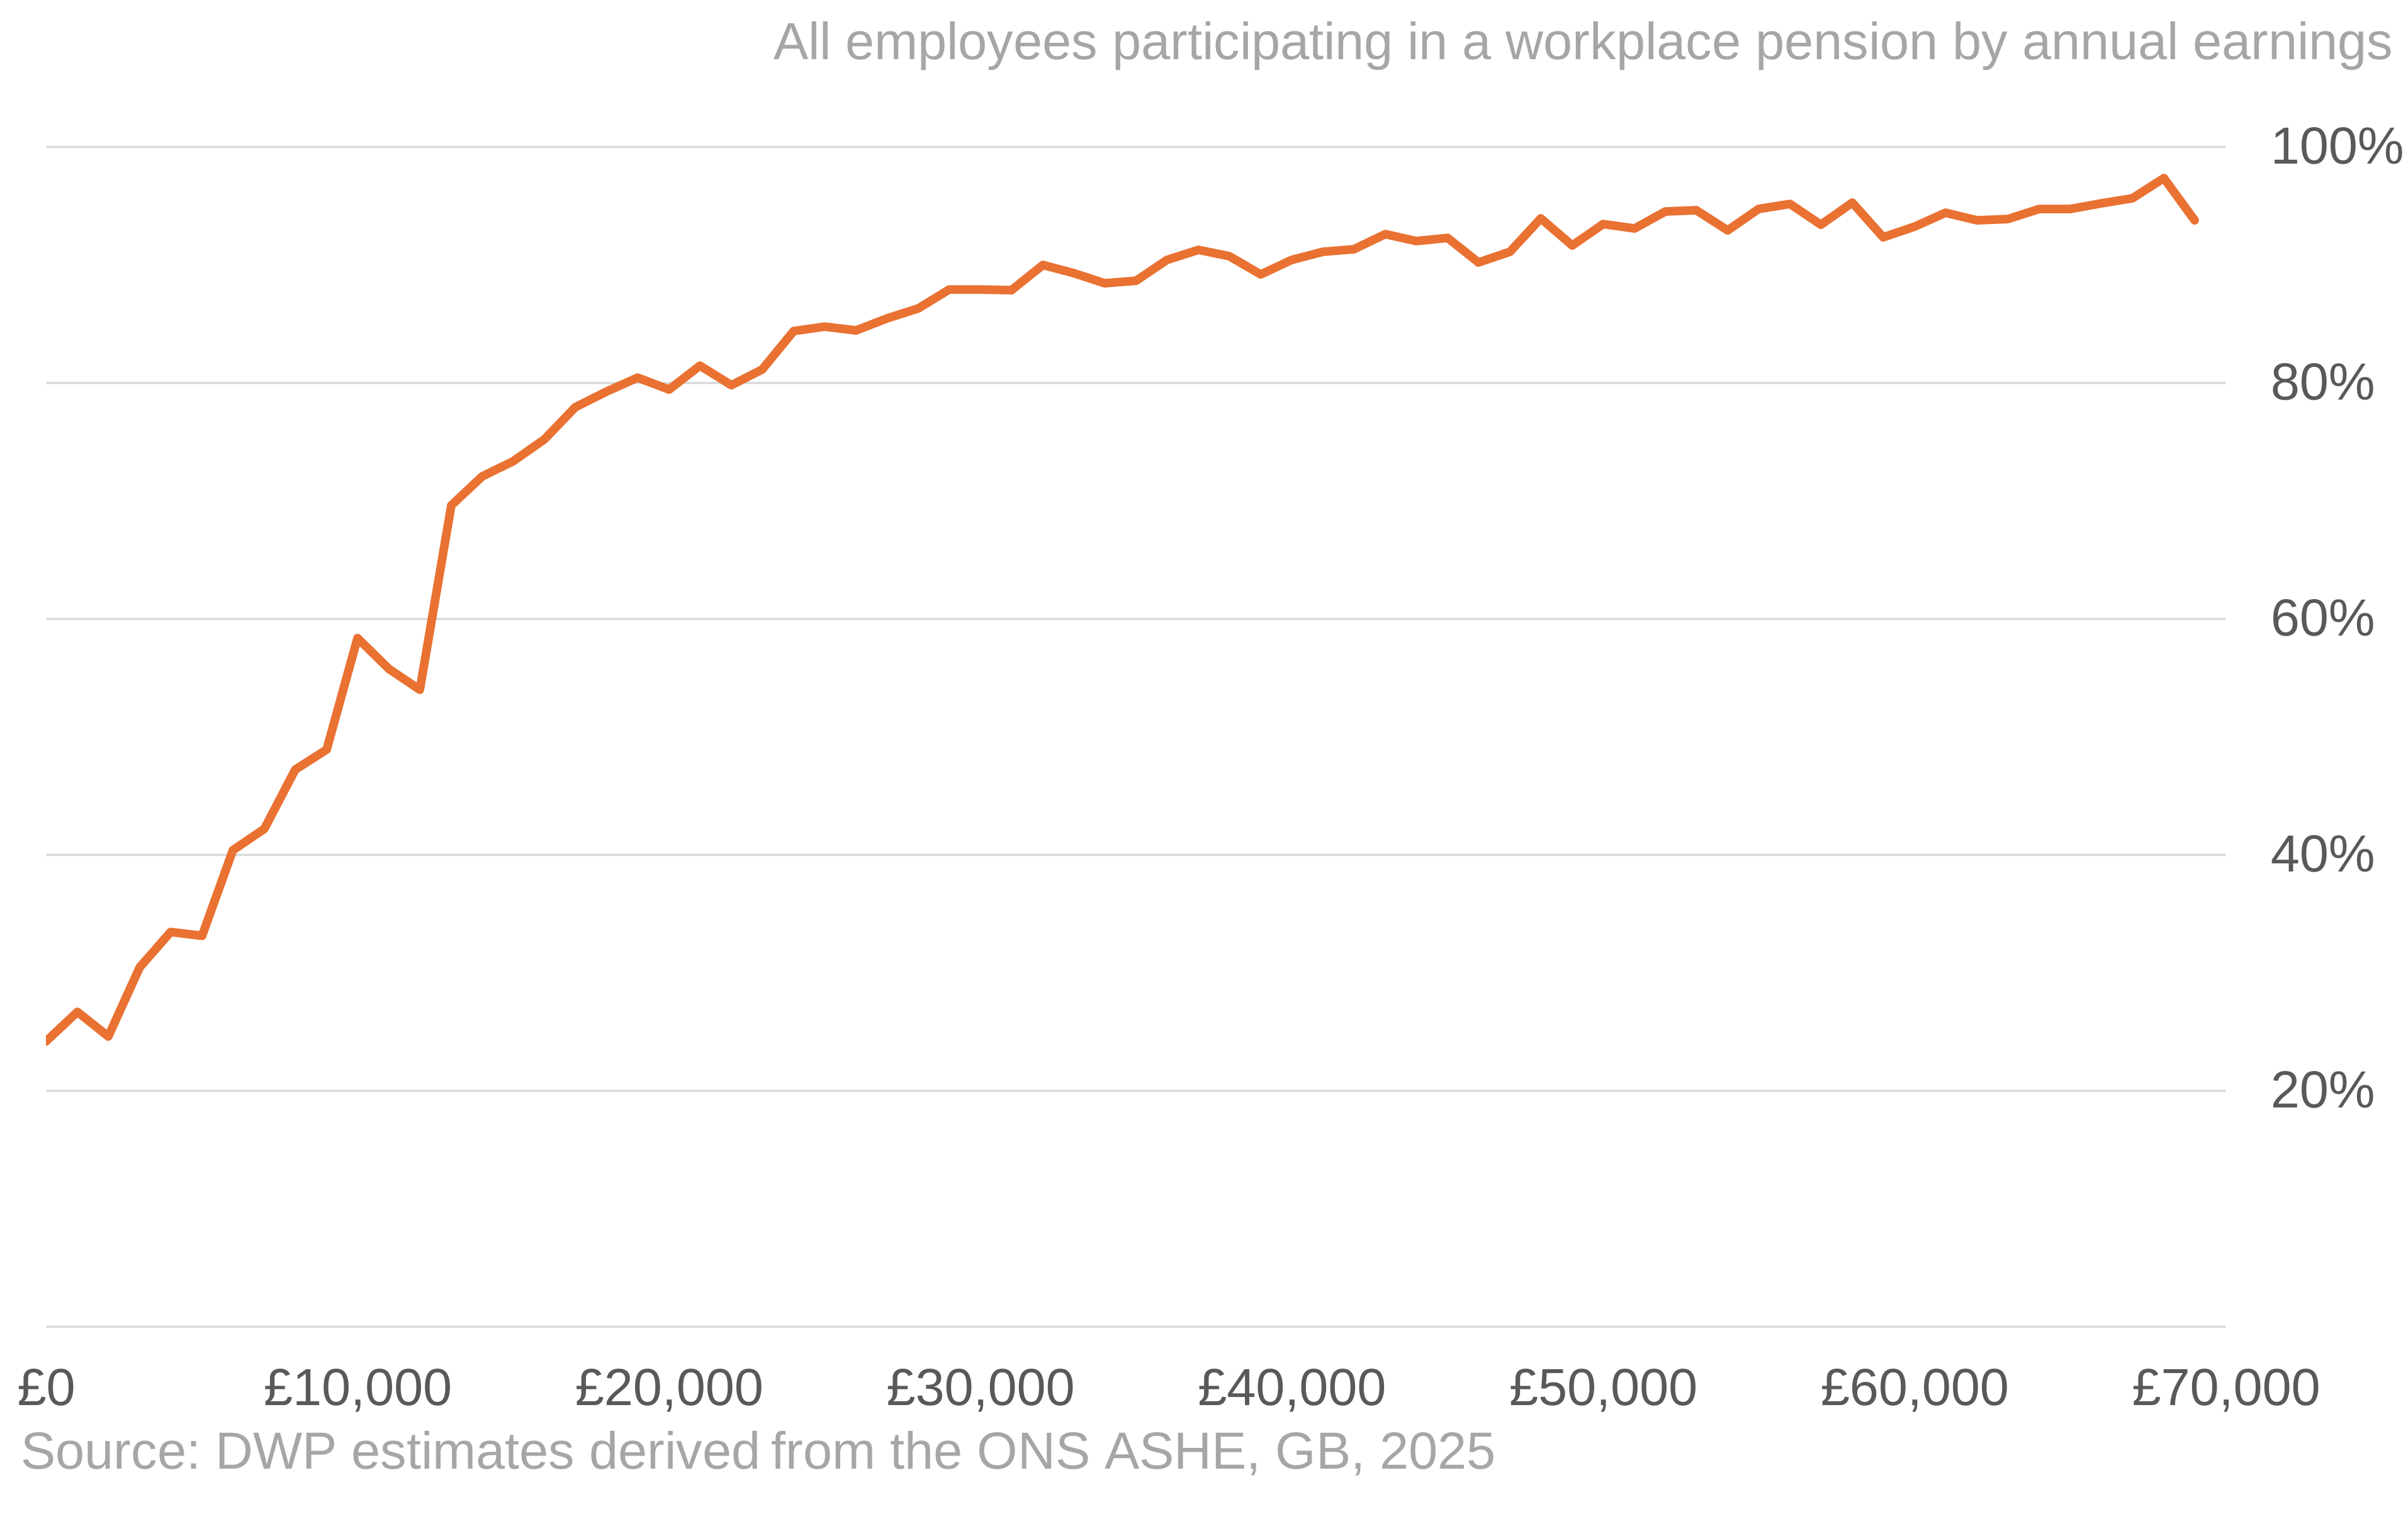
Workplace pension participation increases with annual earning levels, appearing to stabilise when earnings reach around twenty thousand. There is also a clear shift in participation either side of the £10,000 trigger - the point at which individuals become eligible for Automatic Enrolment.
Figure 3: All Employee pension participation rate by annual earnings, 2025
2. Trends in Workplace Pension Saving
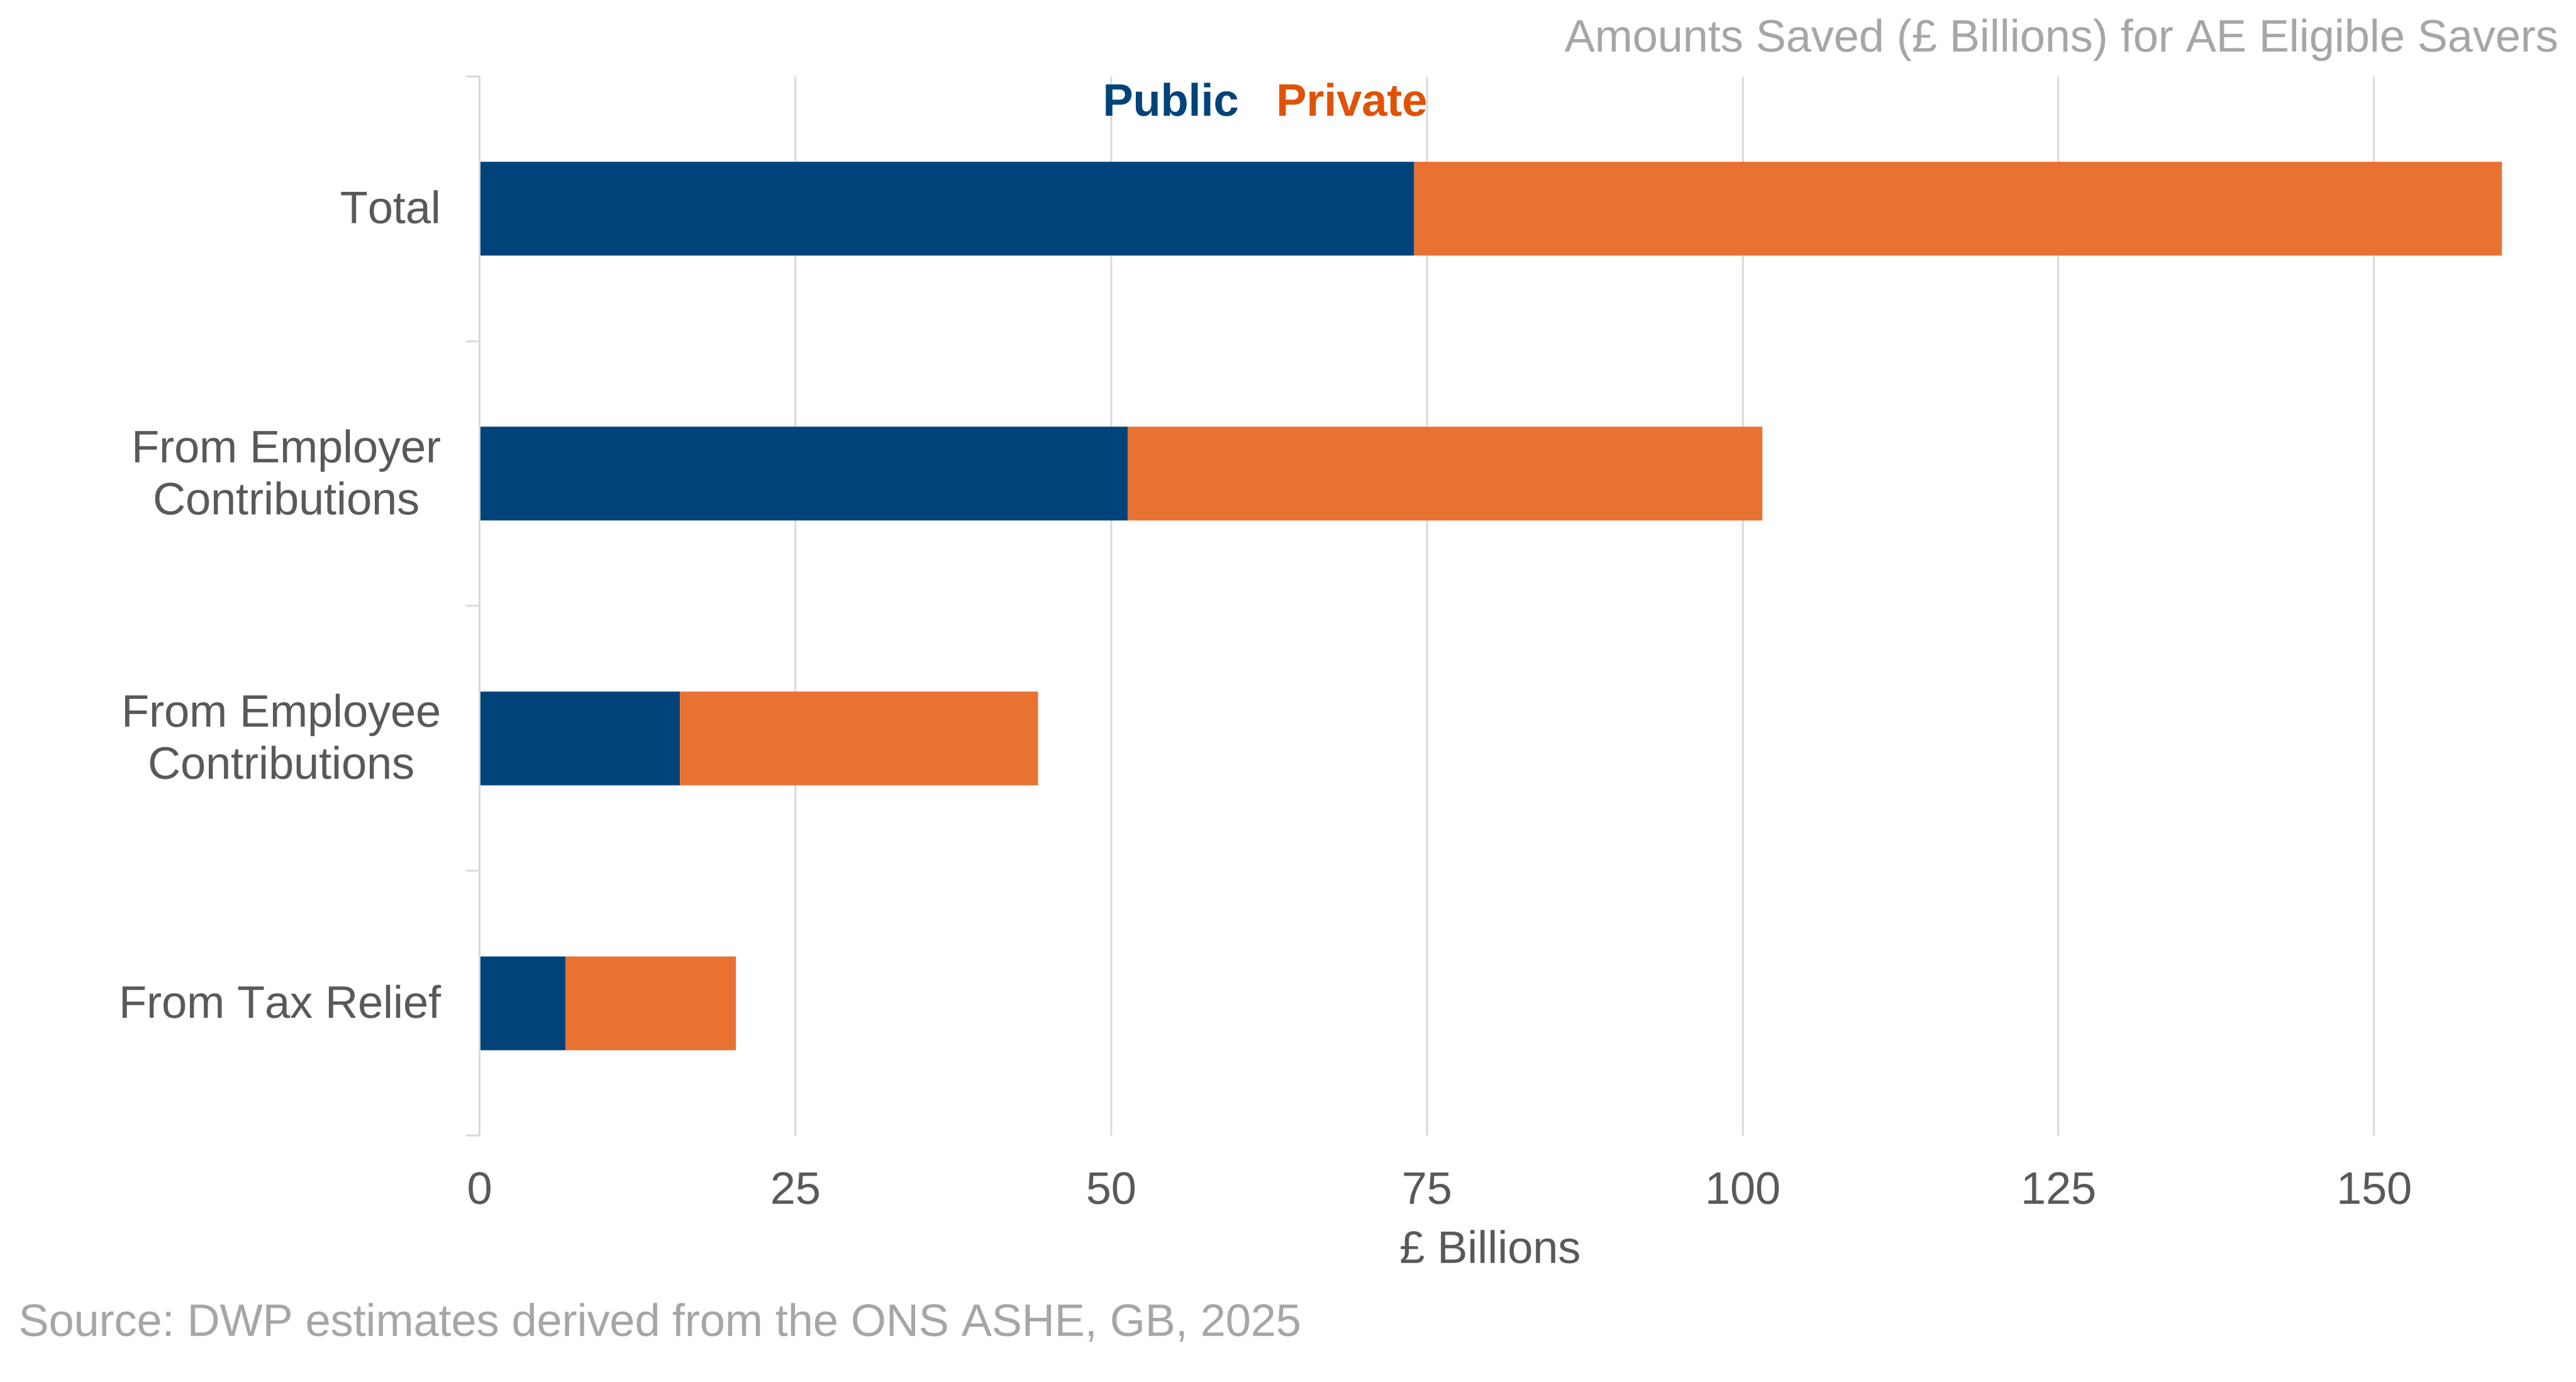
Total annual workplace pension savings for eligible savers was £166.1 billion in 2025. This is a £63.5 billion real terms increase compared to 2012 (in 2025 earnings terms).
Overall in 2025, contributions by employees accounted for 27% of saving, with employer contributions accounting for 61%, and income tax relief on the employee contribution the remaining 12%. However, there are noticeable differences in the distribution of contributions when comparing across the private and public sector.
Estimates of amounts saved can be found in the accompanying tables 2.1-2.2, however due to changes across years in the validation and cleaning of pension saving data, comparison of recent year-to-year changes should be treated with caution.
Figure 4: Amounts saved for eligible employees in 2025
3. Timely Monitoring of Pension Trends
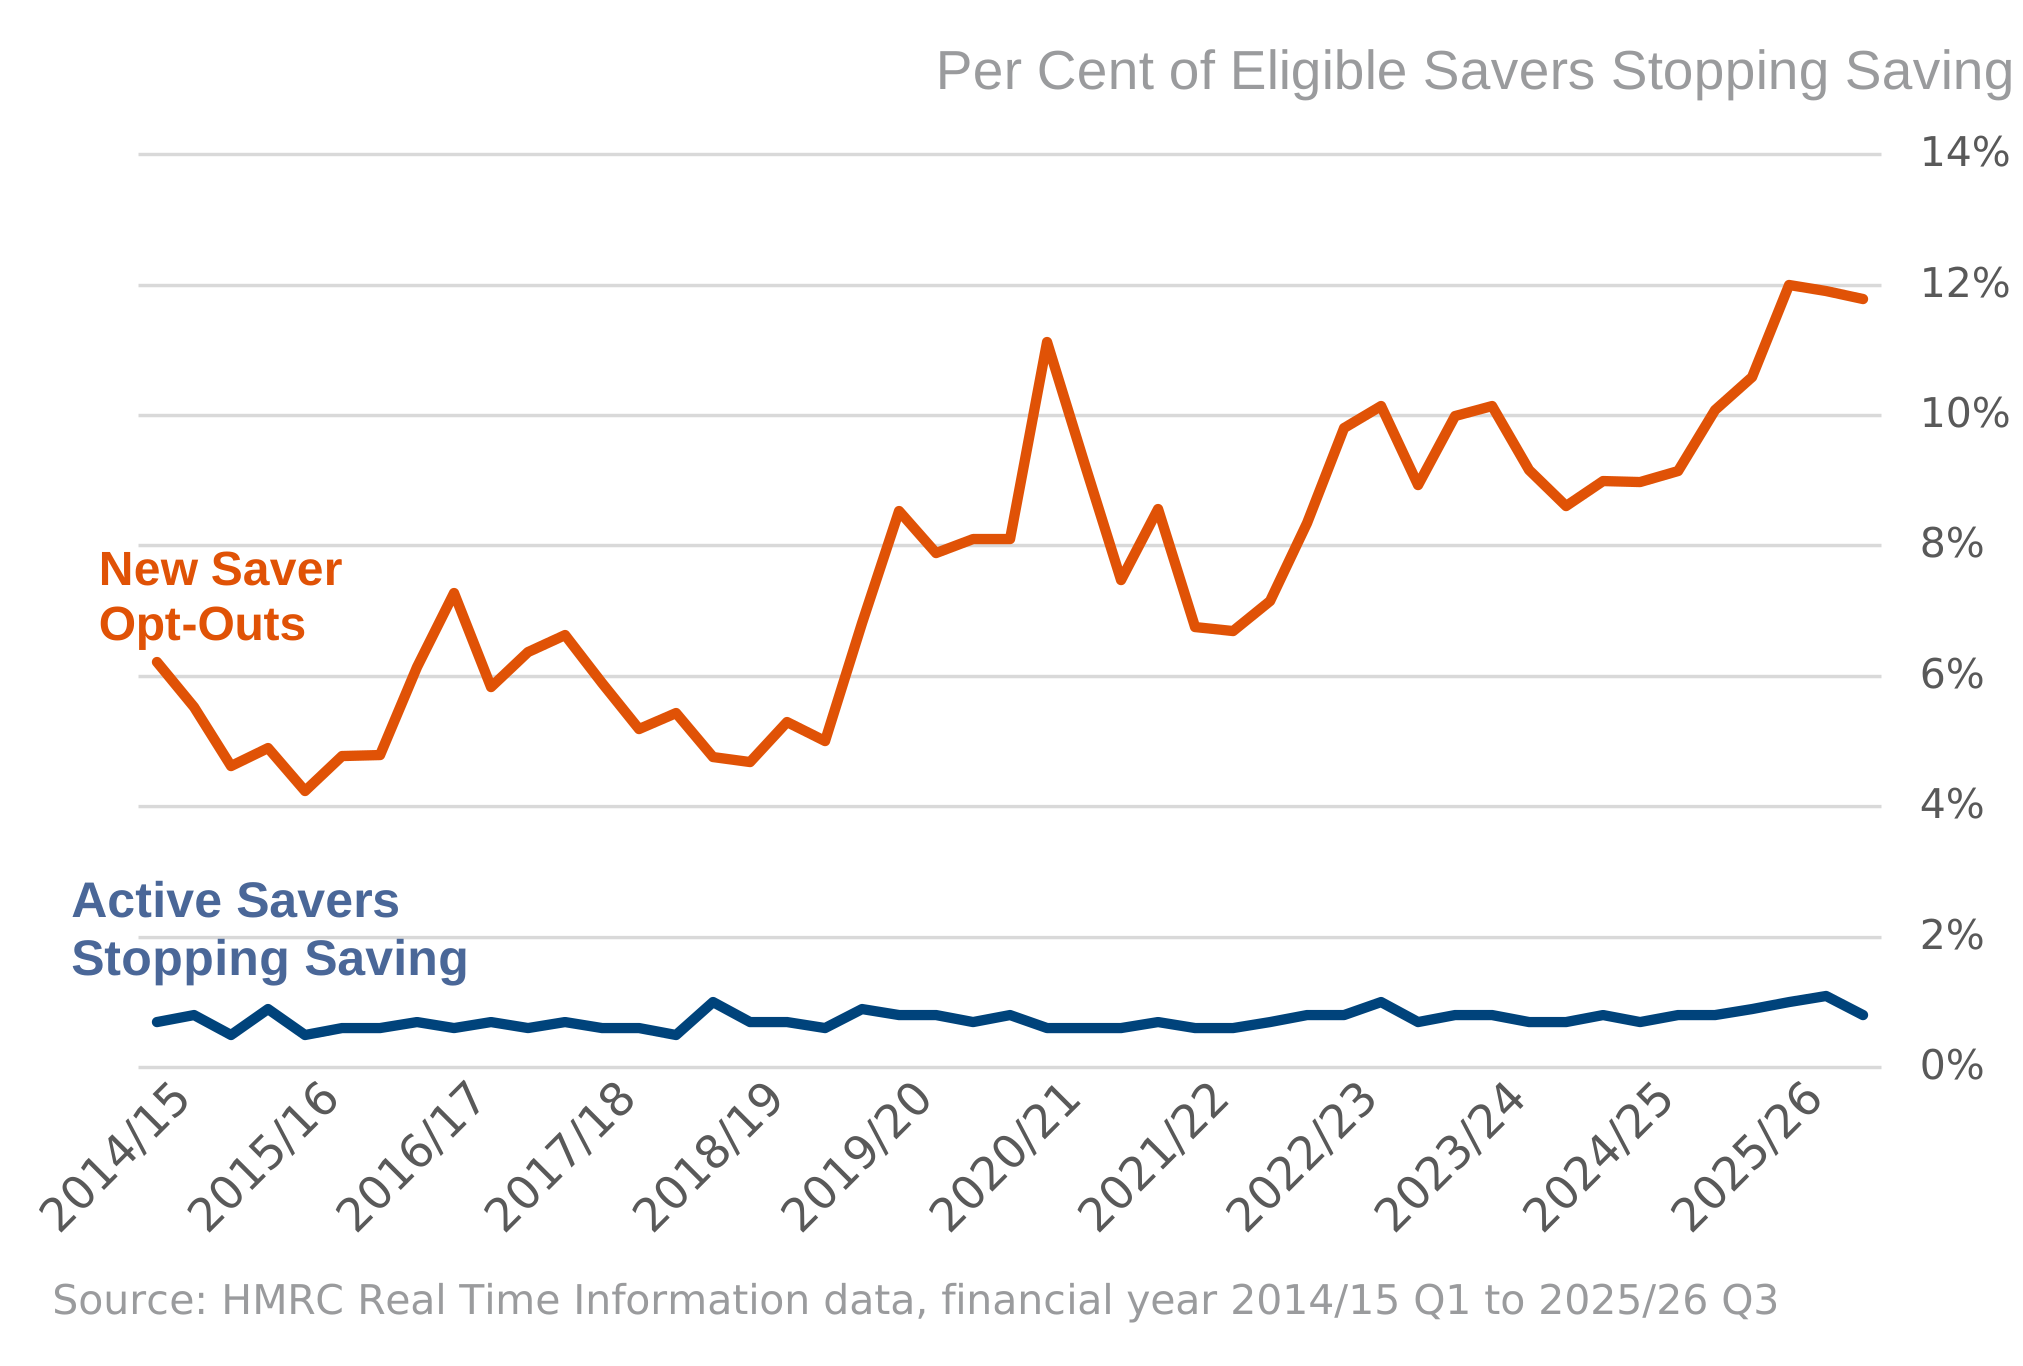
The number of active savers who stop saving each quarter as a proportion of total active savers has been broadly stable over multiple years.
The number of people who have newly started saving and actively opted out as a proportion of newly started savers has proven to be more volatile in recent years, perhaps driven by Covid-19 and periods of higher cost-of-living. However, in the last year, this has also risen to around 11-12%.
To examine across timelier indicators of pension saving, aggregated data from several pension providers is also included in the accompanying tables which finds similar rates of opt outs and stopping saving. From both sources, recent data (tables 3.1a – 3.4) show small upward trends.
Figure 5: Stopping saving and opt-out rates to financial year 2025 to 2026 Q3
4. Trends in Pension Withdrawals
Automatic Enrolment has increased the number of pension savers over the last 13 years. As a result, there is an increase in the number of people accessing a pension. The publication includes additional details on the number and type of pension being accessed. There are two types of workplace pension:
1. Defined Contribution – a pension pot based on how much is paid in and investment returns.
2. Defined Benefit – a pension based on your salary and how long you’ve worked for your employer.
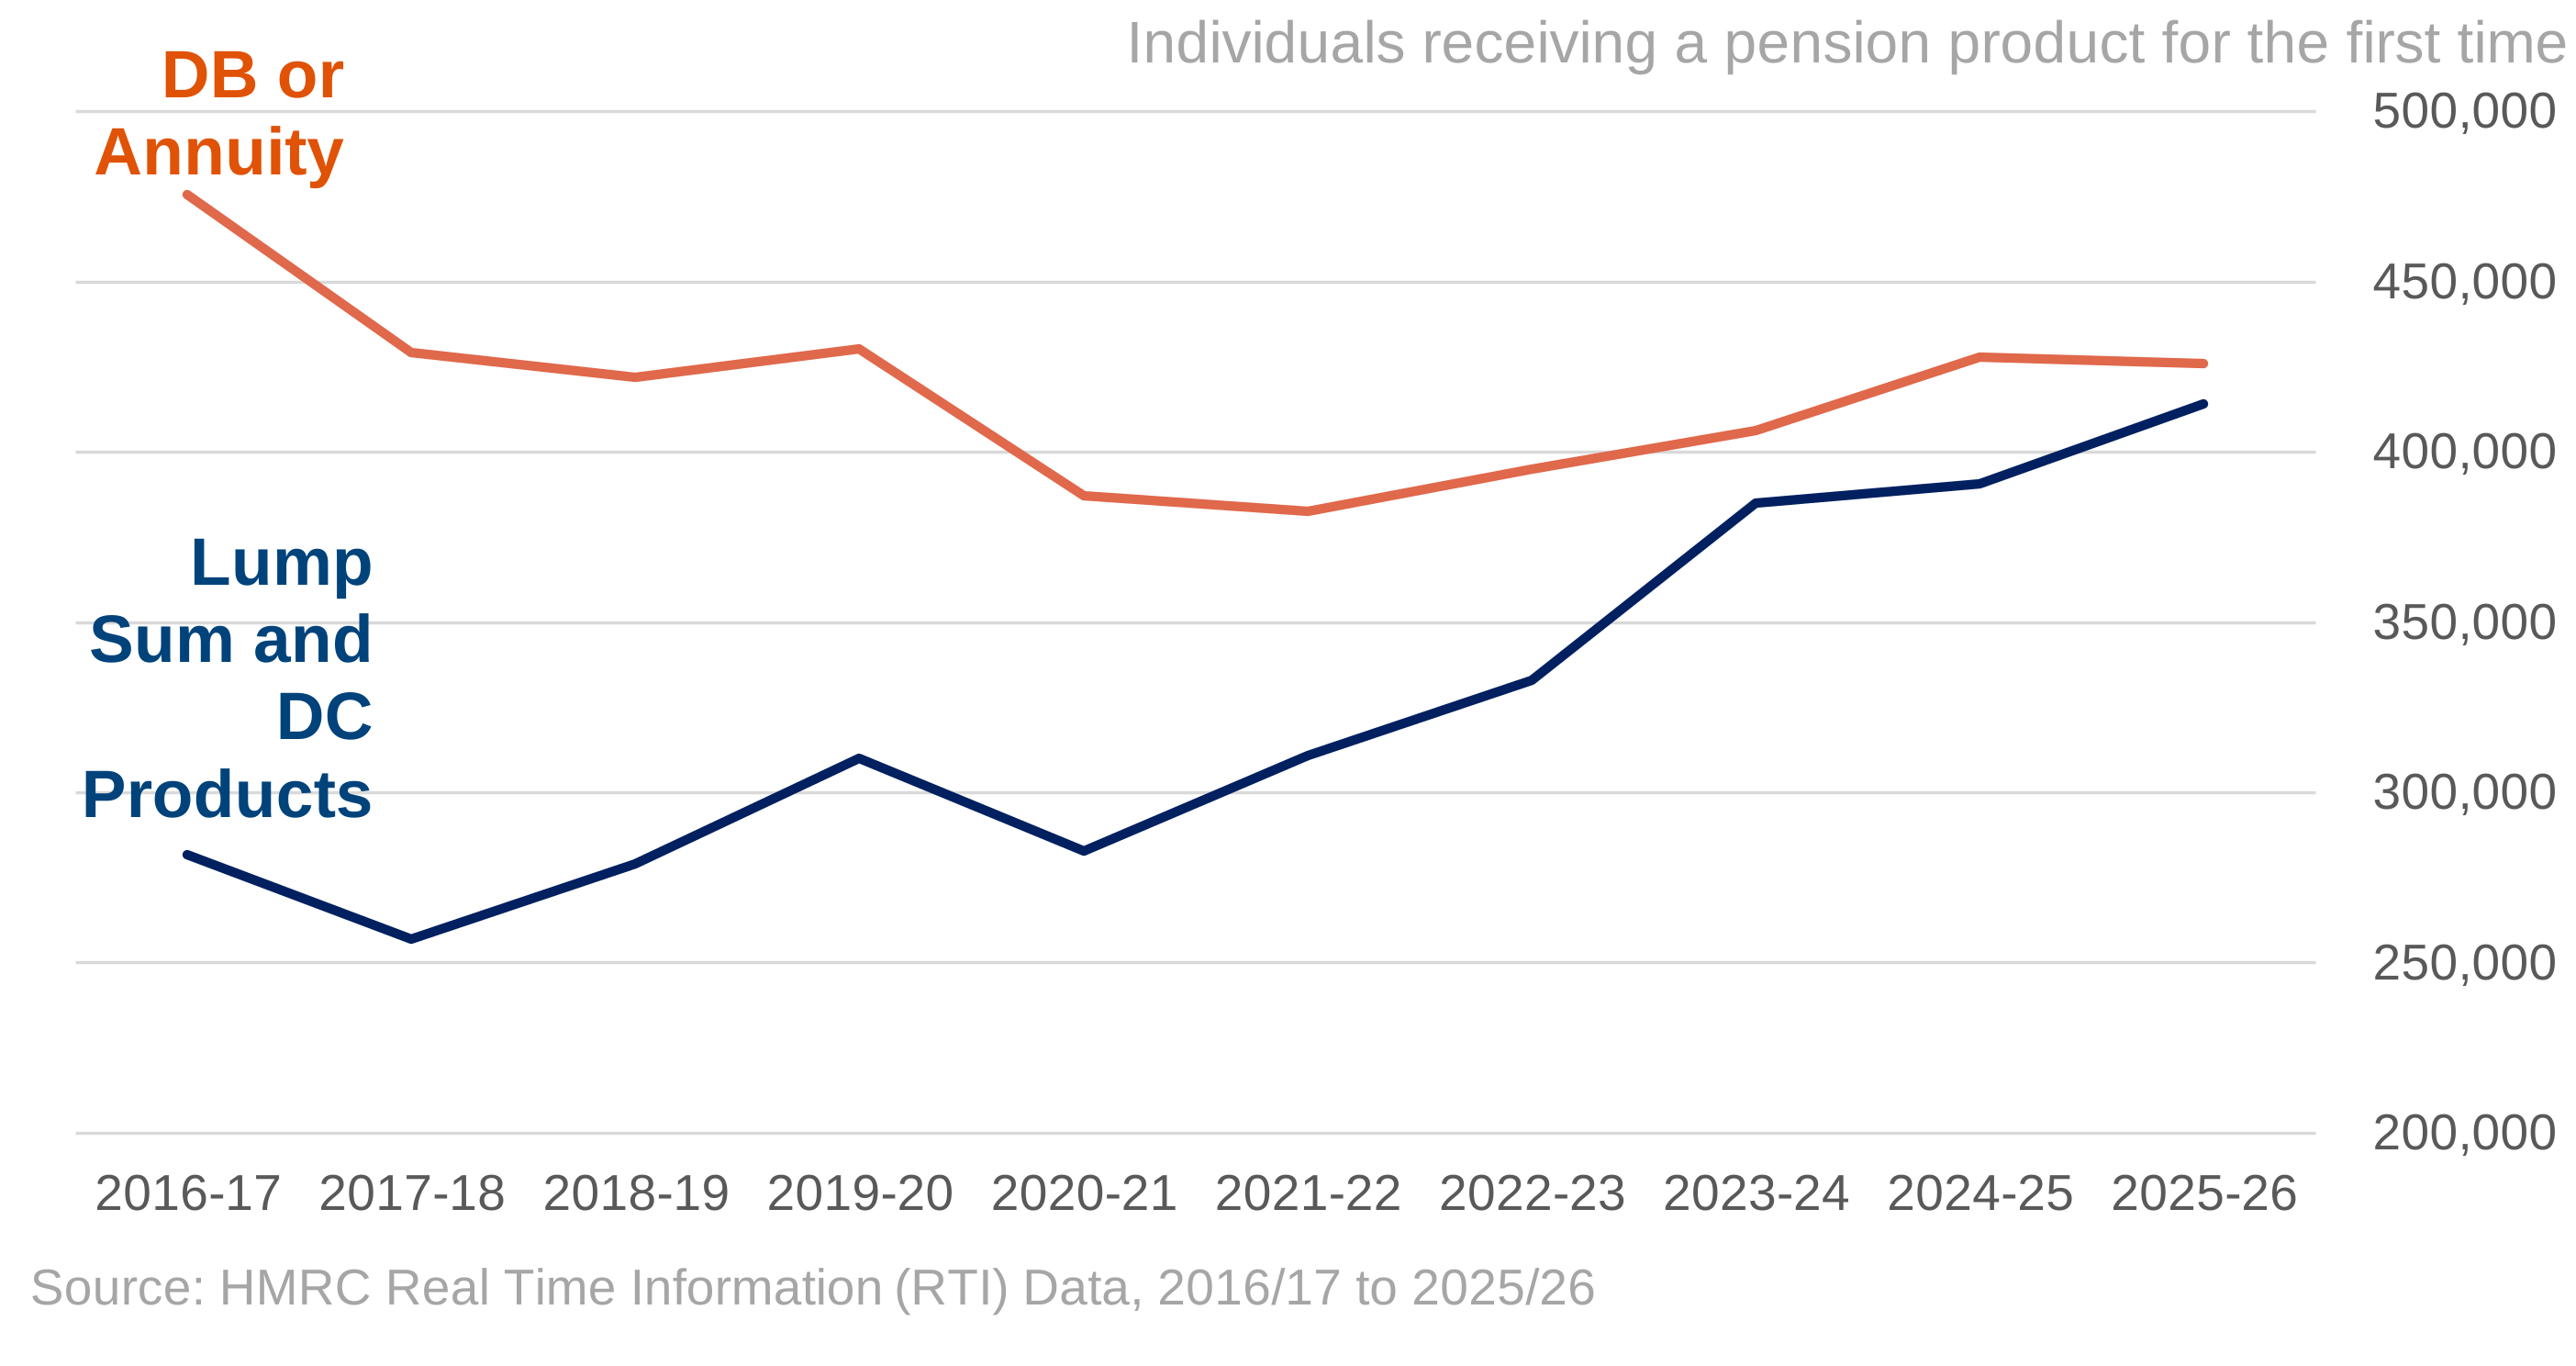
Overall, the vast majority, 94%, of the 12.9million individuals in receipt of a private pension payment in 2025/26 are in receipt of a Defined Benefit or an annuity. However, this is slowly changing. When assessing private pensions accessed for the first time, the proportion receiving a lump sum or other Defined Contribution product has risen from 37% (280,000) in the 2016/17 financial year to 49% (410,000) in the 2025/26 financial year.
Further statistics on those in receipt of a private payment pension can be found in the accompanying tables 4.1, 4.2, 4.3, covering gender and age bands, as well as private pension payments in the same financial year as employment income.
Figure 6: Private pension withdrawals for those accessing for the first time, by product type to financial year 2025 to 2026
About these statistics
Automatic Enrolment (AE) was introduced in 2012 to help address the decline in private pension saving and to make long-term saving the norm. It aims to increase workplace pension saving in the UK and forms part of a wider set of pension reforms designed to enable individuals to achieve financial security in retirement.
Statistics within this release allow continued evaluation of the success of AE in increasing both the number of savers, and the amount of savings. To continue understanding the role of AE on individual savers, this year the publication has further expanded decumulation tables to the types of pension products accessed by age and gender, and opt-out and stopped savings tables by age, gender and earnings
ONS Annual Survey of Hours and Earnings (ASHE) is the principal data source of information on participation and amounts saved. ASHE is a key source of information on workplace pensions in GB as it collects information on all types of workplace pension schemes. The survey results are used widely to monitor the impacts of pension reforms.
Supplementary data sources used include DWP Family Resources Survey (FRS) for information on ethnicity, disability, and economic status breakdowns in participation (tables 1.10,1.11,1.12). FRS collects information on the income and circumstances of individuals living in a representative sample of private households in the United Kingdom.
HMRC Real-Time Information (RTI) data provides information on stopping saving and contributions at monthly intervals (tables 3.1a, 3.1b), and also information on private pension withdrawals (tables 4.1- 4.3). RTI is HMRC’s reporting system for income taxed via Pay-As-You-Earn (PAYE) in the United Kingdom. The information is provided by employers and pension providers, with each submission within RTI relating to a payment to an employee or occupational pension recipient.
Alongside these, data supplied to DWP by a number of pension providers is also utilised (tables 3.2 – 3.4), having been anonymised and aggregated following receipt for the purpose of information on stopping saving and contributions. Throughout this report eligible employees are defined as employees who meet the automatic enrolment age and earnings criteria in that year unless otherwise stated. Full details of the data sources, their key assumptions, limitations and definitions are available in the background information and methodology note published alongside this statistics release.
Estimates of the Gender Pension Gap were published in July 2025. This used the Wealth and Assets Survey data source.
Other pension statistics are also available containing more information, for example:
1. HMRC publish information on private pension statistics.
2. Financial Conduct Authority publish information on Retirement income market data.
3. DWP’s analysis of Analysis of Automatic Enrolment saving levels.
Contact details
Feedback and queries about the statistics can be sent to: workplacepensions.statistics@dwp.gov.uk
For media enquiries please contact the DWP press office.
Published: 30 July 2026
Next edition: Summer 2027