Workplace pension participation and savings trends of eligible employees: 2009 to 2022
Published 22 November 2023

© Crown copyright 2023
This publication is licensed under the terms of the Open Government Licence v3.0 except where otherwise stated. To view this licence, visit nationalarchives.gov.uk/doc/open-government-licence/version/3 or write to the Information Policy Team, The National Archives, Kew, London TW9 4DU, or email: psi@nationalarchives.gov.uk.
Where we have identified any third party copyright information you will need to obtain permission from the copyright holders concerned.
This publication is available at https://www.gov.uk/government/statistics/workplace-pension-participation-and-savings-trends-2009-to-2022/workplace-pension-participation-and-savings-trends-of-eligible-employees-2009-to-2022
This is the latest release of statistics on Workplace Pension Participation and Savings Trends between 2009 and 2022. This is the tenth edition in the series and provides additional information on the trends following the COVID-19 period and the potential impacts of cost-of-living on pension saving and contributions.
After years of growth in participation during the roll-out of automatic enrolment, participation rates have stabilised. Trends in stopping saving and contributions have remained relatively stable during and after the COVID-19 period as well as during a period of increased cost-of-living.
Introduction
Automatic enrolment was introduced in 2012 to help address the decline in private pension saving and to make long-term saving the norm. It aims to increase workplace pension saving in the UK and forms part of a wider set of pension reforms designed to enable individuals to achieve financial security in retirement.
The roll-out of automatic enrolment was completed following implementation of the contribution increase in April 2019.
Two key measures for evaluating automatic enrolment:
- increasing the number of savers, by monitoring trends in workplace pension participation (seen in Section 1)
- increasing the amount of savings, by monitoring trends in workplace pension saving (seen in Section 3)
Section 4 provides more timely information on trends in stopping saving and contributions for evaluating more recent and timely information on pension saving.
ONS Annual Survey of Hours and Earnings (ASHE) is the main data source used in this publication and is the key source of information on participation and contributions.
Supplementary data sources used include DWP Family Resources Survey for information on ethnicity, disability, and economic status breakdowns in participation, and HMRC Real-Time Information and data from a selection of private pension providers for information on stopping saving and contributions at monthly intervals.
Throughout this report eligible employees are defined as employees who meet the automatic enrolment age and earnings criteria in that year. See the Background Information and Methodology Note for full definitions.
We published estimates of the Gender Pension Gap earlier in the year.
Main Stories
1. What is the current picture of Automatic Enrolment?
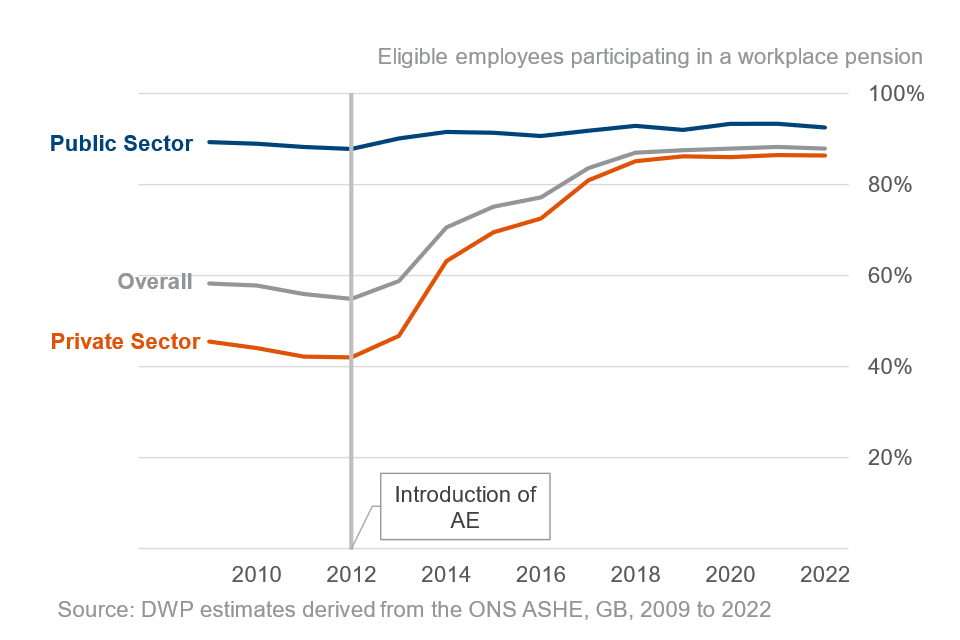
Overall, 88 per cent of eligible employees (20.4 million) were participating in a workplace pension in 2022. Overall trends in participation have increased since 2012, driven by the private sector while public sector participation has remained high.
Figure 1: Eligible employee participation rate to 2022
Trends across all breakdowns broadly reflect this overall picture of participation in the public and private sector.
Since 2012, many gaps in participation have narrowed – the largest increases have been seen in Agriculture & Fishing and Distribution, Hotels & Restaurants industries and among small private employers (5 to 49 employees).
Most groups have seen trends in participation stabilise between 2018 and 2022.
There are some gaps that remain in 2022 and there is relatively low participation for some eligible groups, such as around 59 per cent for employees of micro employers and below 75 per cent for Pakistani and Bangladeshi, and Indian employees (ethnicity is calculated using a 3-year average).
ONS Employee Workplace Pensions in the UK also includes information on pension participation rates for all employees, both eligible and non-eligible. This publication also uses ASHE data and shows a similar trend in participation for all employees as we have observed for eligible employees. Workplace pension participation of UK employees increased between 2012 and 2021 up from 47 per cent to 79 per cent of UK employees, stabilising in recent years.
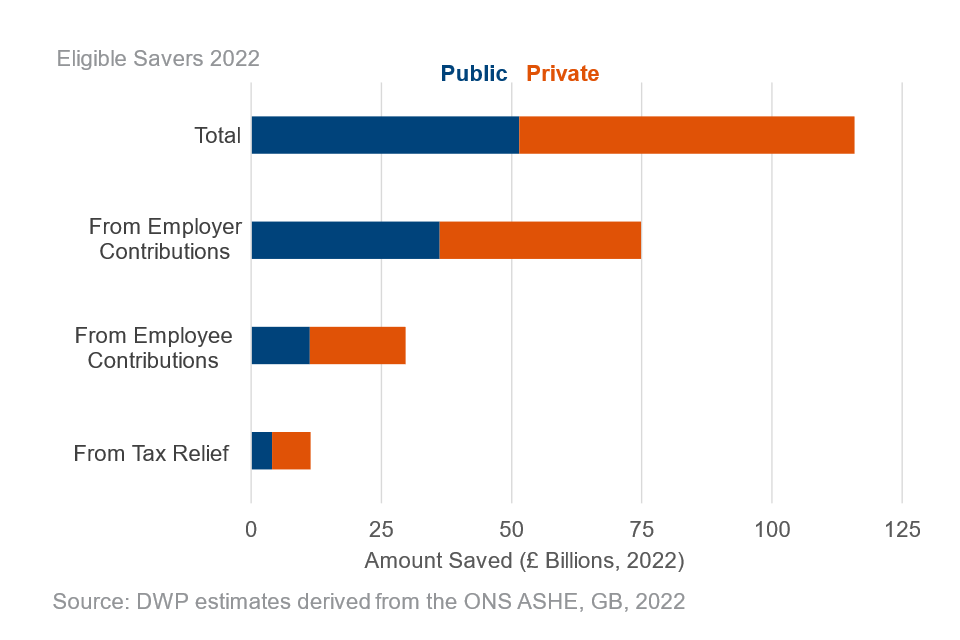
Total annual workplace pension savings for eligible savers was £115.9 billion in 2022. While this represented an increase in savings in cash terms from 2021 (around £1.2bn), when adjusted to 2022 earnings levels, this represents a real terms fall (around £5.6bn).
Figure 2: Amount saved by eligible employees in 2022
2. What are the more recent trends in pension saving?
HMRC RTI data shows the proportion of savers making an active decision to stop saving in 2022 to 2023 remains low and similar to previous years at less than 1%.
Figure 3: Stopping saving rates to financial year 2022 to 2023
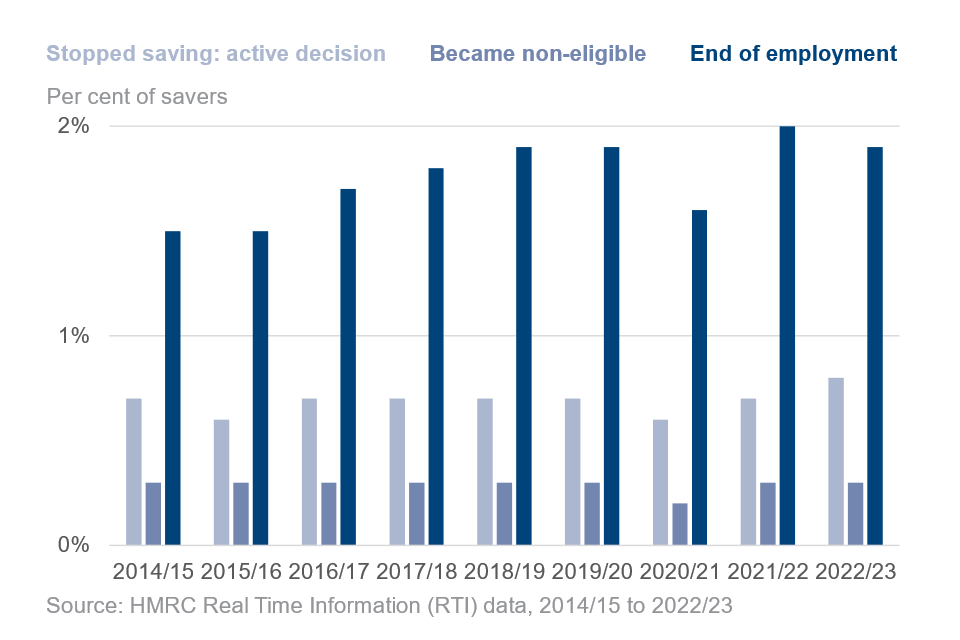
In the financial year 2022-23, the percentage of workplace pension savers stopping saving following an active decision to stop saving was around 0.8%; similar to last year at around 0.7%.
Figure 4: Employee pension contribution rates with pay within AE thresholds to Q4 (Jan to Mar) 2022 to 2023
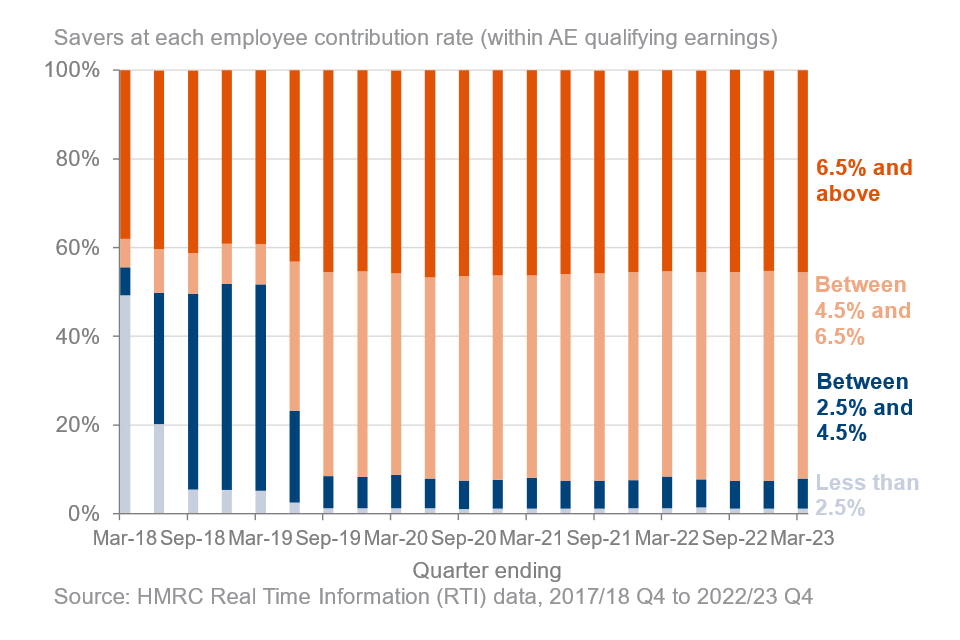
In April 2018 the minimum contribution rates under AE increased from 4% to 6% of earnings within the qualifying earnings band (QEB) (including an increase in the minimum employer contribution from 1% to 2%). In April 2019 the minimum contribution rates increased again from 6% to 8% within the QEB (including an increase in the minimum employer contribution from 2% to 3%). HMRC RTI data shows that this led to an increase in the proportion of employees contributing at least 4.5% of their earnings within the QEB since April 2019. Since Q4 2019/20 the proportion of employees contributing at least 6.5% of their earnings has largely stayed the same at around 46%.
What you need to know
Automatic enrolment mandates employers to provide a workplace pension for all workers meeting certain Workplace pensions criteria. See the Background Information and Methodology Note for detailed information about eligibility and contribution rates.
Notes
The analysis includes members of all qualifying workplace pension schemes: occupational pension schemes, group personal pensions (GPPs), and group stakeholder pensions (GSHPs). All analysis is based on eligible employees and uprated using ONS Average Weekly Earnings values.
In the 2022 data for the 2023 publication, there were a small number of records (around 3%) in the ASHE data which had missing pension contribution information (this does not impact pension participation variables). To amend these missing values, we have applied a robust methodology to estimate pension saving levels using historical information from the same individual. Where no historical information can be found, we have imputed values using similar records from the same year. More detail can be found in the Background Information and Methodology Note.
Subgroup analysis in this publication does not include an assessment of which factors are the primary drivers of differences in participation across different subgroups.
Numbers have been suppressed where the sample size is small. Charts show the percentage of eligible employees participating in a workplace pension unless otherwise stated. We welcome feedback on the material provided to improve future releases.
All the information presented in the charts and figures is included in the accompanying excel tables.
1. Trends in Workplace Pension Participation
The proportion of private sector eligible employees participating in a workplace pension increased sharply between 2012 and 2018 before stabilising. Public sector participation remains high.
Figure 5: Eligible employee participation rate to 2022
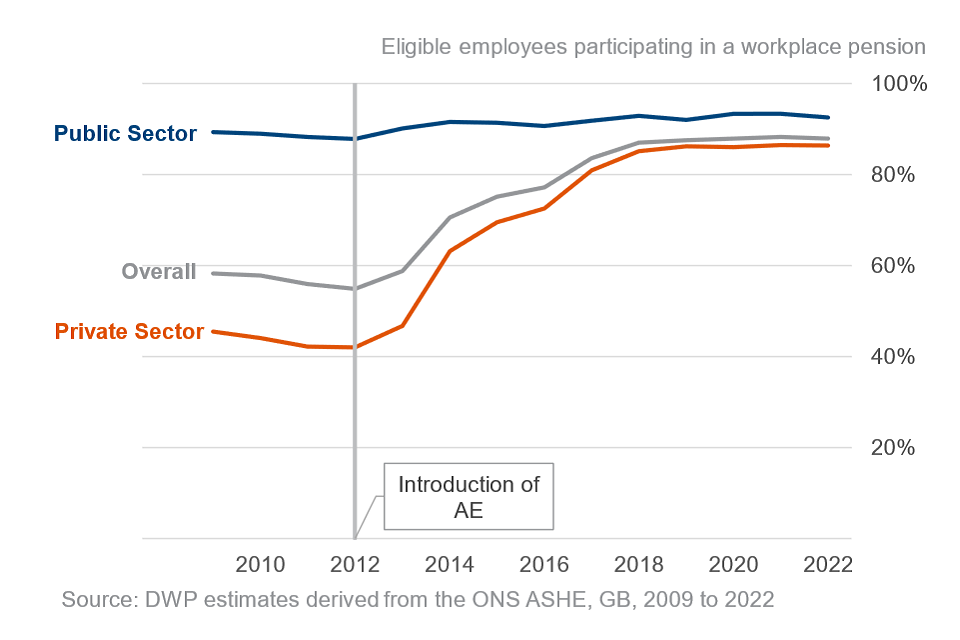
Overall participation of eligible employees is 88 per cent (20.4 million eligible employees), with this rate unchanged since 2019.
Across the whole economy, there was a general downward trend in workplace pension participation among eligible employees between 2009 and 2012, from 58 per cent (11.4 million eligible employees) to a low of 55 per cent (10.7 million eligible employees). From 2012 to 2022, the number of eligible employees participating in a workplace pension has increased by 9.7 million to 20.4 million, showing the positive impact of the workplace pension reforms to date.
The driver for the overall increase is the private sector. Since 2012, private sector participation has risen by 44 percentage points, with 86 per cent of eligible employees participating in 2022 (15.0 million eligible employees). The gap between public and private sector participation has narrowed to 6 percentage points in 2022 having been as high as 46 percentage points in 2012.
The participation rate of eligible employees in the public sector fell slightly from 93 per cent of eligible employees in 2021 to 92 per cent of eligible employees in 2022 (5.4 million eligible employees). Public sector participation remains higher compared to the private sector. The participation rate of eligible employees in the public sector has increased by 4 percentage points since 2012.
1.1 Employer size, by sector
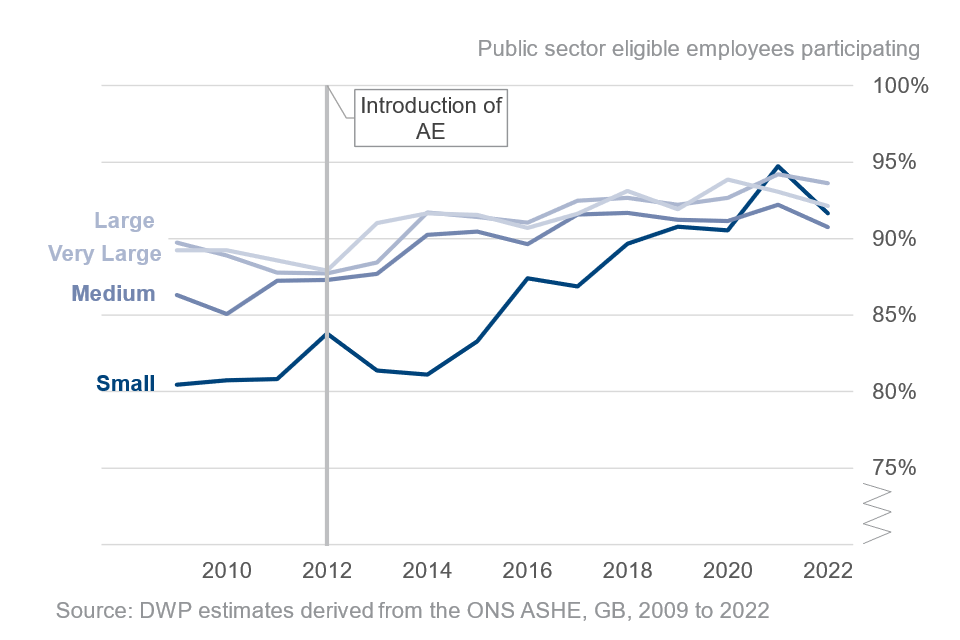
After large increases since 2012, participation rates in the private sector have stabilised for each employer size band but persistent gaps remain for small and micro private sector employers.
Figure 6 and 7: Participation by employer size to 2022
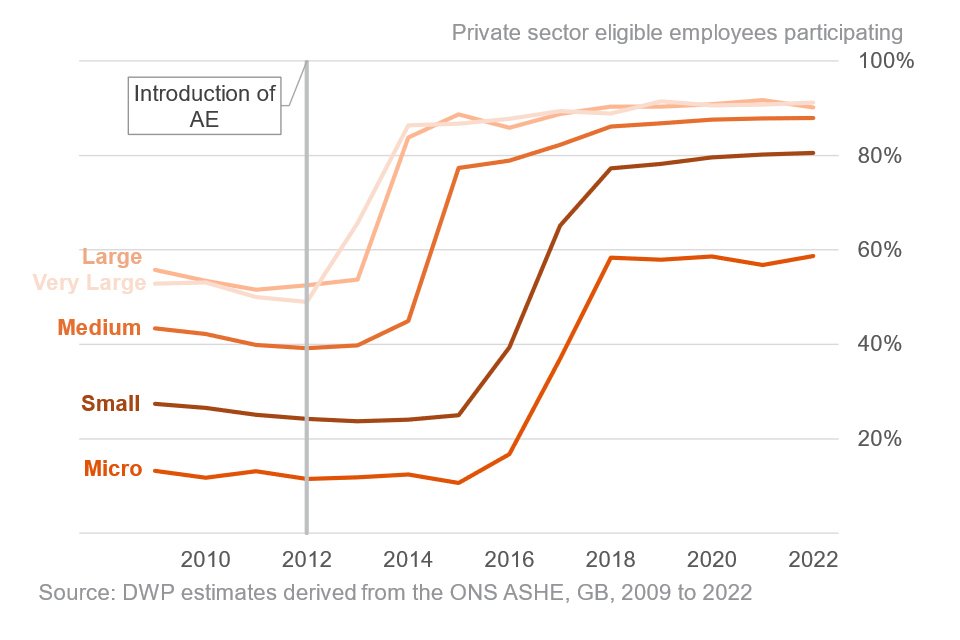
All employer sizes have seen large increases in eligible employee participation rates since the start of the relevant automatic enrolment staging date. Since the end of the staging period for each employer size band (with the exception of new-born employers coming into existence after April 2012), participation rates broadly stabilised.
The highest levels of both private and public sector participation in 2022 were seen in the larger employer bands. In the private sector, 91 per cent of eligible employees were participating in the very large employer band (5000+) and 90 per cent were participating in the large employer band (250 to 4,999 employees). In the public sector, participation rates of eligible employees in large and very large employer bands were 94 and 92 per cent respectively.
Participation rates among micro (1 to 4 employees) and small (5 to 49 employees) employers in the private sector have increased since 2012 to their current position of 59 per cent and 81 per cent respectively. However, there is a persistent gap in participation rates of these groups and other sized employers.
Greater gaps in participation among employer sizes persist in the private sector compared to the public sector. In the public sector participation rates have remained stable for most employer sizes. Since 2014, participation rates for small employers (5 to 49 employees) have increased, largely closing the gap in participation by employer size. Participation rates for micro employers (1 to 4 employees) in the public sector are not shown due to small sample sizes.
Staged implementation of automatic enrolment: The automatic enrolment duties were staged in between October 2012 and February 2018 by employer size, starting in October 2012 with the largest employers based on PAYE scheme size, to the smallest in 2017. New PAYE schemes between April 2012 and September 2017 were staged last, in 2017 and 2018. New PAYE schemes from October 2017 have immediate automatic enrolment duties.
1.2 Earnings, by sector
Higher earners continue to have higher participation rates for both sectors but the gap has narrowed.
Figure 8 and 9: Participation by earnings to 2022
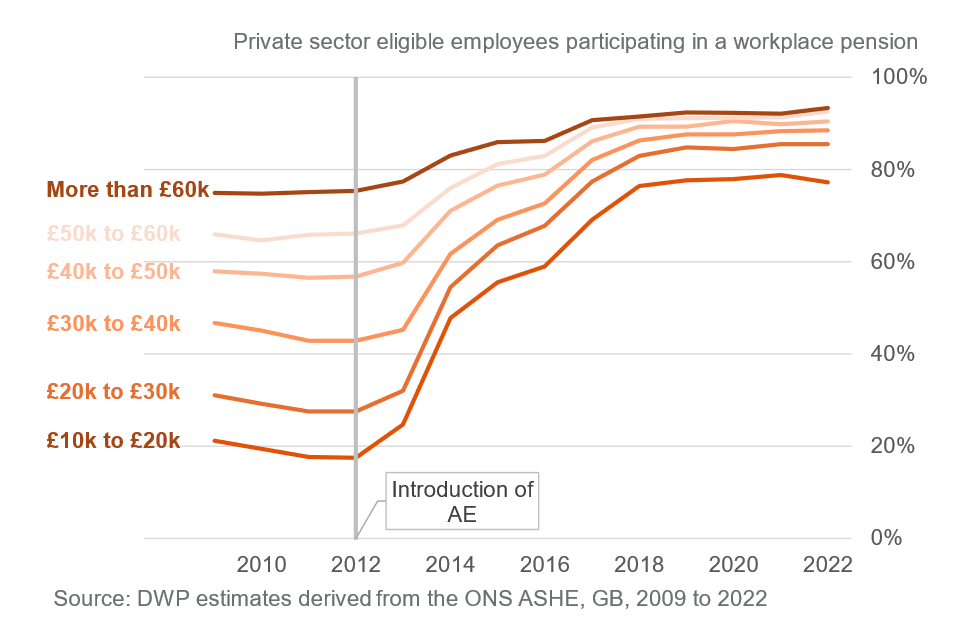
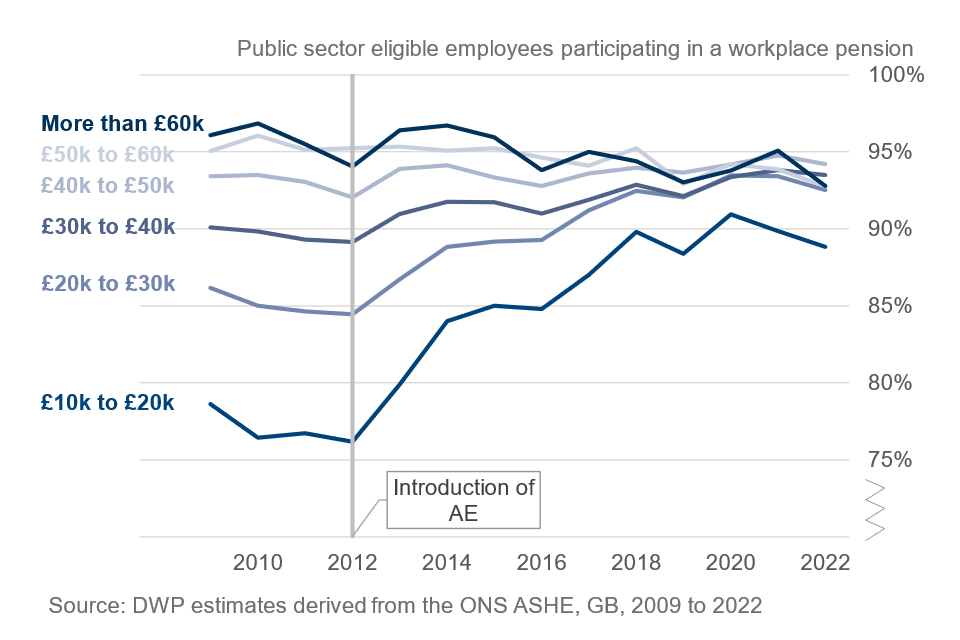
Across the whole economy the highest earners show the highest participation levels. In 2022, 92 per cent of eligible employees within the top three earnings band were participating in a workplace pension.
In the private sector the gap between the highest and lowest earners has narrowed since the introduction of automatic enrolment. The difference in participation rates between the highest and lowest earning groups was 58 percentage points in 2012 but has fallen to 16 percentage points in 2022.
In the public sector participation trends in higher earnings bands have been broadly stable since 2012 but larger increases have been observed in the lower earnings bands. The greatest increase was seen in the £10,000 to £20,000 earning band which rose by 13 percentage points between 2012 and 2022.
Note that all earnings bands are defined in terms of individuals’ gross annual earnings in 2022 terms.
1.3 Age, by sector
The gap in participation rates between age groups for both sectors has narrowed since 2012.
Figure 10 and 11: Participation by age to 2022

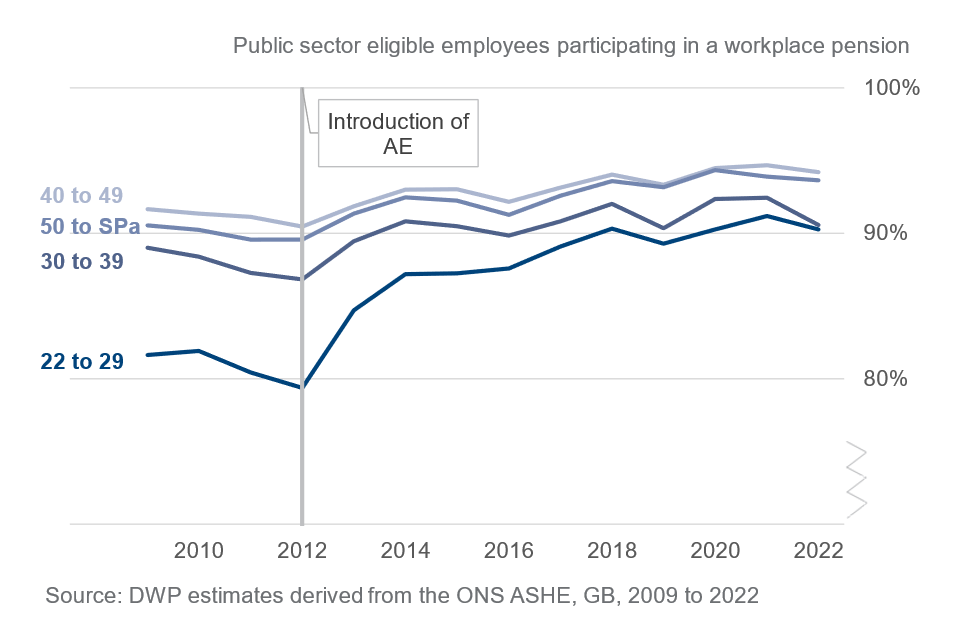
Across the whole economy participation rates for eligible employees in 2022 are highest for the 40 to 49 age group (90 per cent) and lowest for the 22 to 29 age group (85 per cent).
Since 2012, pension participation in the private sector has increased for all age groups. The largest increase was seen in the 22 to 29 age group, increasing from 24 per cent in 2012 to 84 per cent in 2022 (60 percentage point rise), and the pension participation gap between the youngest and oldest age groups has reduced since 2012 from 26 percentage points to only 2 percentage points in 2022.
Participation rates in the public sector remain high and broadly stable since 2014. Despite narrowing after 2012, there is a small but persistent gap between the youngest and oldest age groups of 4 percentage points in 2022.
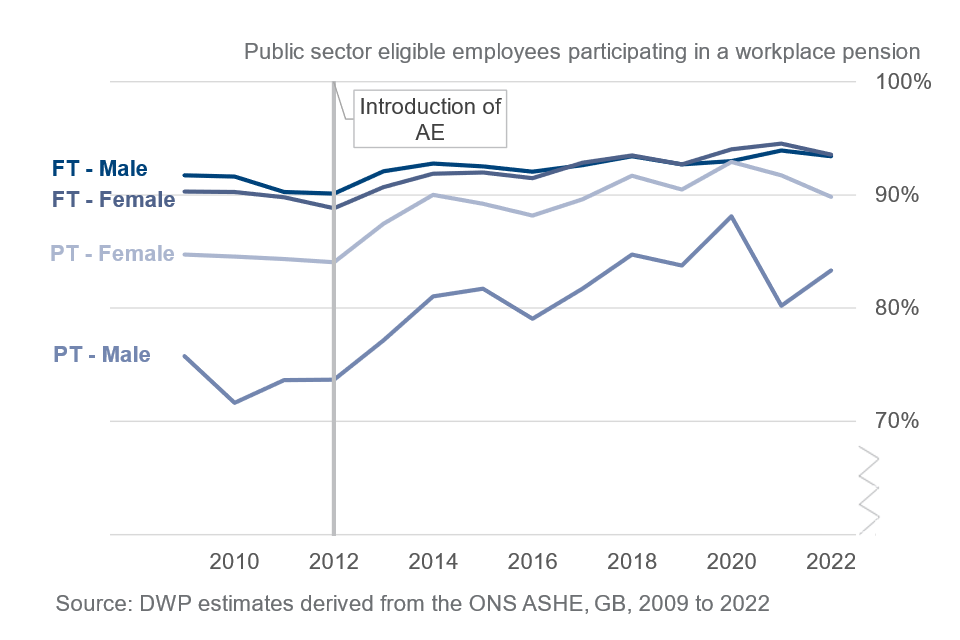
1.4 Gender and working pattern, by sector
The male and female participation rates in the private sector have equalised for full-time employees but gaps remain between full-time and part-time employees and male and female part-time employees.
Figure 12 and 13: Participation by gender and working pattern to 2022
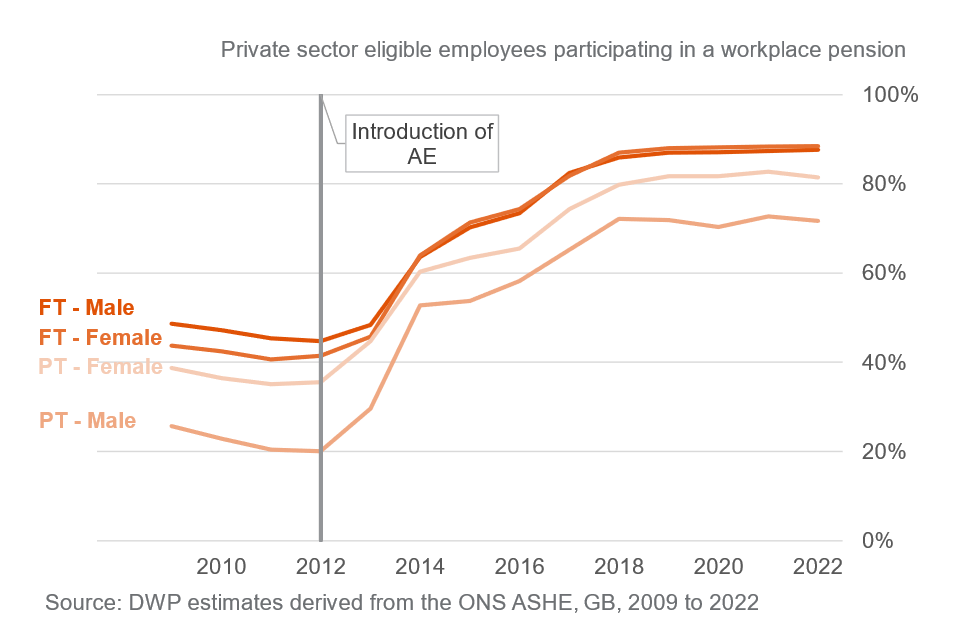
Across the whole economy there is only a small gap in participation rates by gender among full-time eligible employees in 2022 (89 per cent for male employees and 90 per cent for female employees). Among part-time eligible employees the gap is bigger: 84 per cent of female part-time employees are participating compared to only 74 per cent of male part-time employees.
In the private sector overall participation rates for male and female eligible employees were the same in 2022 (86 per cent) whereas in 2012, male employees had slightly higher participation rates (43 per cent compared to 40 per cent for female employees). The same trend of a narrowing gender gap since 2012 is seen among full-time employees in the private sector, and in 2022 the participation rate for both female and male full-time employees was 88 per cent. Among part-time employees the participation rate has remained persistently higher for female than male employees (81 per cent and 72 per cent respectively in 2022), although the rates for both genders have increased greatly since 2012.
In the public sector overall participation rates for both male and female eligible employees have remained stable and were 93 and 92 per cent respectively in 2022. Among full-time employees in the public sector, there was only a 1 percentage point difference between male and female employees (93 vs 94 per cent), while among part-time employees, the participation rate has remained persistently higher for female than male employees (90 and 83 per cent respectively in 2022).
1.5 Industry, by sector
All private sector industries have high participation rates with all categories being 80 per cent or above.
Figure 14: Private sector participation by industry to 2022
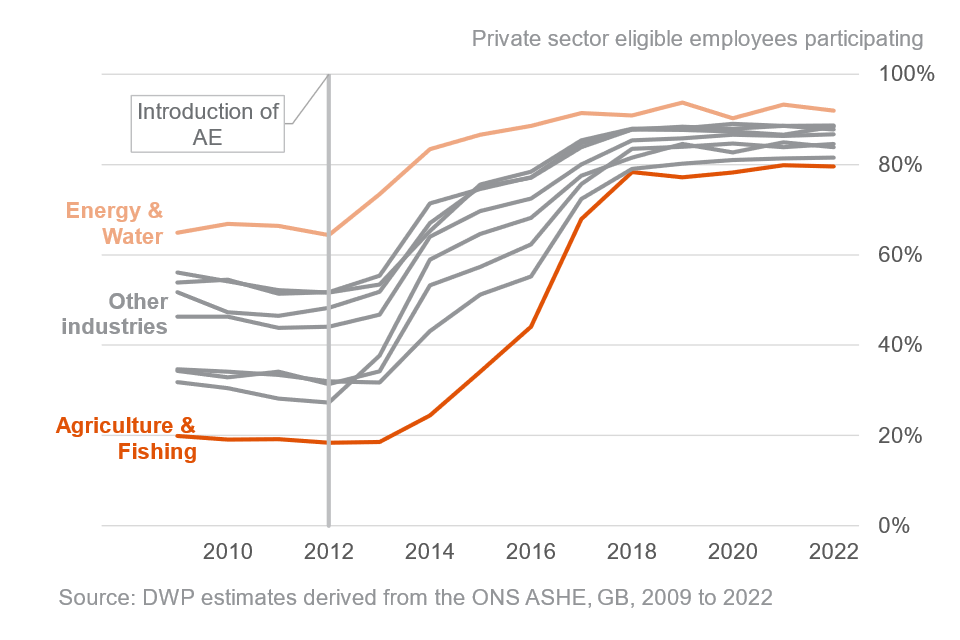
Note: Graphs above show industry breakdowns with the highest and lowest participating industries. All other industries fall within these.
Across the whole economy in 2022, workplace pension participation was highest in the Energy & Water industry with 92 per cent of eligible employees participating and lowest in the Agriculture and Fishing industry with 80 per cent participating.
In the private sector all industries have seen increases in participation since 2012, and the gap between different industries has narrowed. The industry seeing the largest increase in participation since 2012 is the Agriculture & Fishing industry, which saw an increase of 61 percentage points.
Participation in the public sector has remained high in all industries over the time series. Small sample sizes in the data mean that comparisons across industries in the public sector are less meaningful than in the private sector.
1.6 Occupation, by sector
All private sector occupations have high participation rates with all categories being 80 per cent or above.
Figure 15: Private sector participation by occupation to 2022
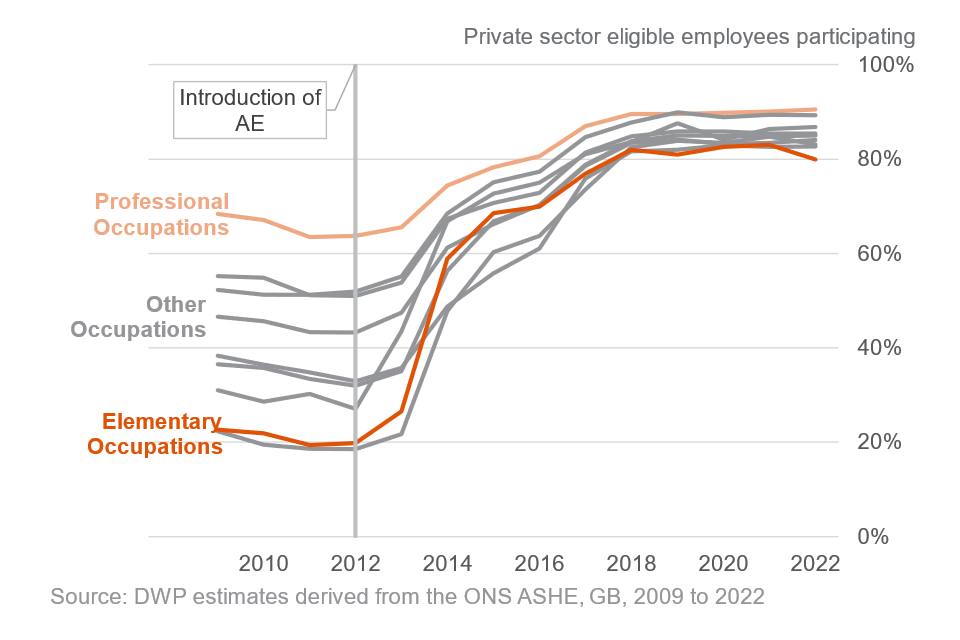
Note: Graphs above show all occupation breakdowns, with the highest and lowest occupations labelled, and all other occupations are within this field.
Across the whole economy workplace pension participation is highest in the Professional and Associate Professional & Technical occupations with 91 per cent of eligible employees in these occupations participating in 2022, compared to the lowest in Elementary occupations where 81 per cent were participating in 2022.
Since 2012, all occupations in the private sector have seen a large increase and the gap in participation between different occupations has narrowed. The largest increase has been seen in Personal Service occupations (such as carers, travel agents and nurses) where the participation rate increased by 65 percentage points from 19 per cent in 2012 to 83 per cent in 2022.
In the public sector participation by occupation remains relatively stable with all occupations continuing to show higher participation levels than those seen in the private sector. Personal Service occupations shown the largest increases since 2012 of 15 percentage points, from 78 per cent to 93 per cent in 2022.
1.7 Region, by sector
Gaps in participation rates between public and private sector have narrowed for most regions.
Figure 16: Participation by region and sector in 2022
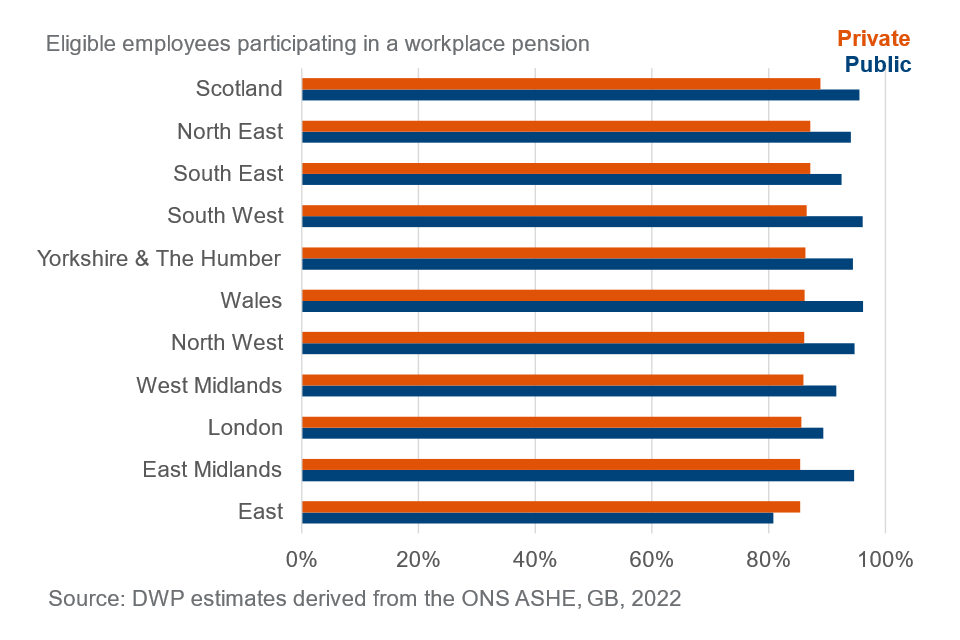
In the private sector in 2022, the highest participation was in Scotland at 89 per cent of eligible employees. The lowest, at 85 per cent, is observed in the East of England.
Within the public sector in 2022, the region with the highest level of eligible employees participating in a workplace pension was Wales with 96 per cent. The lowest participation rate of 81 per cent is observed in the East of England.
1.8 Economic status, UK
Since 2012/13, non-eligible employee participation has increased from 16 per cent to 35 per cent in 2021/22; though this was a slight fall from the previous year (38 per cent in 2020/21). We have seen minimal change in self-employed, who are not part of Automatic Enrolment, participation levels (17 per cent in 2021/22 compared to 18 percent in 2012/13).
Figure 17: Participation by economic status to financial year 2021/22
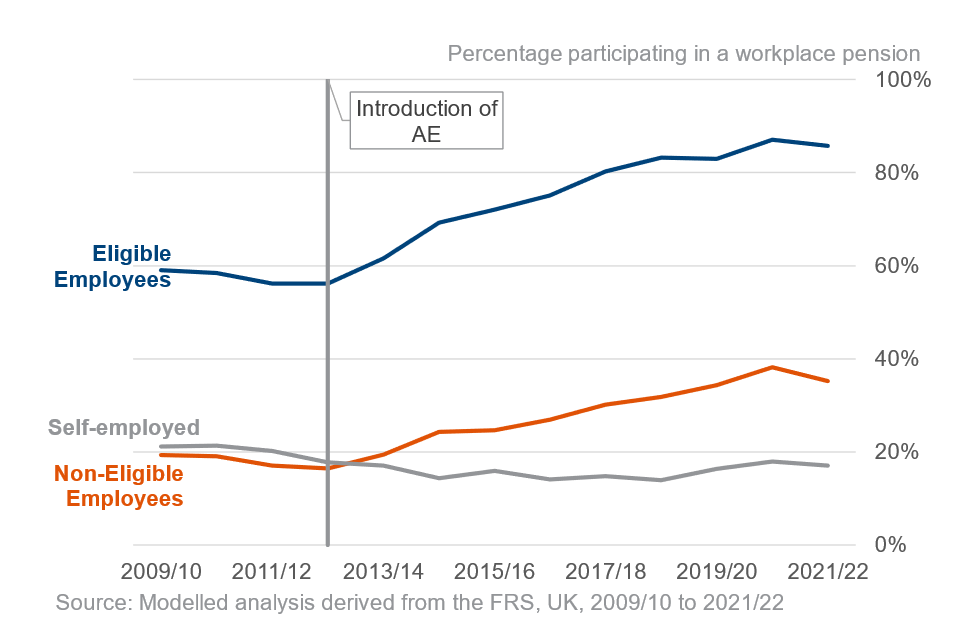
This analysis uses the DWP Family Resources Survey (FRS) to provide breakdowns by characteristics not available from ASHE, but it is not possible to provide breakdowns by sector. More detail on this analysis can be found in the accompanying Background Information and Methodology note. Differences between the FRS and ASHE surveys mean the overall level of participation measures is not exactly the same. Nevertheless, both FRS and ASHE have seen similar long-term trends in participation. Automatic enrolment scheme participation has increased among eligible employees from 56 per cent in 2012/13 to 86 per cent in 2021/22.
For non-eligible employees, the long-term trend has been a gradual increase from 16 per cent in 2012/13 to 35 per cent in 2021/22. Unlike employees, both eligible and non-eligible, the self-employed group has seen an overall long-term decline in participation from 21 per cent in 2009/10 to 17 per cent in 2021/22. Participation rates decreased slightly in 2021/22 from the previous year, by 1 percentage point for eligible employees and self-employed and 3 percentage points for non-eligible employees.
Since 2012/13, participation rates among eligible employees have shown a marked increase from 56 per cent to 86 per cent in 2021/22. This trend is similar to that seen in the ASHE data, though participation rates have increased more over this period in ASHE (from 55 per cent in 2012 to 88 per cent in 2022) than in FRS.
1.9 Non-eligible participation, by sector
While trends in participation among non-eligible employees have followed a similar trend to eligible employees, participation rates remain lower.
Figure 18: Non-eligible participation by sector to 2022
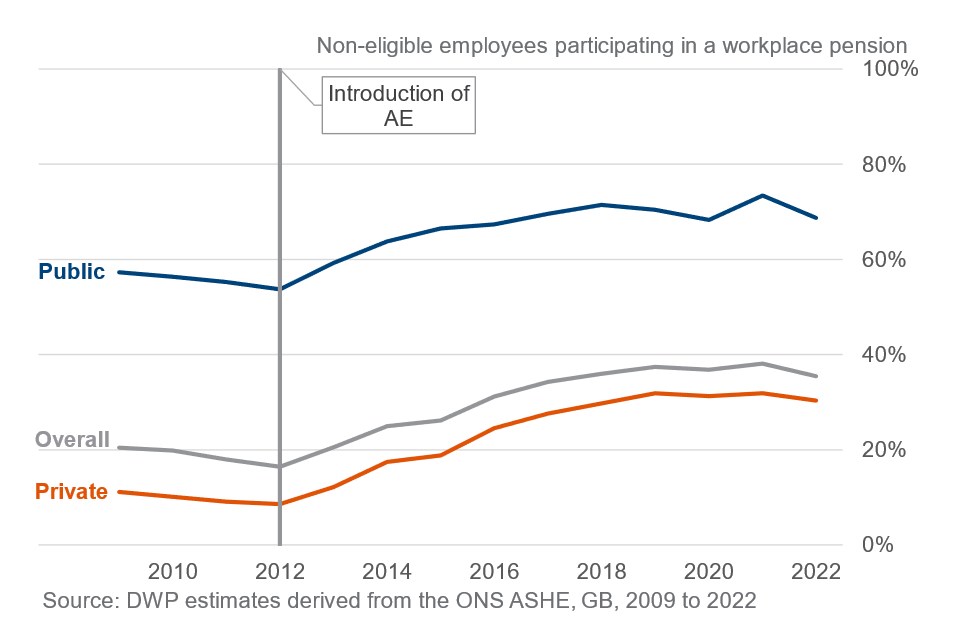
Non-eligible jobholders are individuals who earn below the Earnings Trigger (currently £10,000) but above the Lower Earnings Limit (currently £6,240), earn above the Trigger but are under 22 or above SPA or both earn below the Trigger and are under 22 or above SPA. Non-eligible jobholders are not automatically enrolled but can choose to opt-in to a workplace pension and receive a mandatory employer contribution.
ASHE can be used to provide breakdowns on non-eligible employees by sector. Trends in non-eligible participation have been broadly similar in ASHE and FRS, except for the latest 1-2 years. This is likely to be due to differences between these data sources e.g. time periods.
Some employers automatically enrol non-eligible employees. For example, DWP’s 2022 Employer Survey found around 15% of employers enrolled 18-21 year olds, 13% enrolled those earning under £10,000, and 7% enrolled those above SPA.
Across the whole economy, there was a general downward trend in workplace pension participation among non-eligible employees, from 20 per cent (1.1 million non-eligible employees) to a low of 16 per cent (0.9 million non-eligible employees) between 2009 and 2012. This is a similar trend to what has been observed among eligible employees. Since 2012, there has been a large increase of 19 percentage points to 35 per cent of ineligible employees participating in a workplace pension (1.7 million) in 2022.
The largest increases in workplace pension saving among non-eligible employees have been seen within the private sector. Since 2012, private sector participation has risen by 22 percentage points to 30 per cent of private sector non-eligible employees participating in 2022 (1.2 million ineligible employees). The gap between public and private sector non-eligible participation has remained large (38 percentage points in 2022).
Public sector pension participation among non-eligible employees remains relatively high at 69 per cent in 2022 (0.4 million non-eligible public sector employees), an increase of 15 percentage points since 2012.
Participation rates decreased slightly in 2022 from the previous year, by 5 percentage points for non-eligible employees in the public sector and 2 percentage points for non-eligible employees in the private sector.
1.10 Disability, UK
Between 2014/15 and 2019/20 there was a small, persistent gap between disabled and non-disabled eligible employee participation, with disabled eligible employees having higher participation rates than non-disabled employees. More recently, this gap has been closing, with participation rates for disabled employees at 85 per cent and participation rates for non-disabled employees at 86 per cent in 2021/22.
Figure 19: Participation by disability status to financial year 2021 to 2022
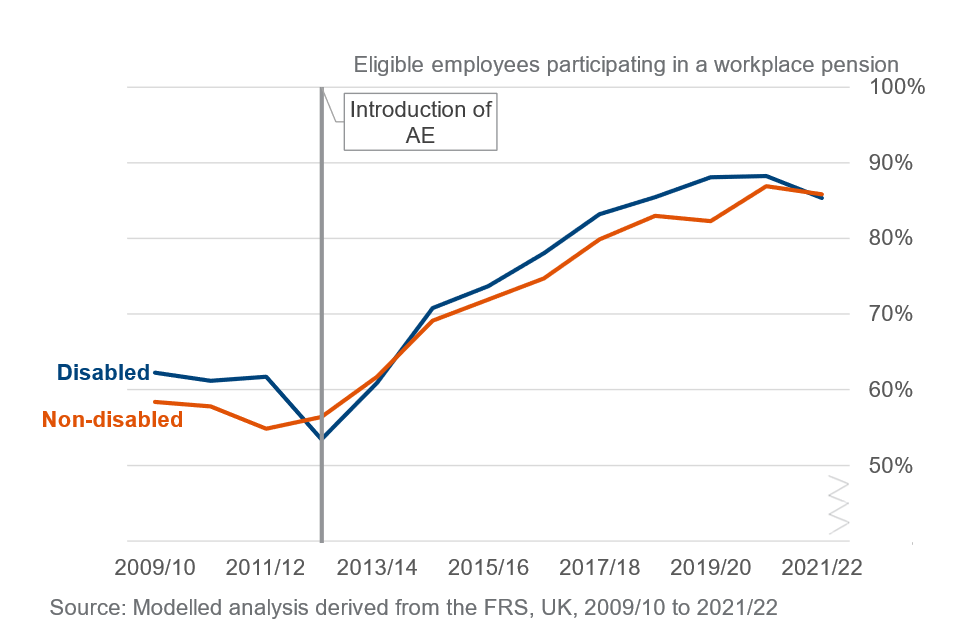
The FRS data can be used to show trends in pension participation for disabled and non-disabled eligible employees.
In 2019/20 there was a gap in participation between disabled and non-disabled participants of 6 percentage points, but this has reduced to less than 1 percentage point in 2021/22, with 85 per cent of disabled people participating, and 86 per cent of non-disabled people participating.
Both the disabled and non-disabled groups saw large increases between 2012/13 and 2021/22, rising 32 and 29 percentage points respectively. Participation rates decreased slightly in 2021/22 from the previous year, by 1 percentage point for non-disabled employees and 3 percentage points for disabled employees.
The impairment types used to define disability status were changed in the 2012/13 survey to reflect new harmonised standards and therefore caution is needed where making comparisons over time.
It should be noted that disabled employees are generally less likely to be in the eligible group according to FRS data.
1.11 Ethnicity, UK
Eligible employee participation continues to increase across all ethnic groups with the gap between White and Pakistani and Bangladeshi groups decreasing to 13 percentage points.
Figure 20: Participation by ethnicity (3-year average) to financial year 2021 to 2022
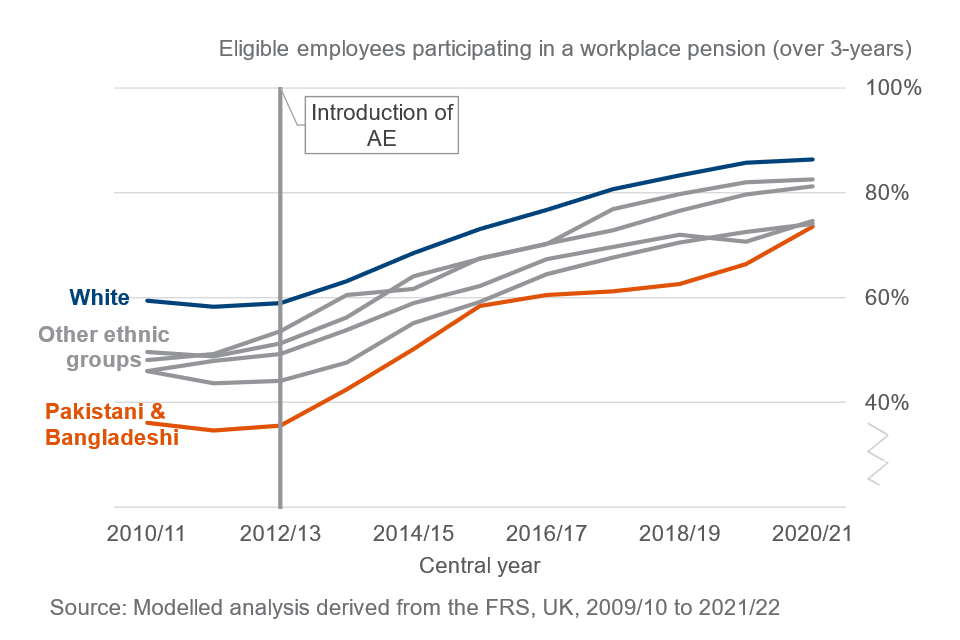
The FRS data can also be used to show trends in pension participation by ethnic group, but three-year rolling averages must be used to account for volatility in single year results which are caused by small sample sizes and clustering effects.
The White ethnic group has had the highest participation rate over the entire time series with an average participation rate of 86 per cent over the period 2019/20 - 2021/22. This compares to the lowest, Pakistani and Bangladeshi group at 74 per cent.
Between the 2011/12-2013/14 period and 2019/20-2021/22 period there were large increases among all ethnic groups. The Pakistani & Bangladeshi ethnic group shows the largest increase from 36 per cent to 74 per cent (38 percentage point increase).
In comparison the lowest increase in the same period, 2011/12-2013/14 to 2019/20-2021/22, occurred in the Indian ethnic group. This group saw a 25 percentage point increase from 49 per cent to 75 per cent.
2. Persistency of saving
For individuals with multiple employment records, 98% of eligible savers are saving ‘persistently’.
Figure 21 and 22: Persistency of saving to 2019 to 2022, excluding where “Evidence Indeterminate”
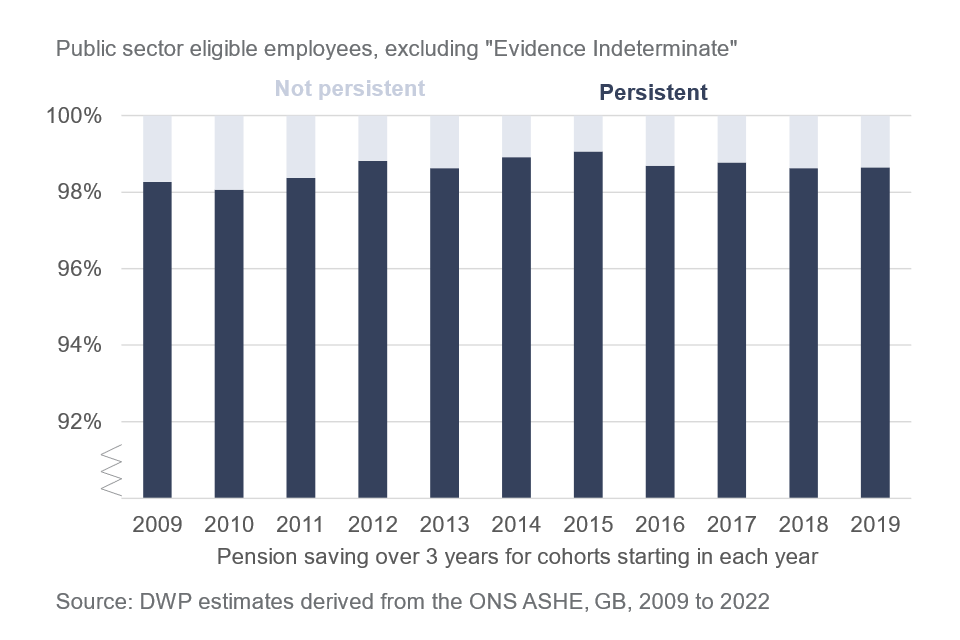
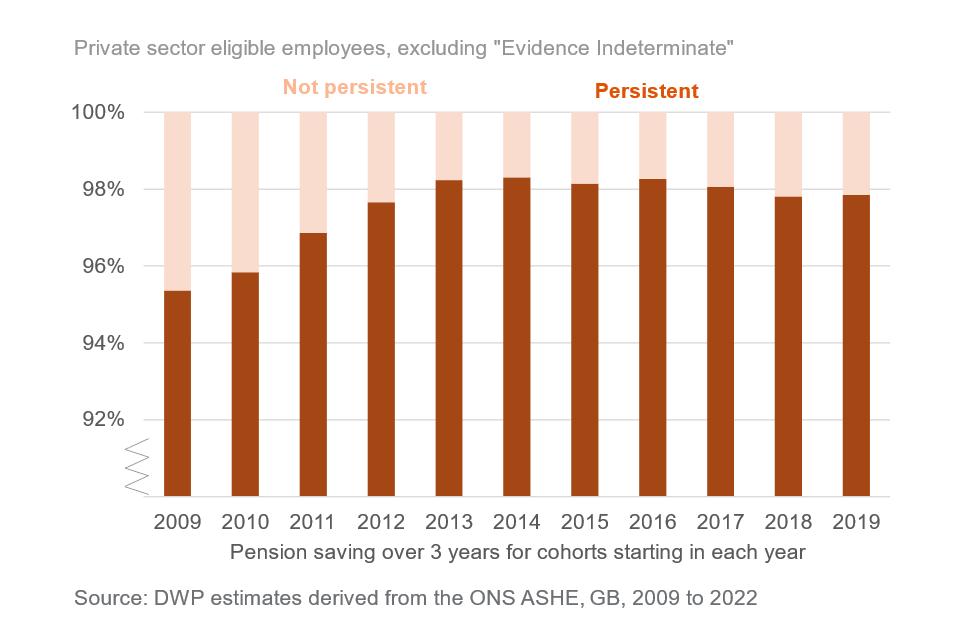
For the ongoing evaluation of automatic enrolment, the ASHE data is used to derive a persistency of saving measure to monitor the number of eligible employees regularly saving. For the cohort of eligible savers in a given year, those who are also saving in at least two of the following three years are defined as persistent savers. Those eligible savers treated as having indeterminate evidence of persistency are excluded from the prior two charts.
An employee may no longer appear in the ASHE data due to leaving the labour market or moving to an employer who does not return the ASHE questionnaire. Those in a cohort of eligible savers in a given year treated as having indeterminate evidence of persistency fall into 2 categories: those not present in the data in at least two of the following three years, and (a smaller number) those who are saving in exactly one of the following three years. Those in the cohort of eligible savers in a given year who are not saving in any of the following 3 years, and are not in the evidence indeterminate group, are defined as not persistent savers.
Of eligible savers in 2019, 46% have indeterminate evidence as to whether they were saving in at least two of the following three years. Excluding the ‘evidence indeterminate’ group, 98% of eligible savers with multiple employment records were saving in at least two of the following three years.
The proportion of eligible savers in the ‘evidence indeterminate’ group has risen over time from 20% in 2009-2012 to 46% in 2019-2022. The reasons for this are not clear, although there has been a small decrease in the ASHE response rate over time. In the most recent 2019-2022 period, the proportion of eligible savers in the public sector in the ‘evidence indeterminate’ group was 38% while the proportion in the private sector was 48%.
3. Trends in Contributions
Total annual savings for eligible savers was £115.9 billion in 2022.
Figure 23: Amount saved for eligible savers in 2022
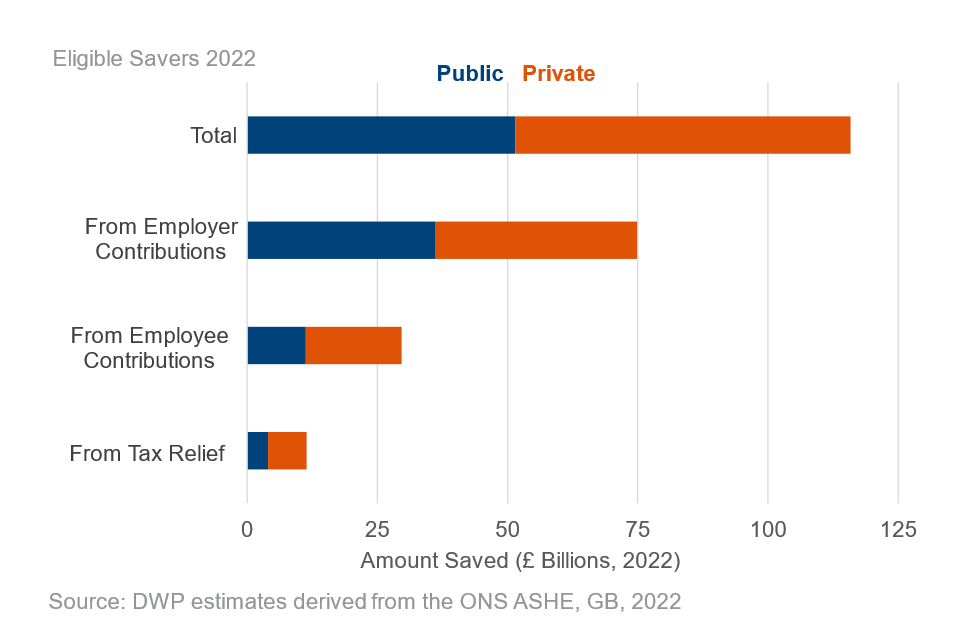
Minimum contribution rates under automatic enrolment started at 2 per cent of qualifying earnings with at least 1 per cent from employers. In April 2018, this increased to 5 per cent with at least 2 per cent from employers. In April 2019, minimum contribution rates increased to their current level of 8 per cent overall with at least 3 per cent from the employer.
The annual total amount saved for eligible savers across both sectors stood at £115.9 billion in 2022, which was an increase in nominal terms of £1.2 billion from £114.6 billion in 2021. However, in real terms (using 2022 earnings growth), this equated to a fall of £5.6 billion from £121.5 billion in 2021. The real terms amounts saved decreased by £1.6 billion in the private sector and decreased by £4.0 billion in the public sector.
Overall in 2022, contributions by employees accounted for 26 per cent of saving, with employer contributions accounting for 65 per cent, and income tax relief on the employee contribution the remaining 10 per cent.
Amount saved per eligible employee increased in both sectors since 2012.
Figure 24: Amount saved per eligible saver and employee by sector to 2022
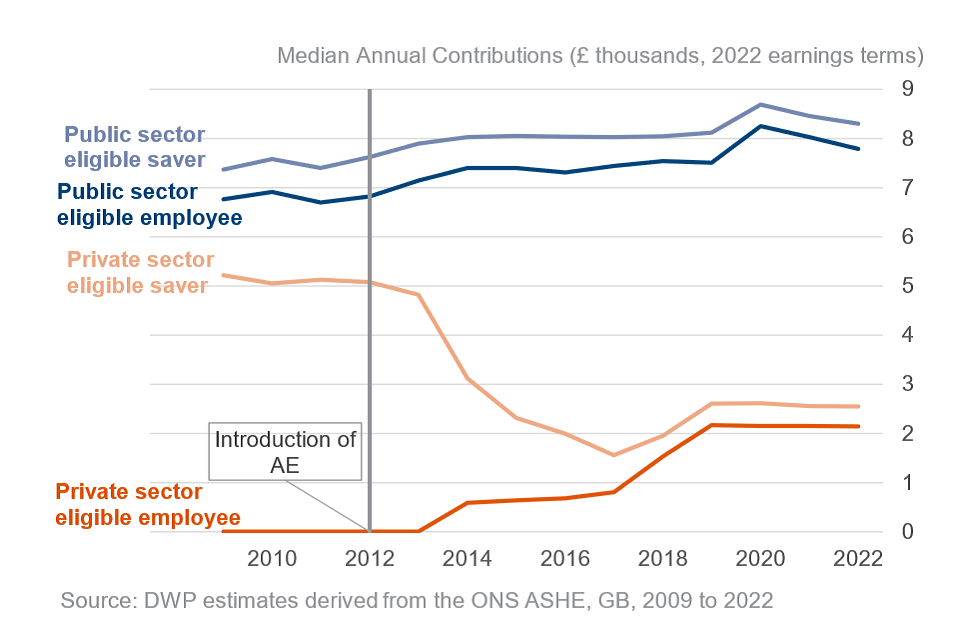
Note: Average amounts are calculated using medians.
In the private sector the average annual amount saved per eligible saver showed several years of decline from 2012 to 2017. The falling trend was a result of the increased number of savers in the private sector, many of whom will be making contributions at the automatic enrolment minimum level and therefore lowering the average. The average amount saved per eligible saver then saw large increases between 2017 and 2019, increasing £400 between 2017 and 2018 and £650 between 2018 and 2019. These increases are most likely attributable to the phased increases in minimum contribution rates. Following this, the average amount per eligible saver and employee has stayed roughly the same from 2019 onwards.
Within the public sector there has been a gradual increasing trend for both the amount saved by eligible savers and employees. This reflects continued high participation rates in the public sector. However, since 2020 there have been slight declines in both the average annual amount saved per eligible saver and the average annual amount saved per eligible employee. Per eligible saver, there has been a decline of £390 from £8,690 in 2020 to £8,300 in 2022, while per eligible employee there has been a decline of £460 from £8,250 in 2020 £7,790 in 2022.
Amount saved per male and female eligible savers in public and private sector have followed similar trends to overall sectoral amount saved trends. However, there are persistent gaps in average amount saved for male and female eligible savers in both sectors.
Figure 25: Amount saved per eligible saver by gender and sector to 2022
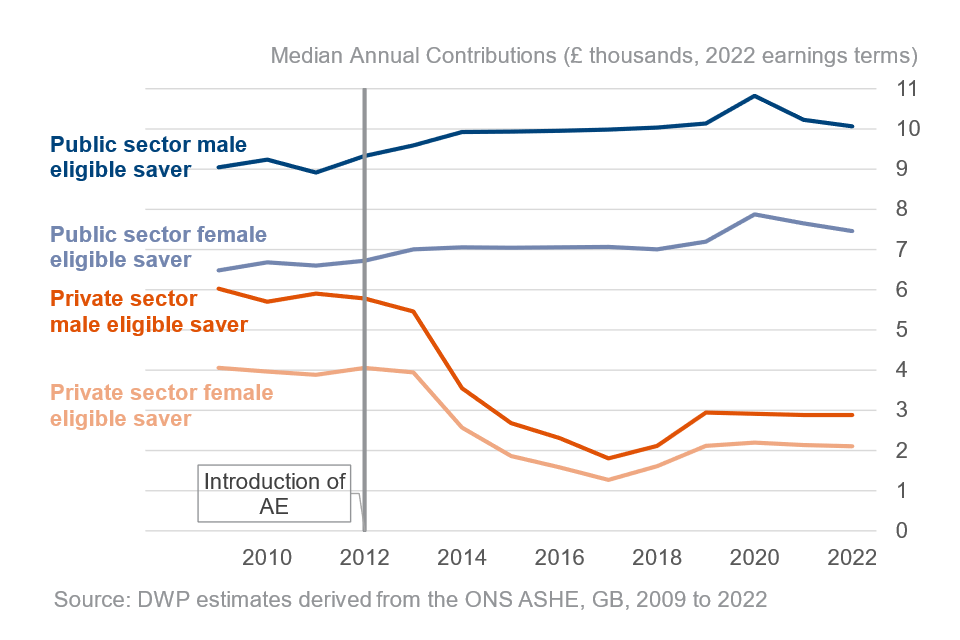
Within the private sector, the average amount saved per male eligible saver was unchanged from 2021 to 2022. For women, this decreased by £30.
Within the public sector, the average amount saved per male eligible saver fell in 2022 compared to 2021, by £150. For women, this decreased by £190.
Note that figures for annual amounts saved are derived by converting actual amounts saved during a single pay period in April of the corresponding year to an annual equivalent.
4. More recent trends in pension saving
We use both HMRC RTI data, and data from a selection of private pension providers to assess more recent trends around pension saving.
HMRC RTI data
Stopping saving rates in RTI have remained stable in 2022-23 compared to 2021-22.
Figure 26: Stopping saving rates to financial year 2022 to 2023
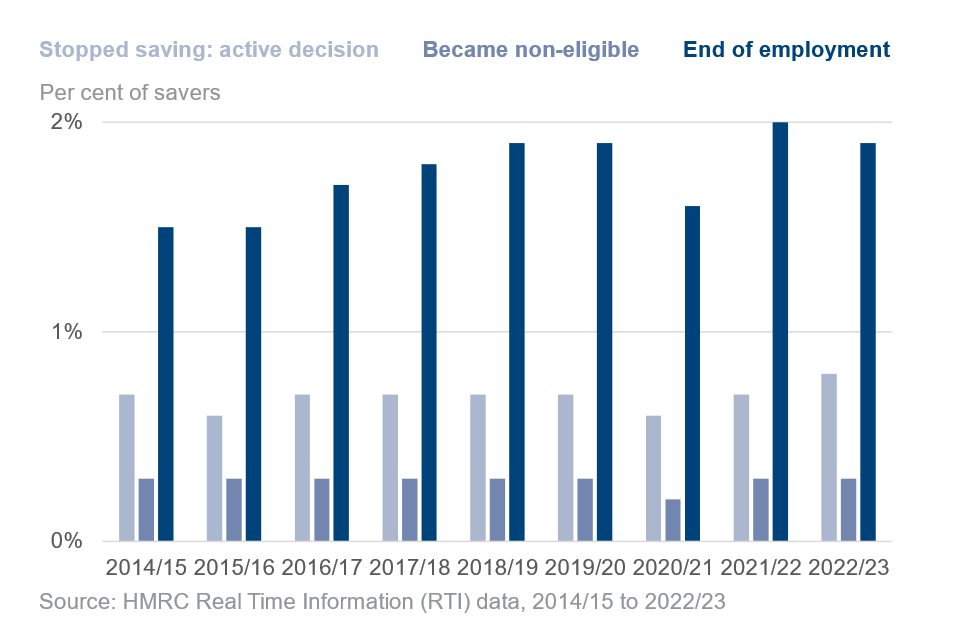
This section presents RTI stopping saving rates from April 2014 to March 2023. The RTI stopping saving rate is calculated as the proportion of all employments that are classed as stopping their workplace pension saving within each month on RTI. An employment is defined as stopping saving in the month of its final pension contribution. By looking longitudinally across payments for a given employment, we use the presence and absence of employee pension contributions to identify when pension saving starts and stops within an employment. RTI cannot identify cases where employees have been enrolled but they stopped saving before making their first contribution.
From April 2014 to March 2023, on average 2.7 per cent of employments within RTI were identified as stopping saving each month due to either an active decision being made, the employment becoming non-eligible or the employment ending. Across this period, end of employments accounts for 64 per cent, with active decisions accounting for 25 per cent, and becoming non-eligible accounting for 11 per cent of employments who are classified as having stopped saving.
In 2022-23, the overall stopping saving level has remained unchanged compared with the previous year (3.0 per cent). In 2022-23, the stopping saving active decision rate increased by 0.1 percentage points (to 0.8 per cent) and the end of employment rate decreased by 0.1 percentage points (to 1.9 per cent). The rate at which people became non eligible has remained unchanged from the previous year.
RTI data shows there has been a slight decline in the contributing eligible jobholder rate in recent years whilst the number of total eligible jobholders continues to increase; though this does not capture all pension participants.
Figure 27: Contributing eligible jobholders to financial year 2022 to 2023 Q4 (Jan to Mar)
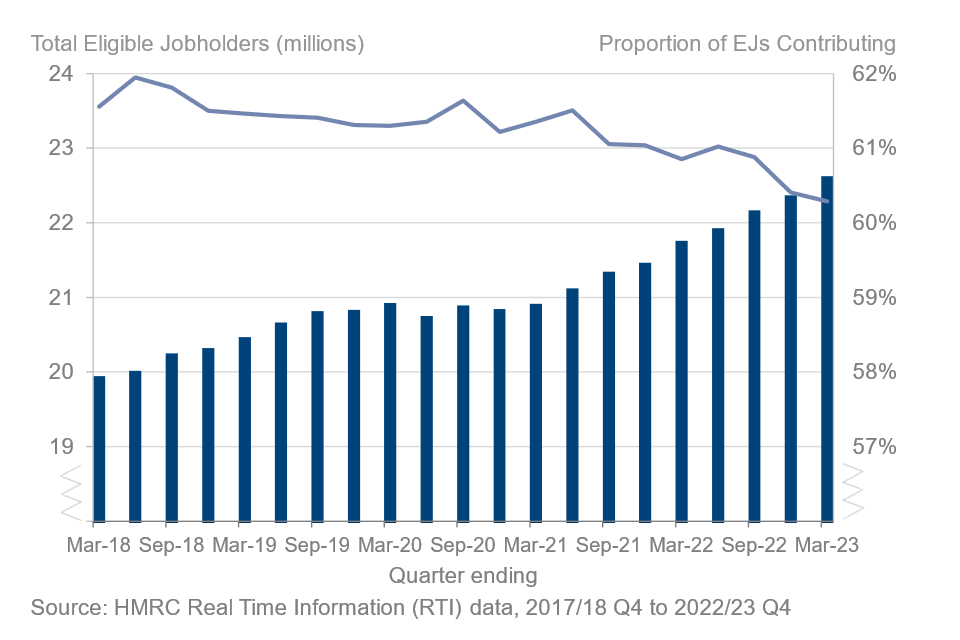
This section presents the counts of eligible contributing jobholders compared with all eligible jobholders in RTI, known as the contributing eligible jobholder rate. This is produced from the number of people in employments who are listed as earning above the earnings trigger of £10,000 and are between the ages of 22 and the State Pension Age at the time.
Within RTI, there are 13.6 million eligible employments with an employee pension contribution as of the fourth quarter of the financial year 2022-23. This accounts for 60.3 per cent of all employments that are classified as eligible within RTI.
This contributing eligible jobholder (EJ) rate has slightly declined over recent years. Between 2017-18 Q4 and 2022-23 Q4, the rate decreased from 61.6 per cent to 60.3 per cent.
Note that RTI data is not restricted to just eligible employees for Automatic Enrolment, but also includes those earning under the earnings trigger and aged under 22 or over the state pension age. It also does not collect information on employer pension contributions, so it cannot identify employments with employer-only pension contributions, or pension contributions made via salary sacrifice. This could explain the difference in the overall participation rate in Table 1.1 and the contributing eligible jobholder rate in Table 5.1. Due to the differences in population coverage and the methodology used, figures produced by RTI will not be directly comparable with other data sources – the focus of this section is to look for changes in RTI measures over time. RTI data in certain sections are presented using financial quarters. For example, Q1 refers to the period from April to June.
Employee pension contribution rates in RTI have remained relatively stable throughout the financial year 2022-23.
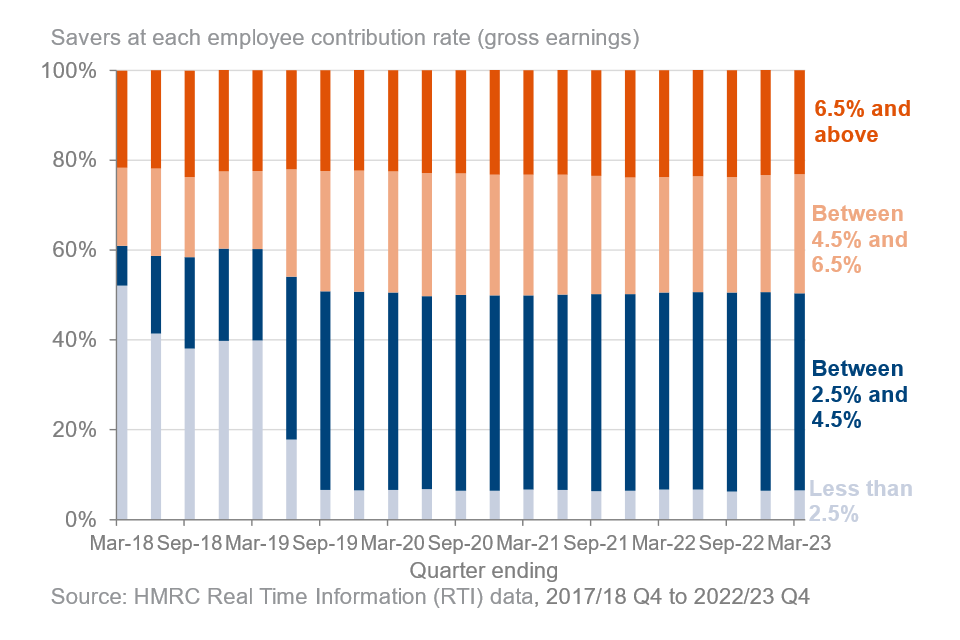
Figure 28 and 29: Employee pension contribution rates by AE threshold pay and full taxable pay to financial year 2022 to 2023 Q4 (Jan to Mar)
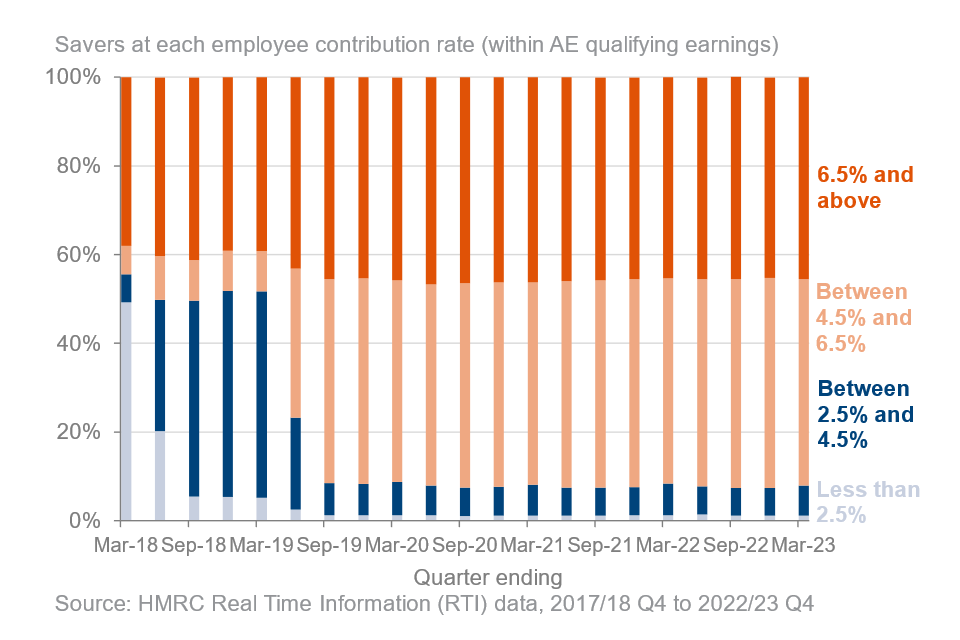
The RTI data can also be used to monitor employee pension contribution rates of each contributing employment. These contribution rates are calculated by using the pension contribution amount by taxable pay on the RTI reporting system. The pension contribution amounts used includes tax relief from relief at source (RAS) schemes.
These figures present the quarterly percentage of eligible jobholders by banded rate of employee pension contributions between January 2018 and March 2023. The figures are presented in terms of taxable pay falling within the lower and upper automatic enrolment thresholds, as well as percentage of full taxable pay.
Across both metrics, employee pension contribution rates in RTI have remained relatively steady throughout 2022-23.
Some PAYE schemes base their pension contribution rates using only the taxable pay that falls within the lower and upper automatic enrolment thresholds. When the contribution rate is calculated using this method, around 92 per cent of eligible employments with a recorded employee contribution are contributing 4.5 per cent or more of this amount into their pension as of the Q4 2022-23.
Not all PAYE schemes base their pension contribution rates using the automatic enrolment thresholds, so the percentage of an employment’s full taxable pay can be used instead. As of Q4 2022-23, around 50 per cent of eligible employments with a recorded employee contribution are contributing 4.5 per cent or more of their full taxable pay into their pension.
Private pension provider data
The overall proportion of active members in selected private pension providers who stop saving each month has remained stable between January 2020 and July 2023.
To provide timely information, we collect data from over 10 large pension providers, with this giving helpful indications of more recent trends. In combination, these providers account for the majority of the private pension market, though coverage is not comprehensive. Consequently, caution should be taken when applying any trends to the whole pension saving population.
The index of active members has increased between January 2020 and July 2023.
Figure 30: Index of active members to July 2023
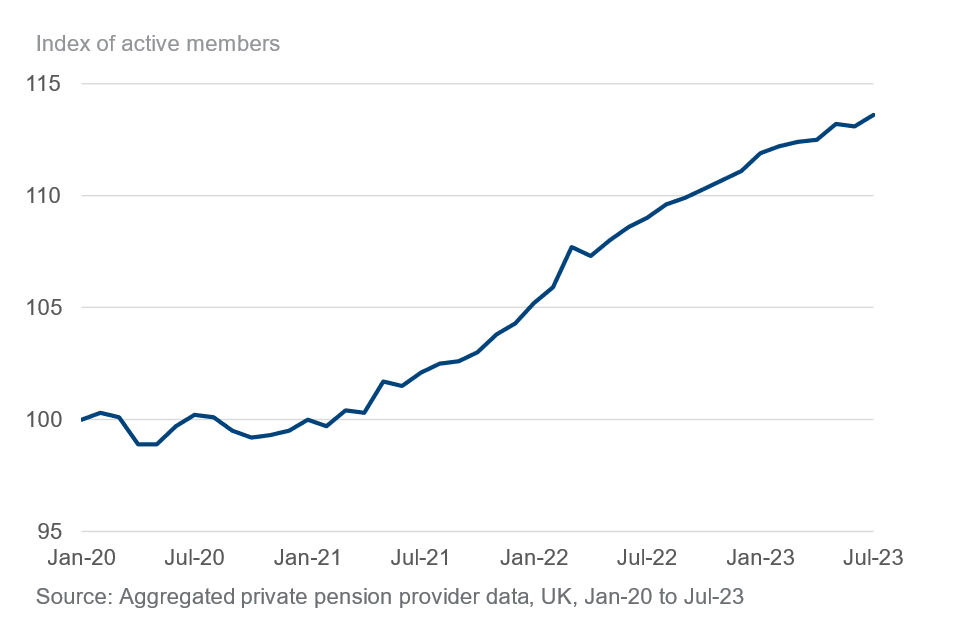
Figure 30 shows aggregated private pension provider data of indexed active members between January 2020 and July 2023. The data is indexed to January 2020. Between January 2020 and February 2021, active membership fluctuated, not starting to increase until March 2021. Since then the data has been rising, with the final month of the series (July 2023) showing an increase in active members of 13.6% compared with January 2020. Part of this rise may be due to growth of the larger providers and consolidation of smaller schemes.
The index of total nominal contributions has increased between January 2020 and July 2023.
Figure 31: Index of total contributions to July 2023
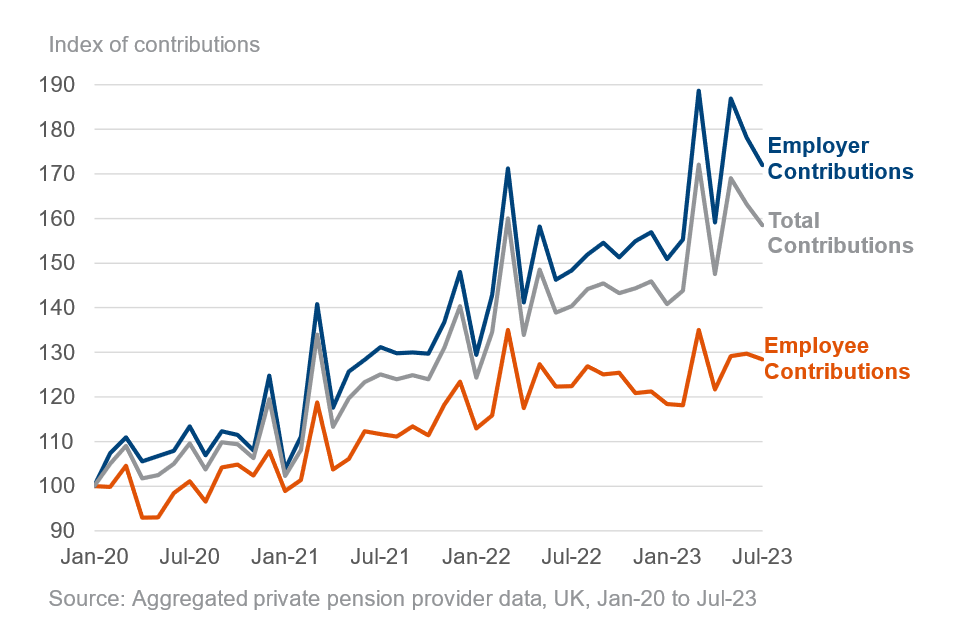
Figure 31 shows aggregated private pension provider data of indexed total, employer and employee nominal contributions between January 2020 and July 2023. The total, employer and employee data are each indexed to January 2020. The data fluctuates across the whole time period and shows an overall increasing trend. Total, employer and employee nominal contributions all peaked in March 2023, which may be a seasonal effect. By July 2023, total contributions had increased by 58.5% compared to January 2020, while employer and employee contributions had increased by 72.0% and 28.4% respectively.
Overall, stopping saving rates across members have remained stable between January 2020 and July 2023.
Figure 32: Proportion of opt outs, cessations and stopping saving to August 2023
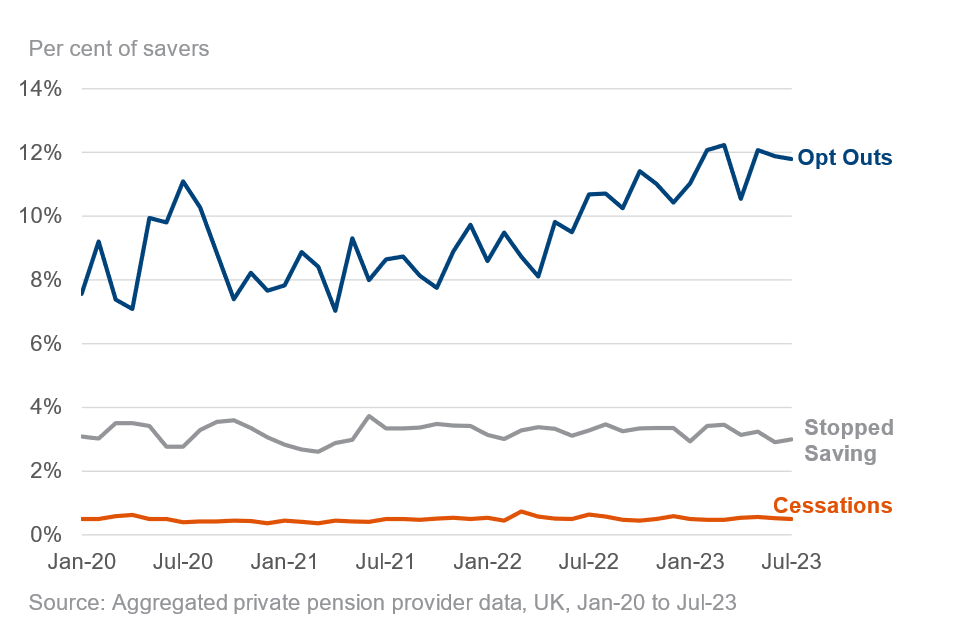
Figure 32 shows aggregated private pension provider data of opt out rates, cessation rates and stopping saving rates between January 2020 and July 2023.
The opt out rate is defined as the proportion of new member enrolments that decide to opt out of workplace pension saving in each month. Opt outs have generally remained low despite Covid-19 and the cost of living; however, there is a small upward trend over the time period.
The cessation rate is defined as the proportion of active members that decide to cease workplace pension saving in each month. The data shows minor fluctuations between January 2020 and July 2023, but overall has remained stable. The cessation rate is very similar when comparing the first month and the final month of the series, being 0.49% in January 2020 and 0.50% in July 2023.
The stopping saving rate is defined as the proportion of active members that decide to opt out, cease saving, or leave employment in each month. The data has remained stable across the period. The stopping saving rate of 3.1% in January 2020 is very similar to the July 2023 rate of 3.0%
About these statistics
The main data source for this publication is the Annual Survey of Hours and Earnings (ASHE) published by the Office for National Statistics (ONS) and is a key source of information on workplace pensions in GB as it collects information on all types of workplace pension schemes. The survey results are used widely to monitor the impacts of pension reforms.
Additional data sources used in this publication include DWP Family Resources Survey (FRS), HMRC Real Time Information (RTI). FRS collects information on the income and circumstances of individuals living in a representative sample of private households in the United Kingdom. RTI is HMRC’s reporting system for income taxed via Pay-As-You-Earn (PAYE) in the United Kingdom. The information is provided by employers and pension providers, with each submission within RTI relating to a payment to an employee or occupational pension recipient. Alongside these, data supplied to DWP by a number of large pension providers is also utilised, having been anonymised and aggregated following receipt.
Full details of the data sources, their key assumptions, limitations and definitions are available in the Background Information and Methodology Note.
Contact Details
Feedback and queries about the statistics can be sent to: workplacepensions.statistics@dwp.gov.uk
For media enquiries please contact the DWP press office.
Published: 22 November 2023
Next edition: Summer 2024