Work Programme statistical summary: data to June 2020
Updated 5 October 2020

© Crown copyright 2020
This publication is licensed under the terms of the Open Government Licence v3.0 except where otherwise stated. To view this licence, visit nationalarchives.gov.uk/doc/open-government-licence/version/3 or write to the Information Policy Team, The National Archives, Kew, London TW9 4DU, or email: psi@nationalarchives.gov.uk.
Where we have identified any third party copyright information you will need to obtain permission from the copyright holders concerned.
This publication is available at https://www.gov.uk/government/statistics/work-programme-statistical-summary-data-to-june-2020/work-programme-statistical-summary-data-to-june-2020
1. Introduction
The Work Programme was launched throughout Great Britain in June 2011. It was part of a number of welfare to work reforms aimed at helping unemployed people back into lasting work. Private and public companies called Providers worked with participants referred to them from Jobcentre Plus at specified points in their claim.
Referrals to the Work Programme ceased in March 2017, although existing participants continued on the programme until March 2019.
Providers were paid a Job Outcome payment when an individual reached 6 months in work, or 3 months for those who were furthest from the labour market. Providers were also paid a Sustainment Outcome payment for each 4-week period a participant remained in work after a Job Outcome had been achieved, up to a maximum period (12 to 24 months depending on the participant’s circumstances).
2. Main Stories
The main stories are:
- almost 2 million people were referred to the Work Programme over the course of its history. All participants have now completed their 2 years’ allotted time on the programme
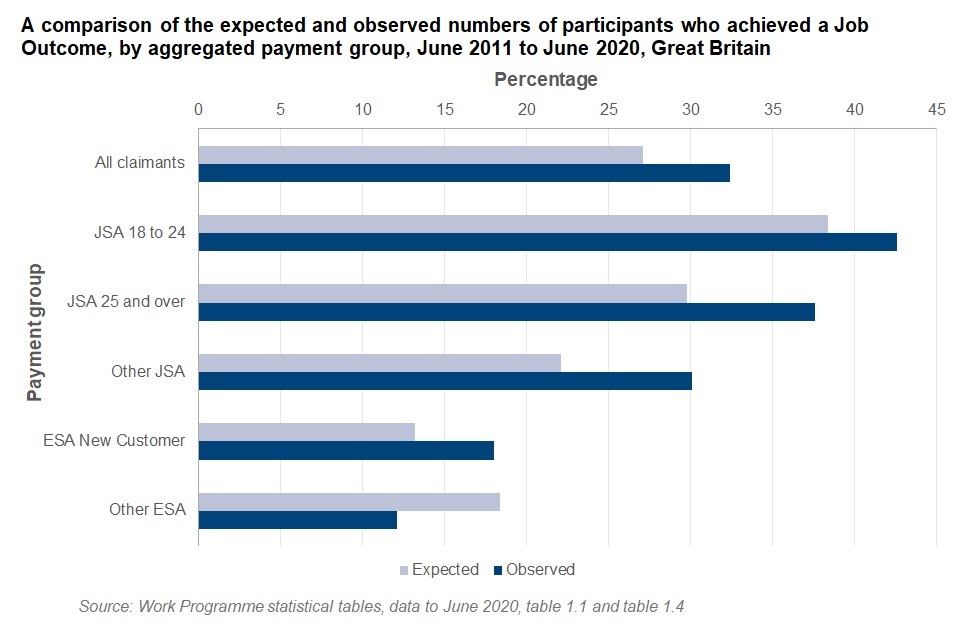
- 630,000 participants on the Work Programme achieved Job Outcomes, compared to an expected number of 530,000. This amounted to 32% of all claimants referred to the programme
- performance over the entire duration of the programme showed 39 out of 40 Work Programme contracts achieved contractual minimum performance levels
3. What you need to know
In these statistics and the accompanying ODS data tables, the 10 payment groups have been aggregated into 5 larger “aggregated payment groups”. This is for presentational reasons only. Data available through Stat-Xplore may be disaggregated by the 10 detailed payment groups.
Aggregation of payment groups
| Aggregated Payment Group | Payment Groups included |
|---|---|
| JSA 18 to 24 | JSA claimants aged 18-24 |
| JSA 25 and over | JSA claimants aged 25 and over |
| Other JSA | JSA Early Entrants |
| Other JSA | JSA ex-Incapacity Benefit (IB) claimants |
| Other JSA | JSA Prison Leavers |
| ESA New customer | Excluding 12 month prognosis claimants |
| Other ESA | New ESA 12 month prognosis claimants only |
| Other ESA | ESA ex-IB claimants |
| Other ESA | IB/IS Volunteers |
| Other ESA | ESA Volunteers |
Providers were paid a Job Outcome payment when a participant spent a minimum amount of time in employment (6 months for the ‘JSA 18 to 24’, ‘JSA 25 and over’, and ‘JSA Prison Leavers’ payment groups; and 3 months for all other payment groups).
Providers were also paid Sustainment Outcome payments for each 4-week period a participant remained in work after a Job Outcome had been achieved, up to a maximum period (12 to 24 months depending on the participant’s circumstances).
In 2018, some Providers agreed to modify this scheme, so that they were eligible for only a single, high-value Job Outcome payment after participants achieved 6 months in work. This applied to all payment groups, and no further Sustainment Outcome payments were made to these Providers. Contractual targets for Job Outcomes were not modified. For more information on the affected Providers, please refer to the Background Information Note.
Validation procedures were implemented to ensure that Providers only financially benefited from valid Job and Sustainment Outcomes. These statistics have incorporated the validation rates derived from these procedures to reflect only valid Outcomes. For more information on validation procedures, please refer to the Background Information Note.
The regular release of these statistics was paused after the March 2018 release (data to December 2017). This was due to changes in the payment scheme and resulting changes to how performance information was recorded. This release marks the cessation of these statistics and is therefore the final set of statistical information relating to the Work Programme.
The release includes revisions to the previously published series, and paints a picture of the overall performance of the programme. The changes aforementioned have been addressed as part of this work and further methodological detail about this can be found in the Background Information Note.
4. Joining the Work Programme
The number of individuals referred to the programme decreased over time. This downward trend was expected, since unemployment rates were higher in the early years of the programme, following the 2008 recession; and because individuals could only participate on the programme once.
By mid-2015 the number of participants in each intake had plateaued, with referral intake sizes ranging from 7,000 to 11,000 thereafter. Referrals to the Work Programme ceased in March 2017, although existing participants continued on the programme until March 2019.
Of the almost 2 million referrals to the Work Programme, around 22,000 were claiming Universal Credit (UC) at the time of referral. Referrals of Universal Credit recipients started in August 2013.
The intake of referrals was much higher in the early years of the programme
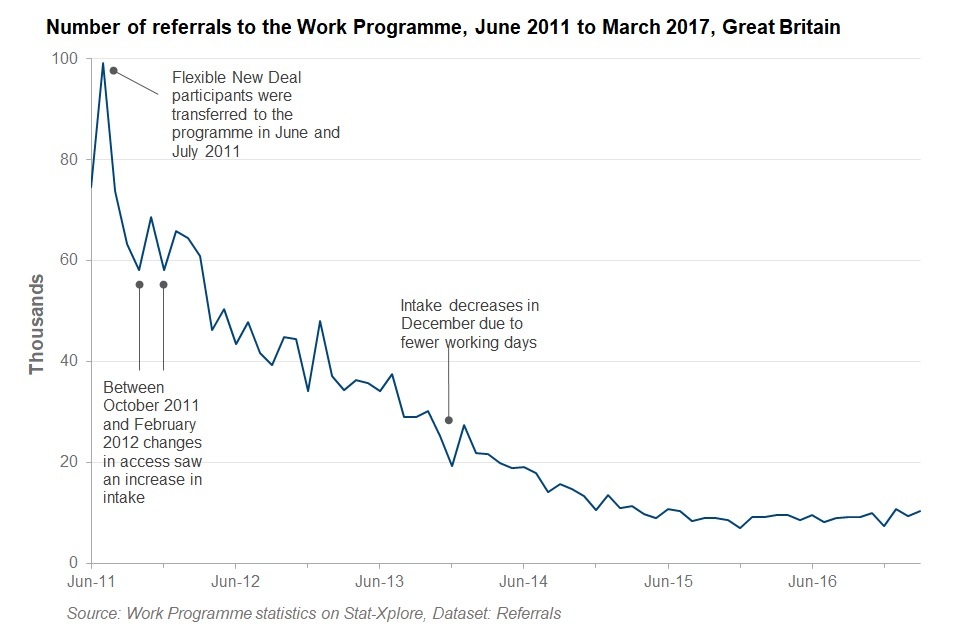
Later intakes to the Work Programme contained a higher proportion of individuals expected to require more support and assistance. The sharp increase in the proportion of Employment and Support Allowance (ESA) referrals in late 2012 reflects changes in access to the programme. This included the introduction of information sessions for potential ESA volunteers and a Jobcentre Plus exercise to identify eligible ESA Claimants who had not been referred to the programme.
The proportion of participants referred to ‘ESA New Customer’ and ‘Other ESA’ aggregated payment groups rose from 5% at the start of the programme to 30% by the time referrals to the programme ceased in March 2017.
Later intakes contained a higher proportion of individuals expected to require more support and assistance.

5. Movement into Employment
The Department for Work and Pensions (DWP) set minimum performance levels for Providers’ ability to move participants into lasting work. Minimum performance levels set out the proportion of Job Outcomes a Provider was expected to achieve. These levels were derived by applying a 10% increase to the number of participants that DWP estimated would move into work in the absence of the Work Programme, based on analysis of historical data. With the exception of the earliest referral intakes, Providers surpassed the minimum performance level for most cohorts.
Up to cohorts referred in mid-2015, there was an improvement in Providers’ ability to help participants into lasting work over time. This may have been driven by:
- a general increase in the national employment rate;
- reduced volumes of participants being referred to the programme; and/or
- general maturity of the programme, leading to improvements in Providers’ processes and ability to help people into lasting work.
Cohorts referred after mid-2015 started to show a decline in performance, although this remained above the minimum performance level (measured across all contracts and participants).
The number of participants who achieved a Job Outcome has surpassed expectations.
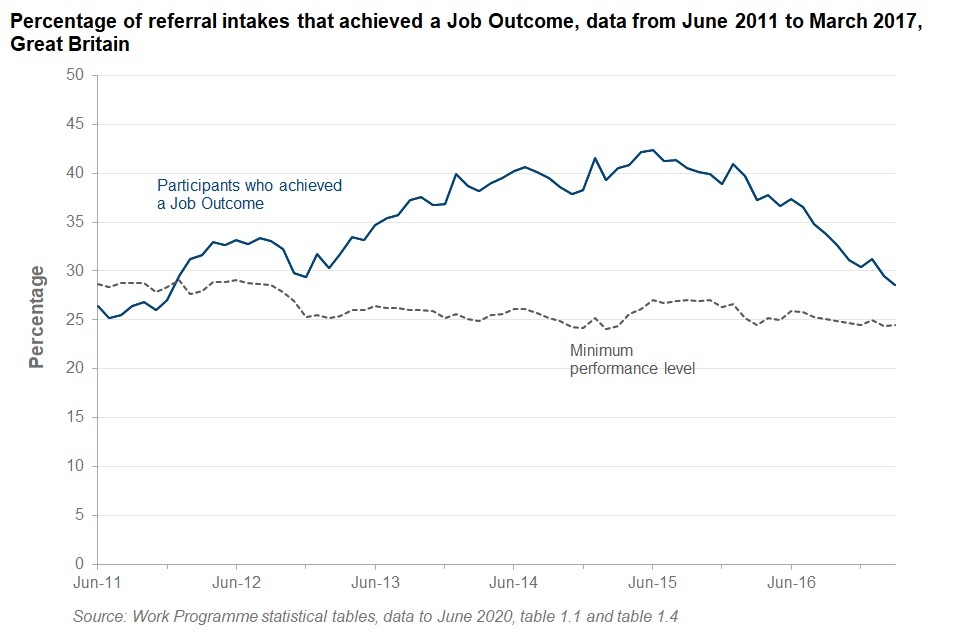
Since February 2012, the number of participants who achieved a Job Outcome has been higher than the minimum performance level.
On average, the observed number of participants who achieved a Job Outcome exceeded expectations with respect to all aggregated payment groups except for the ‘Other ESA’ group. 18% of participants in the ‘Other ESA’ group were expected to achieve a Job Outcome, however, only 12% had achieved a Job Outcome by the time the programme ended.
60,500 Unclaimed Outcomes have been paid – these are Job Outcomes identified by DWP which were not successfully claimed by the Provider. The Providers are paid for these at a reduced rate. Unclaimed Outcomes are not included in counts of Job Outcomes given in these statistics.
In line with expectations, younger JSA claimants achieved the highest proportion of Job Outcomes.
6. Sustainability of Employment
Providers were paid a Sustainment Outcome payment for each four-week period a participant remained in work after a Job Outcome had been achieved.
Providers could only receive up to twelve months’ worth of Sustainment Outcome payments for the ‘JSA 18 to 24’ and ‘JSA 25 and over’ payment groups, and 18 (or occasionally 24) months’ worth for harder-to-help groups. Providers could only claim Sustainment Outcomes for employment spells that started in a participant’s 2-year allotted time on the programme.
In 2018, some Providers agreed to modify the payment scheme, so that they were eligible for only a single, high-value Job Outcome payment, which was paid when a participant achieved 6 months in work. This applied across all payment groups, and no further Sustainment Outcome payments were made to these Providers. Contractual targets for Job Outcomes were not modified. For more information on the affected Providers, please refer to the Background Information Note.
In total, almost 7.3 million Sustainment Outcome payments were paid to Providers, with each payment equating to a participant spending 4 weeks in work after having achieved a Job Outcome. This represents 76% of all Sustainment Outcomes for which participants with Job Outcomes were eligible. Whilst long-term impact cannot be accurately assessed from these statistics, these figures suggest that the majority of participants who achieved the initial Job Outcome criteria went on to remain in work for an extended period.
Work Programme participants with Job Outcomes went on to achieve 76% of the Sustainment Outcomes for which they were eligible.
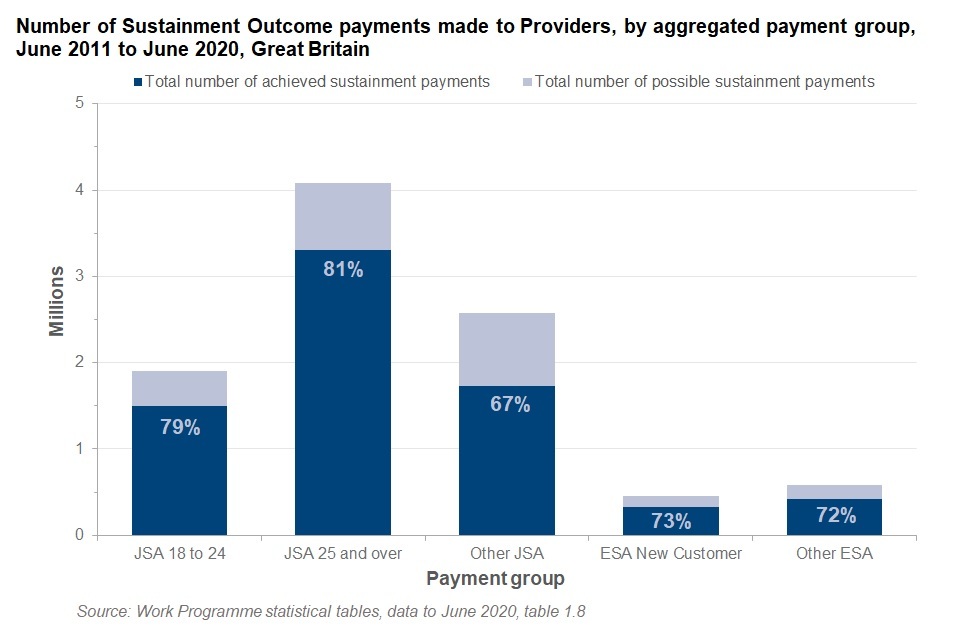
Participants with Job Outcomes in the ‘JSA 25 and over’ group achieved 81% of the Sustainment Outcomes for which they were eligible, the highest rate across the five aggregated Payment Groups. The ‘Other JSA’ aggregated payment group had the lowest rate, at 67%.
7. Contracts and Providers
There were 40 Work Programme contracts awarded, of which 39 operated across the duration of the programme, with a single contract being ceased early and subsequently re-let. Calculated over the entire duration of the programme, the 39 contracts achieved contractual minimum performance levels.
In 2015, the contract operated by Newcastle College Group in North East Yorkshire and the Humber ceased, with Maximus Employment UK Ltd taking on a new contract, replacing Newcastle College Group from February 2015. For the purposes of this report, Newcastle College Group and Maximus Employment UK Ltd in North East Yorkshire and the Humber have been treated as a single contract, although the two are treated separately in the accompanying data tables and Stat-Xplore release. Please refer to the Background Information Note for further details.
All participants in the ‘JSA 18 to 24’, ‘JSA 25 and over’ and ‘ESA New Customer’ payment groups were mandated to participate in the Work Programme. With respect to these groups, Providers received bonus payments for performing well, and were subject to performance improvement measures if minimum performance levels were not met. The ‘Other JSA’ and ‘Other ESA’ aggregated payment groups were not subject to these measures as some of the participants belonging to these groups were referred on a voluntary basis.
The vast majority of contracts surpassed the minimum performance levels with respect to the three mandatory groups and also for the ‘Other JSA’ aggregated payment group. The majority of contracts performed below expectations in placing participants of the ‘Other ESA’ payment group into lasting work, with only one contract achieving the minimum performance level. For more details on the minimum performance levels, please refer to the Background Information Note.
8. Demographics of the Work Programme
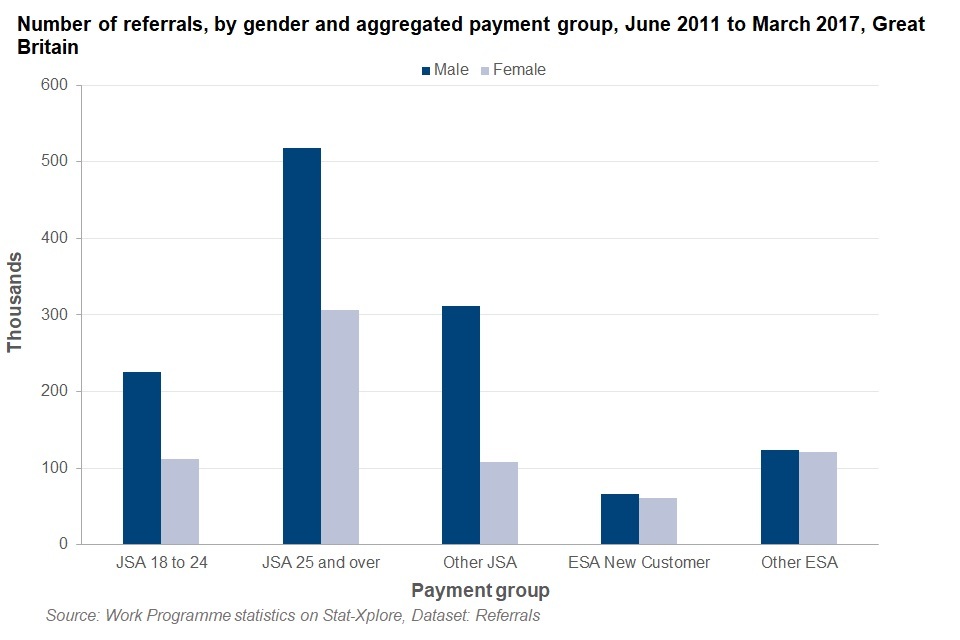
Nearly two-thirds of people who joined the Work Programme were male. Amongst the JSA payment groups, there were twice as many males as there were females while amongst the ESA payment groups, there were roughly the same number of males as there were females. This broadly reflects the gender composition of JSA and ESA claimants during the relevant period.
Two-thirds of people who joined the Work Programme were male.
Ethnicity is self-assessed and recorded on the Jobcentre Plus administrative system. This system records ethnicity using the 2001 harmonised ethnic groups. The latest harmonised standards were published in August 2011 but these had not been adopted in the system at the time of recording. For more details, please see the Background Information Note. 94% of participants declared their ethnicity. Of those that declared their ethnicity, 82% declared their ethnicity as White, 7% as Black or Black British, 6% as Asian or Asian British, 3% as Chinese or Other and 2% as Mixed.
32% of all participants achieved a Job Outcome. 32% of the White ethnic group achieved a Job Outcome, 34% of the Mixed ethnic group, 35% of both the Asian or Asian British ethnic group and Chinese or other ethnic group and 36% of the Black or Black British ethnic group. While these differences are statistically significant (unlikely to be the result of chance alone), the size of the effect is small and is not evidence suggestive of adverse impact[footnote 1].
It is also important to note that there are differences in the ethnicity distribution and rates of achieving a Job Outcome across the payment groups, and these differences should be taken into account when making comparisons between the different ethnic groups for the rates of achieving a Job Outcome.
9. About these statistics
Statistical products
This statistical release gives an overview of the Work Programme. We present key points and trends using charts and commentary. We publish the data underlying the charts either as statistical tables in ODS format or via DWP’s Stat-Xplore tool.
Changes and notices about this release
The regular release of these statistics was paused after the March 2018 release (data to December 2017). This was due to changes in the payment scheme and resulting changes to how performance information was recorded, which necessitated significant re-development of the statistics.
This new release marks the cessation of these statistics and is therefore the final set of statistical information relating to the Work Programme. The release includes revisions to the previously published series, and paints a picture of the overall performance of the programme.
A number of changes have been made since the previous release in March 2018:
-
there are fewer statistical tables accompanying the release. Further breakdowns of the data are available via Stat-Xplore
-
during the production of this release, we identified an error in the previous releases published between April 2015 and June 2018. During this period, incorrect validation rates had been applied to the contracts for a number of Sustainment Outcome payments. This affected the majority of information concerning Sustainment payments. This release includes a revised back series and has been corrected for this error. We have no plans to update the previous releases. For more details, please refer to the Background Information Note
-
there have been various minor changes to methodology since the previous release of these statistics. For further information about these changes, please refer to the Background Information Note
-
due to the aforementioned changes in methodology, we have deemed it suitable to rebadge this release as ‘Official Statistics’. The National Statistics badge is retained for previous releases
10. Where to find out more
Work Programme statistics
The Background Information Note provides further information on the Work Programme and Work Programme National and Official Statistics. A technical annex in this note provides information on some of the processes involved in developing and releasing National and Official Statistics on the Work Programme.
Employment Programme statistics
Statistics and future release dates for all DWP employment support programmes.
Other National and Official Statistics
Details of other National and Official Statistics produced by the Department for Work and Pensions can be found on the GOV.UK website.
Authors: Kirsty Mackenzie and James Kerr
Lead statistician: Juwaria Rahman
ISBN: 978-1-78659-256-9
-
The methodology taken is the Cabinet Office standard approach for comparing ethnic disparities. For more details, please see the Background Information Note. ↩