Women and the Criminal Justice System 2021
Published 24 November 2022
Applies to England and Wales

© Crown copyright 2022
This publication is licensed under the terms of the Open Government Licence v3.0 except where otherwise stated. To view this licence, visit nationalarchives.gov.uk/doc/open-government-licence/version/3 or write to the Information Policy Team, The National Archives, Kew, London TW9 4DU, or email: psi@nationalarchives.gov.uk.
Where we have identified any third party copyright information you will need to obtain permission from the copyright holders concerned.
This publication is available at https://www.gov.uk/government/statistics/women-and-the-criminal-justice-system-2021/women-and-the-criminal-justice-system-2021
1. Executive Summary
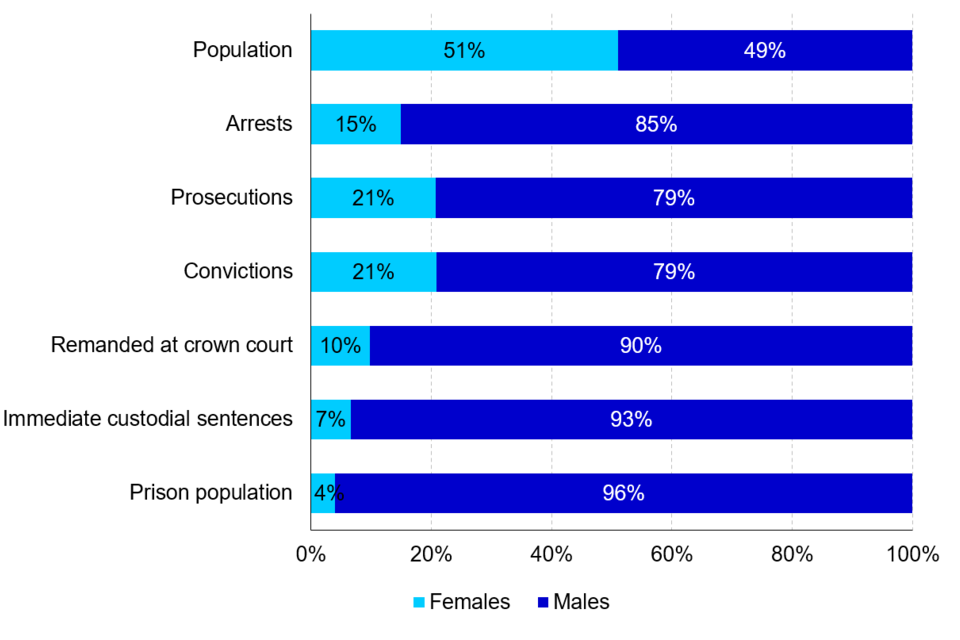
This publication compiles statistics from data sources across the Criminal Justice System (CJS), to provide a combined perspective on the typical experiences of females who come into contact with it. It considers how these experiences have changed over time and how they contrast to the typical experiences of males. No causative links can be drawn from these summary statistics, differences observed may indicate areas worth further investigation, but should not be taken as evidence of unequal treatments or as direct effects of sex.
In general, females appear to be substantially underrepresented throughout the CJS compared with males. This is particularly true in relation to the most serious offence types and sentences, though patterns by sex vary between individual offences.
Figure 1.01: Proportions of males and females throughout the CJS, 2021, England and Wales
Victims
| Males maintain higher risk of being victim to personal crime than females. | In 2021/22, 3.3% of males were victim to personal crime, compared to 2.9% of females. |
| In 2020/21, 594 homicides were recorded; 70% of victims were male and 30% female. | In over half (54%) of female homicide victims (where the suspect was known), the suspect was their partner or ex-partner. |
Police Activity
| The majority (85%) of arrests continue to be accounted for by males in 2021/22. | The number of arrests has decreased by 3% when compared to 2019/20 but has increased by 2% in the latest year. |
| The proportion of Out of Court Disposals (OOCDs) issued to females has fallen. | The number of OOCDs issued overall has decreased in the latest 5 years. The proportion of Penalty Notices for Disorder (PNDs) issued to females fell from 22% in 2017 to 15% in 2021 and the proportion of cautions issued to females fell from 23% in 2017 to 21% in 2021. |
Defendants
| In 2021, 79% of individuals dealt with by the Criminal Justice System were male, and 21% were female. | The proportion of females dealt with has decreased from 26% in 2017 to 21% in 2021. This is likely a result of the COVID-19 pandemic and restrictions placed on criminal courts as a result. Between 2017 and 2019, proportions of females and males remained constant. |
| Females were typically dealt with for less severe offences at court. | Of all female defendants prosecuted at court, 14% were prosecuted for indictable offences compared to 23% of male defendants in the latest year. |
| In 2021, the average custodial sentence length for male offenders was 22.7 months compared to 14.5 months for female offenders. | A greater proportion of female offenders are sentenced for offences that tend to receive shorter sentences. |
Offender Management
| The majority (96%) of the prison population were male. | As at 30 June 2022, 4% of the prison population were female, this proportion has remained stable for the last 5 years. |
| Females were serving shorter custodial sentence lengths. | As at 30 June 2022, 17% of females and 7% of males were serving sentences of less than 12 months. |
| In the 2021/22 HM Inspectorate of Prisons survey, females reported a high level and breadth of personal need. | Compared to males, a higher proportion of females reported: self-declared mental health problems, physical disability, having drug and alcohol problems, money worries and housing worries. |
| A higher proportion of female prisoners self-harmed in 2021. | In 2021, the number of individuals who self-harmed per 1,000 prisoners was 350 for females and 135 for males. The number of instances of self-harm per self-harming individual was over twice as high for females at 10.6. |
Offender characteristics
| Ethnic minority groups accounted for a higher proportion of prosecutions against males compared to females. | In 2021 Black males were particularly over-represented, accounting for 12% of all male prosecutions. This compared to Black females accounting for 7% of all female prosecutions. |
| A higher proportion of female offenders were first time offenders, than males. | Of all female offenders cautioned/convicted in 2021, 35% were first time offenders (22% for males). |
| Females had a higher average number of reoffences per reoffender compared to males. | Females had a higher average number of reoffences per reoffender compared to males, at 3.97 and 3.69, respectively. |
| Across all three measures, the educational attainment of young people who had been cautioned or sentenced for an offence was slightly higher for females than males. | For example, 15% of females achieved 5 or more GCSEs (or equivalents) graded A* to C, including English and Maths, compared to 13% of males. This is considerably lower than the all-pupil population (56%). |
| More than half of young people who had been cautioned or sentenced for an offence were eligible for FSM. | This was slightly higher for females (57%) than for males (53%). This contrasts with the proportion of pupils in the all-pupil population where 26% were eligible for FSM. |
Offence analysis
| TV licence evasion was the offence with the highest proportion of female defendants in 2021. | In 2021, 75% of those prosecuted for TV licence evasion were female. This offence accounted for 18% of all female prosecutions. |
| Theft from shops was the most common indictable offence for female defendants in 2021. | Theft from shops accounted for 21% of all female prosecutions for indictable offences, compared to 8% for males. Of the 19,900 defendants prosecuted for theft from shops, 5,600 (28%) were female. |
Practitioners
| Over the last 5 years, there have been increases in female representation across almost all CJS organisations and in the proportion of senior staff. | The largest increase in female representation was seen in HMPPS staff, from 47% in 2018 to 54% in 2022. |
2. Introduction
Section 95 of the Criminal Justice Act 1991 states that:
The Secretary of State shall in each year publish such information as they consider expedient for the purpose… of facilitating the performance of those engaged in the administration of justice to avoid discriminating against any persons on the ground of race or sex or any other improper ground…
Documents fulfilling this requirement have been published since 1992, in the form of statistical information. This report is a compendium of information from a range of data sources from across the CJS on the representation of females (and males) among victims, suspects, defendants and offenders.
The publication aims to help practitioners, policy makers, academics and members of the public understand trends in the CJS in England and Wales, and how these vary between the sexes and over time.
This is the latest biennial compendium of Statistics on Women and the Criminal Justice System and follows its sister publication Statistics on Race and the Criminal Justice System published last year. Her Majesty’s Prison and Probation Service (HMPPS) Equalities report was also released on the same day as this report.
In 2018, the Ministry of Justice published the Female Offender Strategy, which sets out the department’s vision and plan to improve outcomes for women in the community and custody. The strategy sets out the Government’s commitment to a new programme of work for female offenders, which will take some years to deliver, driven by our vision to see:
- fewer women coming into the criminal justice system and reoffending
- fewer women in custody, especially on short-term sentences, and a greater proportion of women managed in the community successfully; and
- better conditions for those in custody.
The strategy aims to take an evidence-based approach to reducing crime and rehabilitating offenders. The analysis in this report addresses the key subject areas and goes some way to provide an evidence base for monitoring progress and aiding policy making decisions for the future. The MoJ plans to publish a Female Offender Strategy delivery plan in the New Year setting out our plans for delivering these aims in the period to 2025.
Limitations on conclusions
Although we explore differences between sexes, it is important that inferences are not made about individuals from group-level data – since we consider averaged outcomes that do not take into consideration the unique sub-set of circumstances in each case. If we take, for example, defendants: there can be a number of points of contact with the CJS, which range from an out of court disposal to standing trial in front of a jury. The sentencing outcome that a person receives depends upon the crime committed, their offending history and a series of mitigating and aggravating factors unique to the person or crime. Because of this, the statistics presented in this report do not represent the expected experiences of an individual female (or male) throughout the Criminal Justice System, but they can highlight areas where further investigation or research may be warranted.
It is important to note that for the majority of the report, no controls have been applied for other characteristics of those in contact with the CJS, such as average income or age, so it is not possible to determine what proportion of any differences identified in this report are directly attributable to sex. Much of the published annual Criminal Justice Statistics and some of the statistics published elsewhere can be cross-tabulated with other protected characteristics, such as ethnicity and age, however care must be taken when interpreting the results. It is also not possible to make any causal links between sex and CJS outcomes.
Recording of sex
‘Sex’ can be considered to refer to whether someone is male or female based on their physiology, with ‘gender’ representing a social construct or sense of self that takes a wider range of forms.
Throughout this report we refer to sex rather than gender, because the binary classification better reflects how individuals are generally reported or managed through the CJS. For example, prisons are either male or female institutions, with prisoners normally placed based on their legally recognised gender. However, given the range of recording practises (see technical guide for details) throughout the CJS, it is likely that most recording includes a mixture of physiological and personal identity. Similarly, we refer to females / males and women / men in this report, as a reflection of the binary classification in use.
Data
Every effort is made to ensure that the figures presented are accurate and complete. However, these data have been extracted from large administrative and survey data systems generated by the courts, police forces and other agencies. As a consequence, care should be taken to ensure the limitations of these data are taken into account.
All results relate to England and Wales unless explicitly stated otherwise. Large figures are generally presented rounded to the nearest thousand, and percentages to the nearest percentage point in the bulletin text (or however is most appropriate).
Data are presented in terms of calendar and financial years (usually 2021 or 2020/21), reflecting the reporting cycles and data collection of the agencies contributing information for this publication. For example, data on arrests are presented in financial years, while data from courts is presented in calendar years.
A 5-year time series’ have been presented wherever possible, of whichever length is most appropriate in context. There are few comparisons to the population as a whole, but we have considered this to be 51% female, as based on population and household estimates from the Office for National Statistics 2021 census data.
Measures in this bulletin for 2020 and 2021 have been impacted by actions taken in response to the COVID-19 pandemic and the latest figures represent both a reflection of the pandemic and the recovery from this. For example, in April 2020, the Judiciary published guidance on the prioritisation of listings[footnote 1]. During the reporting period, all offences likely to result in custody were prioritised which impacted outcomes such as custody rate and average custodial sentences. This should be taken into consideration when interpreting trends that incorporate affected figures (e.g. prosecutions, convictions, sentencing, including ACSL and custody rates).
The statistics reported in this bulletin are primarily National Statistics[footnote 2], as drawn from either other published National Statistics bulletins or the data underpinning them. However, as in previous reports, in order to present as full a picture as possible we have also included some statistics that do not have this badging where National Statistics are not held on important or new topics. These include:
-
Survey data from Her Majesty’s Inspectorate of Prisons Annual Report
-
Youth Custody data (Official Statistics)
-
Understanding Educational Background of Offenders (MoJ/ DfE data share)
-
Workforce data for CPS, MoJ, HMPPS (Official Statistics), judiciary/magistrates (Official Statistics)
-
Parole board
Where a source is not National Statistics, users should consider this when making judgements about the weight that can be put on related findings.
Information provided
-
Supplementary Excel (in an Open .ods format) tables accompany the chapters, providing additional data where the figures have not previously been published (or not published in that form). Where figures have been published, links are provided as part of the text and tables.
-
A technical document titled A Technical Guide to Statistics on Women and the Criminal Justice System is available alongside this report, which provides users with information on the concepts and terminology used within the report, as well as information about data sources, data quality and references.
-
A document titled A User Guide to Statistics on Women and the Criminal Justice System which provides an overview of what is included in the report and further information surrounding the additional dashboard and user engagement strategy.
-
A dashboard (PowerBi) to allow users to have more interactivity with visualising trends, with additional breakdowns where possible.
-
This report is also accompanied by an infographic summarising key findings.
The production team is looking to focus more on the dashboard and reduce commentary within the WCJS bulletin in the future in order to maximise the experience of our users and flexibility of analysis. Feedback on this proposal is welcomed. Please complete the survey here to contact the team.
The Ministry of Justice would welcome any feedback on the content, presentation or on any other aspect of this bulletin – we can be contacted through: CJS_Statistics@justice.gov.uk
3. Victims
Males maintain higher risk of being victim to personal crime than females.
In 2021/22, 3.3% of males were victim to personal crime, compared to 2.9% of females.
In 2020/21, 594 homicides were recorded; 70% of victims were male and 30% female.
In over half (54%) of female homicide victims (where the suspect was known), the suspect was their partner or ex-partner.
This chapter explores the nature, extent and risks of victimisation, as reported in the Telephone-operated Crime Survey for England and Wales (TCSEW): year ending March 2022[footnote 3][footnote 4][footnote 5][footnote 6] and Homicide in England and Wales: year ending March 2021.
Due to the coronavirus pandemic the CSEW was moved to a telephone format referred to as the TCSEW. As a result, certain tables included in the previous Women and the Criminal Justice System publication could not be produced and therefore have not been included. This has resulted in a shorter commentary with several sections excluded, specifically, any tables relating to children’s experience with crime, perceptions of the Criminal Justice System, and intimate violence (sexual assault and domestic abuse). The CSEW has returned to face to face interviews so future publications will include the data that was not available this time around.
3.1 Telephone-operated Crime Survey for England and Wales[footnote 7]
Risks of victimisation
In the year ending March 2022 (referred to as 2021/22 throughout), the proportion of adults who were victim of a TCSEW crime (excluding fraud and computer misuse) was 10.9%, down from 12.4% the year before, with no significant difference between men and women.
Personal crime[footnote 8]
In 2021/22, 3.3% of male adults reported being the victim once or more of a TCSEW personal crime (excluding fraud and computer misuse). There was not a significant difference to that of female adults in the same year at 2.9%.
Figure 3.01: Percentage of adults who were victims of a TSCEW personal crime, by type, year ending March 2021, England and Wales
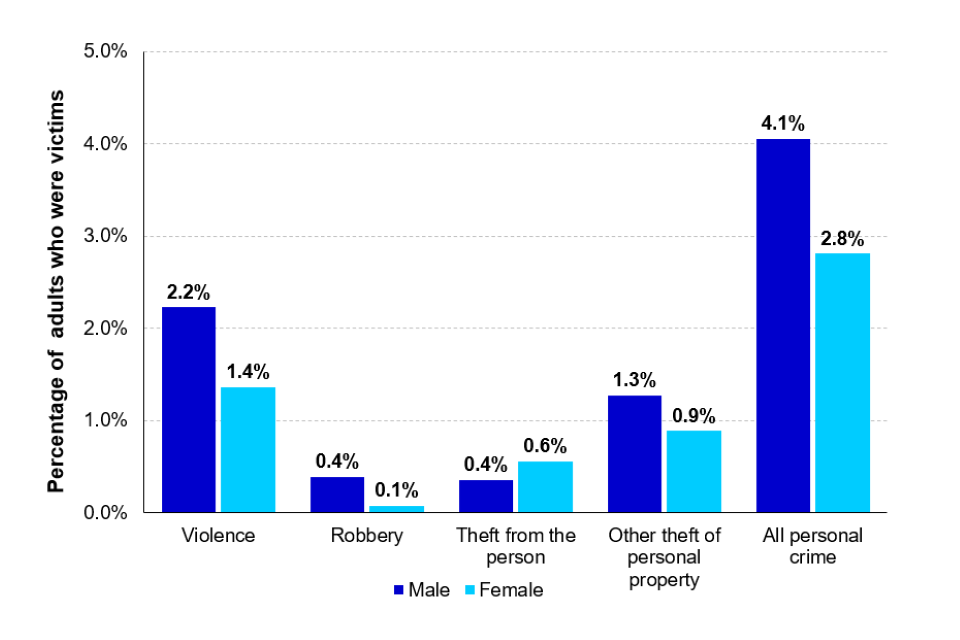
(Source: Ministry of Justice – Women and the Criminal Justice System: Chapter 3: Victims - Table 3_02 and 3_03 [derived from ONS, TCSEW])
The TCSEW 2020/21 provides the most recent breakdown of personal crime by offence (Figure 3.01). Males were significantly[footnote 9] more likely to fall victim to violence and robbery compared to females.
Looking at TCSEW personal crime broken down by age for 2021/22, a higher percentage of females were victim of theft from the person than males. Male adults aged 35-44 reported the highest prevalence of personal crime (5%), whereas with females it was adults aged 25-34 who reported the highest level of personal crime (4.7%).
3.2 Violent Crime
Violent crime was reported by a higher proportion of males (2.2%) than females (1.4%) in 2020/21.
Age
Violent crime was most prevalent in the 18-24 age group (Fig 3.02). The proportion of adults who experienced violent crime generally decreased with increasing age. Males had a higher proportion of those who experienced violent crime than females for all age groups.
Figure 3.02: Percentage of adults who were victims of violent crime, by age group, year ending March 2021, England and Wales
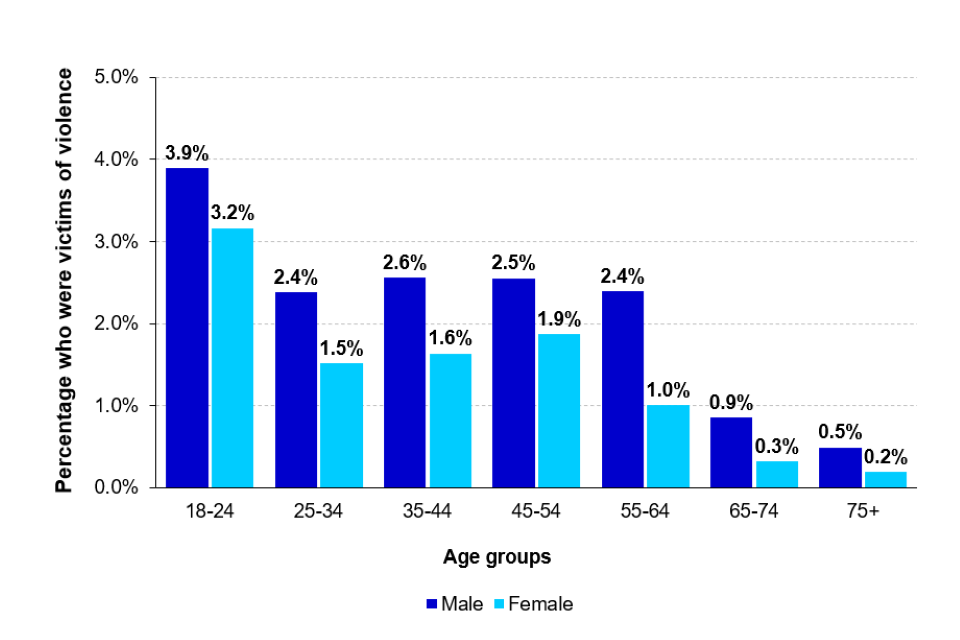
(Source: Ministry of Justice – Women and the Criminal Justice System: Chapter 3: Victims – Table 3_05 [derived from ONS, TCSEW])
Homicide[footnote 10]
In 2020/21, 594 individuals were victims of homicide in England and Wales down from 673[footnote 11] in 2019/20; 70% of which were males and 30% females (Fig 3.03). The relative proportion of male and female victims has remained relatively consistent over the last five years[footnote 12]. The most common age group for female victims of homicide was those 25-34 years old (20%). This was also the most common age group for male victims (21% of male victims), closely followed by victims aged 16-24 years old (20%). Male homicide victims had higher prevalence in all age groups, except those 65-74 years old (61% female victims), and 1-4 years old (53% female victims), where there were slightly more females than male victims.
Figure 3.03: Number of homicide offences currently recorded by the police, by sex of victim, 20016/17 to 2020/21, England and Wales
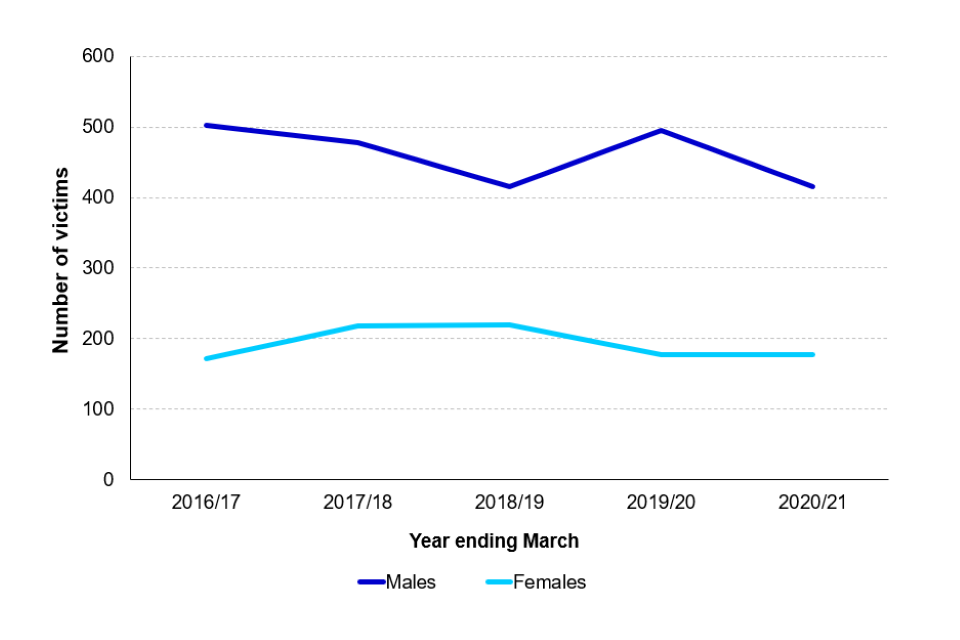
(Source: Office for National Statistics – Homicide in England and Wales – Worksheet 4)
Method and Location[footnote 13]
In 2020/21, the most frequent method of killing was ‘sharp instrument’ for both males (44%) and females (29%), accounting for 40% of all homicides, consistent with previous years. For females, this was followed by ‘Not known’ (16%) and ‘Other’ (15%). For males, it was followed by ‘hitting, kicking, etc.’ (21%).
The majority of female homicides took place in or around a house/dwelling (76%), whereas only 44% of male homicides took place here. Males were proportionately more likely to be victims of homicide in public places, notably on the street (males: 29%; females: 5%). This reflects the difference in relationship of the victim to the suspect in cases for males and females – with females more likely to be killed by an acquaintance and males more likely to be killed by a suspect not known to be acquainted with the victim.
Relationship to Suspect and Circumstance[footnote 14]
In homicides where the principal suspect was known to the victim, 54% of cases with female victims suspected the partner/ex-partner[footnote 15], whereas when the victim was male, only 5% of cases suspected the partner/ex-partner. In homicides with victims under the age of 16, where the principal suspect was charged, 83% of suspects were the parent (male victims: 76%; female victims: 92%).
Almost half (49%) of adult female homicide victims were killed in a domestic homicide[footnote 16] (75). Of the 75 female victims, 72 were killed by a male suspect.
Males were much less likely to be the victim of a domestic homicide, with only 10% (39) of male homicides being domestic related in the latest year, a similar proportion to the previous year.
4. Police Activity
The majority (85%) of arrests continue to be accounted for by males in 2021/22.
The number of arrests has decreased by 3% when compared to 2019/20 but has increased by 2% in the latest year.
The proportion of Out of Court Disposals (OOCDs) issued to females has fallen.
The number of OOCDs issued overall has decreased in the latest 5 years. The proportion of Penalty Notices for Disorder (PNDs) issued to females fell from 22% in 2017 to 15% in 2021 and the proportion of cautions issued to females fell from 23% in 2017 to 21% in 2021.
This chapter explores the activity of the police, by the sex of the suspect or offender they deal with. It covers statistics on stop and searches and arrests, which are published by the Home Office in the Police Powers and Procedures, England and Wales, year ending 31 March 2022 publication. There are also sections covering statistics on out of court disposals which come from the Criminal Justice Statistics Quarterly: December 2021 publication, published by the Ministry of Justice.
4.1 Stop and searches[footnote 17][footnote 18]
Police officers have the power to stop and search individuals under different pieces of legislation. In this chapter, those conducted under section 1 of the Police and Criminal Evidence Act 1984 (PACE) and section 60 of the Criminal Justice and Public Order Act 1994 have been combined[footnote 19].
The total number of stop and searches in 2021/22 was 503,000. The proportion of female suspects who were stop and searched was 10% in the latest year.
Age groups[footnote 20]
In 2021/22, the highest proportion of female stop and searches were of those aged 30 or above (41% of all female stop and searches), whereas the highest proportion of male stop and searches were of those aged 18-24 (34% of all male stop and searches).
Reason for stop and search
When conducting a stop and search, police record the reason for the stop and search, as well as the sex of the person searched[footnote 21]. There are various reasons why the police may carry out a stop and search, for example they may suspect an individual is carrying drugs or a weapon.
For both males and females, drugs were the most common reason for stop and search, at 64% of male and 66% of female stop and searches in 2021/22. Females accounted for 11% of all stop and searches for drug offences. The second most common reason for female stop and searches was stolen property offences, accounting for 14% of all female stop and searches.
Stop and search outcomes
Stop and search is an important detection tool for the police – it allows officers to search individuals without an arrest taking place[footnote 22].
In 2021/22, 22% of both male and female stop and searches resulted in an outcome that was linked to the reason for the search, i.e. the officer found what they were searching for[footnote 23]. A slightly higher proportion of males had an outcome of not linked (4% compared to 3% for females). Following stop and search, 75% of females and 74% of males had an outcome of nothing found.
In 2021/22, 71% of stop and searches (where sex is known) resulted in the principal outcome ‘no further action’[footnote 24]. Arrests were the principal outcome in 13% of stop and searches, community resolutions 8% and other outcomes 8% [footnote 25]. A higher proportion of male suspects received the principal outcome of arrest at 13%, compared to 10% of female suspects.
4.2 Arrests[footnote 26][footnote 27]
In 2021/22, 659,000 arrests were carried out by police in England and Wales. This is a 3% decrease since pre-pandemic volumes (year ending March 2020) but a 2% increase since 2020/21. Females accounted for 15% of arrests, which has remained stable over the last 3 years[footnote 28].
Age groups[footnote 29]
The number of arrests has seen a larger decline for children than adults over the last 5 years, with decreases of 3% for adults and 17% for children since 2017/18. When split by sex, larger declines were seen over the last 5 years for male adults (4%) and children (17%) compared to females (2% and 16% respectively).
Figure 4.01: Number of arrests, by age group and sex, 2017/18 to 2021/22, England and Wales[footnote 30]
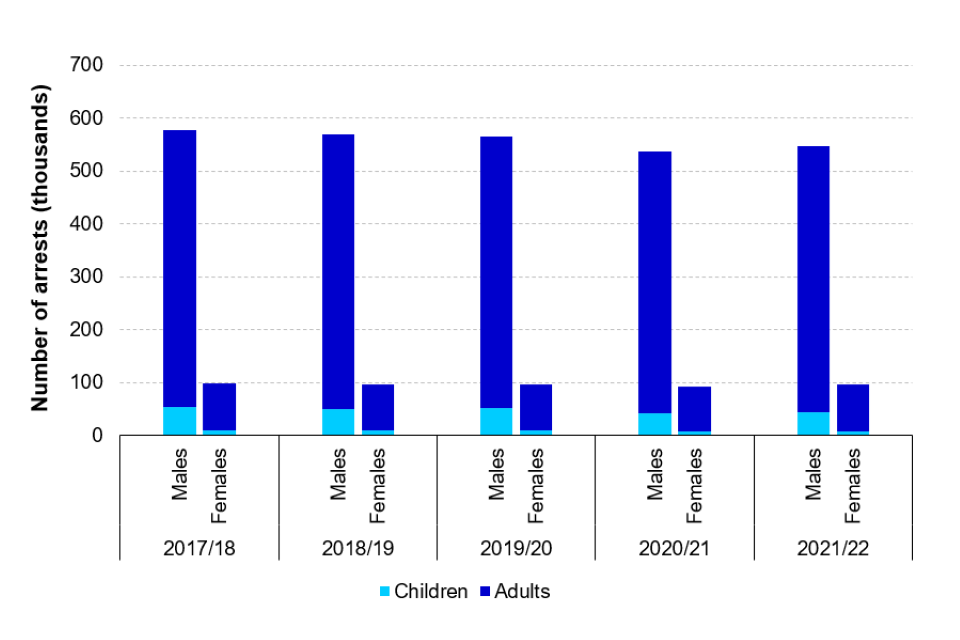
(Source: Home Office – Police Powers and Procedures: Stop and search and arrests – arrests open data tables)
Offence groups
In 2021/22, violence against the person offences accounted for the largest proportion of arrests for both males and females. These offences accounted for a larger proportion of female arrests (55% of all female arrests in comparison to 44% of all male arrests), whereas drug offences, sexual offences and miscellaneous crimes against society offences accounted for a larger proportion of male arrests.
Figure 4.02: Proportion of arrests within each sex group, by offence group, England and Wales, 2021/22, England and Wales
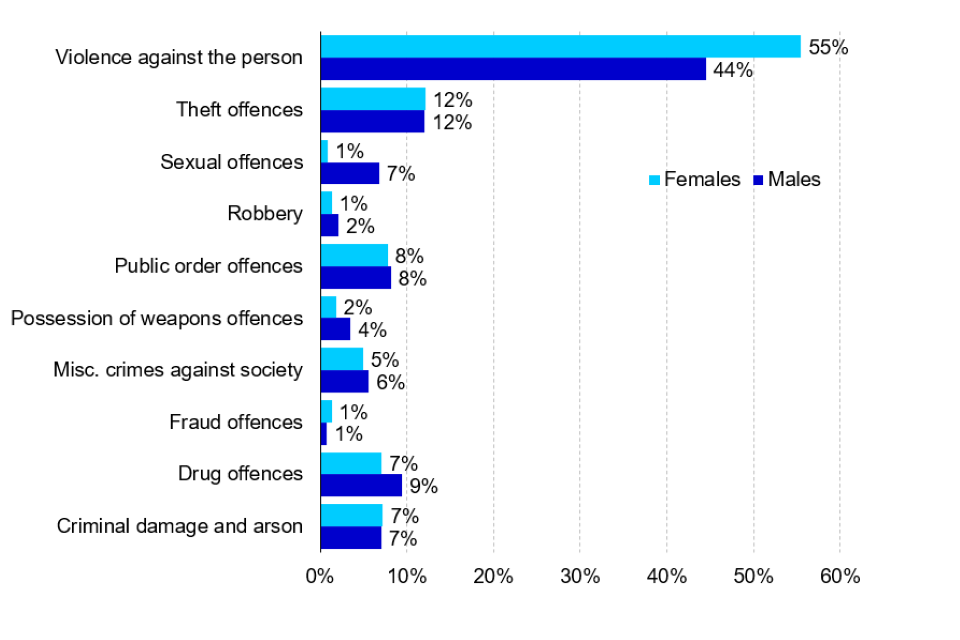
(Source: Home Office – Police Powers and Procedures: Stop and search and arrests – arrests open data tables)
4.3 Liaison and diversion services[footnote 31]
Liaison and diversion services data was not recorded by sex since the latest Women and the Criminal Justice System report and therefore will not be available in this edition of the report. The previous report covered the numbers of adults and young people who engaged with liaison and diversion services, and the proportions of males and females within these. It looked at the source of referral, most common offence groups and issued faced by those who engaged with liaison and diversion services. There is not currently a published source for the data that was collected. We are seeking to ensure this data will be recorded by sex in the future and therefore be able to be included in future releases of this publication.
4.4 Out of Court Disposals[footnote 32]
Penalty Notices for Disorder (PND)[footnote 33] issued
The number of PNDs issued has continued to decline over the last 5 years, falling by 49% from 26,000 in 2017 to 13,300 in 2021. The proportion of PNDs issued to females has also declined over the same period, from 22% in 2017 to 15% in 2021.
Figure 4.03: Number of Penalty Notices for Disorder issued, by sex, 2017 to 2021, England and Wales
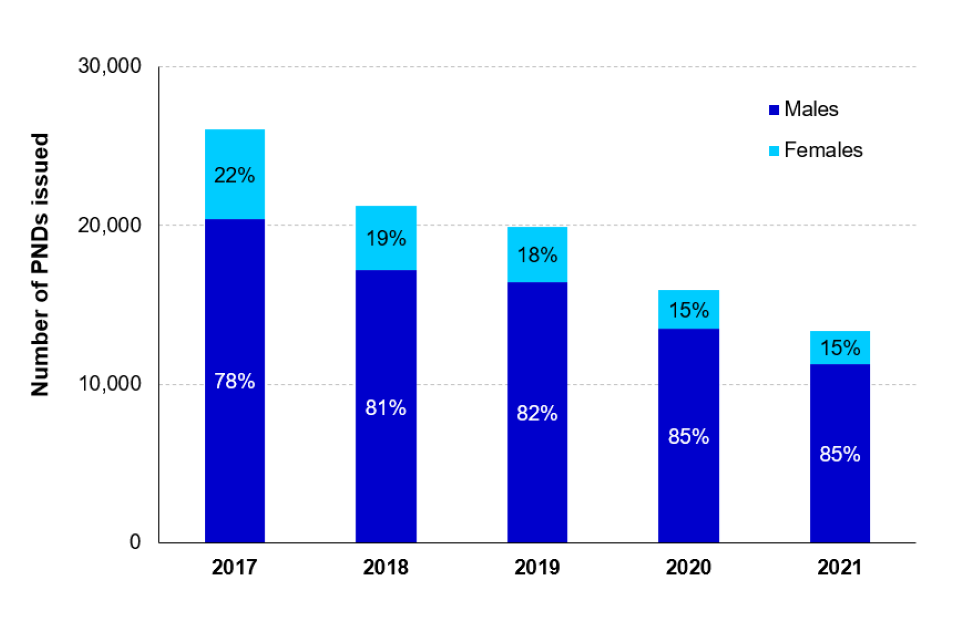
(Source: Ministry of Justice - Criminal Justice Statistics Quarterly: year ending December 2021 – Out of Court Disposals tool)
Penalty Notices for Disorder - Offences
In 2021, 99% of PNDs issued were for higher tier offences for females and 98% for males. This breakdown has remained relatively constant over the last 5 years.
Drunk and disorderly accounted for the highest proportion of PNDs issued to females in 2021, accounting for 48% of all female PNDs in comparison with 36% of all male PNDs. Possession of cannabis accounted for the highest proportion of PNDs issued for males in 2021, at 42% of all male PNDs in comparison with 13% of PNDs issued to females. In the latest year, a higher proportion (12%) of females were issued PNDs for theft (retail under £100) compared to males, however the proportion of females issued with PNDs for this offence has decreased since 2017 where offences of theft (retail under £100) accounted for 39% of female PNDs.
Figure 4.04: Percentage of Penalty Notices for Disorder issued, by offence and sex, 2021, England and Wales
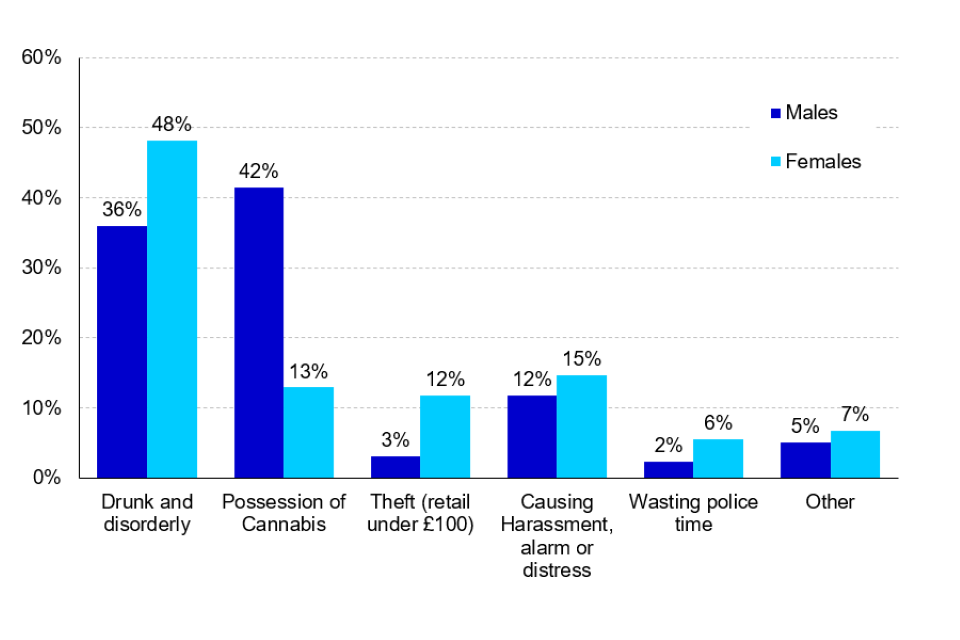
(Source: Ministry of Justice - Criminal Justice Statistics Quarterly: year ending December 2021 - Out of Court Disposals tool)
Penalty Notices for Disorder - Payment
In 2021, 49% of PNDs were paid in full, and 36% resulted in a fine for late payment. A lower proportion of females paid their PNDs in full (42%) compared to males (51%) and had a higher proportion of fines registered (39% compared to 35%).
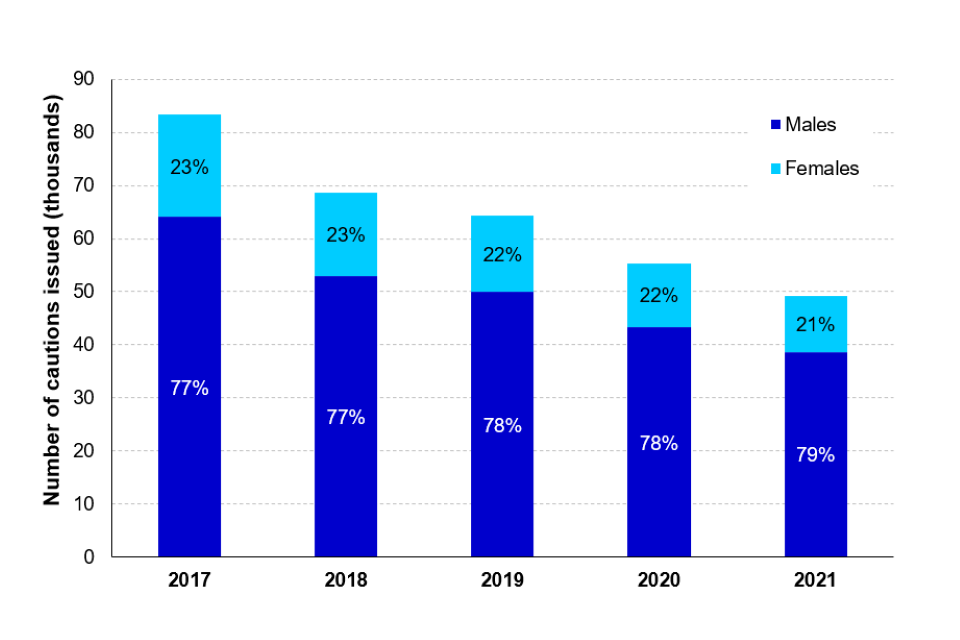
Cautions issued[footnote 34][footnote 35]
The number of cautions issued has declined over the last 5 years, falling by 41% from 83,300 in 2017 to 49,200 in 2021. Of these, 79% were issued to males and 21% were issued to females in 2021. The proportion of cautions issued to females has decreased slightly over the last 5 years, from 23% in 2017.
Figure 4.05: Number of cautions issued, by sex, 2017 to 2021, England and Wales
(Source: Ministry of Justice - Criminal Justice Statistics Quarterly: year ending December 2021 - Out of Court Disposals tool)
Cautions – Offences[footnote 36]
Of all cautions issued in 2021, 56% were for indictable offences, a proportion which has been increasing over the last 5 years, from 51% in 2017. The proportion of males issued a caution for indictable offences was 57%, compared to 53% for female offenders. A higher proportion of females were cautioned for violence against the person offences (22% compared to 11% for males). This proportion has increased since 2017, where violence against the person offences accounted for 10% of all female cautions. In contrast, a larger proportion of male offenders were cautioned for drug offences (26% compared to 13% for females).
Caution types[footnote 37]
The type of caution issued has been relatively consistent across males and females since 2019, with a slightly lower proportion of females receiving youth conditional cautions (4% of all female cautions) compared to males (6%). Both males and females have seen a rise in the proportion of adult conditional cautions being issued, mirrored by an equivalent decrease in adult simple cautions being issued.
Cautioning rates[footnote 38]
The overall cautioning rate has fluctuated slightly across the past 5 years, at 13% in 2017, decreasing to 11% in 2019 and has since increased to 14% in 2021. Overall cautioning rates have been consistently lower for females than males, at 10% for females and 12% for males in 2021. Females had a higher cautioning rate for indictable offences (20%) and a lower rate for summary offences (7%) compared to males (13% and 12% respectively) in 2021.
5. Defendants
In 2021, 79% of individuals dealt with by the Criminal Justice System were male, and 21% were female.
The proportion of females dealt with has decreased from 26% in 2017 to 21% in 2021. This is likely a result of the COVID-19 pandemic and restrictions placed on criminal courts as a result. Between 2017 and 2019, proportions of females and males remained constant.
Females were typically dealt with for less severe offences at court.
Of all female defendants prosecuted at court, 14% were prosecuted for indictable offences compared to 23% of male defendants in the latest year.
In 2021, the average custodial sentence length for male offenders was 22.7 months compared to 14.5 months for female offenders.
A greater proportion of female offenders are sentenced for offences that tend to receive shorter sentences.
This chapter explores outcomes for defendants in the Criminal Justice System (CJS) predominantly drawing on data from the Criminal Justice System statistics quarterly: December 2021 publication. Other sources in this chapter include Criminal Courts Statistics, Legal Aid Statistics and Pre-Sentence Reports. When a suspect is formally charged, they are brought before a magistrates’ court (as a defendant) as soon as possible. Following proceedings at magistrates’ court, defendants found guilty are subsequently convicted and sentenced. The defendant can be directed to appear in court or remanded on bail or custody. Figures for 2020 and 2021 in some categories such as custody rates and average custodial sentence lengths are affected by decisions made that affected courts in the early stages of the COVID-19 pandemic.
Figure 5.01: Journey of males and females through the CJS, 2021, England and Wales[footnote 39][footnote 40]
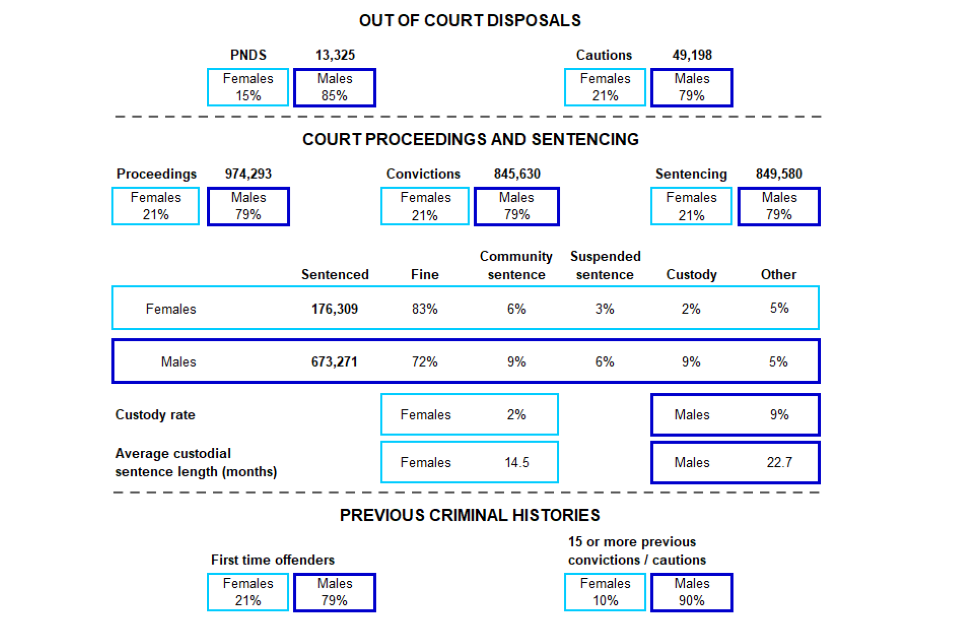
(Source: - Ministry of Justice – Criminal Justice Statistics Quarterly: year ending December 2021 – Out of Court Disposals, Outcomes by Offence and Criminal History data tools)
5.1 Individuals[footnote 41] formally dealt with by the Criminal Justice System (CJS)[footnote 42]
In 2021, 1.04 individuals[footnote 43] were formally dealt with by the CJS, either by an out of court disposal (OOCD) or court proceedings. 215,000 were female (21%) and 822,000 (79%) were male. Over the last 5 years, covered by this report, the number of individual formally dealt with has decreased, with proportions of males and females fluctuating in 2020 and 2021, likely a result of the COVID-19 pandemic and restrictions placed on criminal courts as a result[footnote 44]. Between 2017 and 2019, proportions of females and males remained constant at 26% and 74%.
Figure 5.02: Individuals dealt with formally by the CJS, by sex, 2017 to 2021, England and Wales
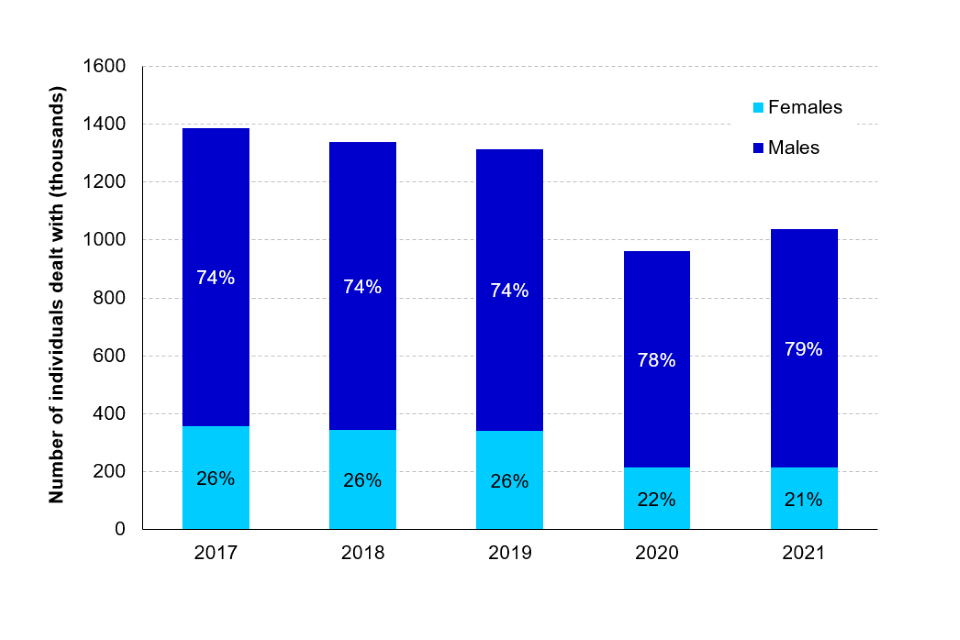
(Source: Ministry of Justice - Criminal Justice Statistics Quarterly: year ending December 2021 - Outcomes by Offence data tool)
5.2 Prosecutions[footnote 45][footnote 46]
21% of all prosecutions were for female defendants in 2021, a decrease of 5 percentage points compared to 2017.
The number of prosecutions for female defendants fell by 39% in the last 5 years, from 332,000 in 2017 to 202,000 in 2021. Male prosecutions decreased by 18% in the same period, from 945,000 in 2017 to 772,000 in 2021.
In 2021, just under half (47%) of the prosecutions for female defendants were for summary motoring offences, compared to 57% of male defendants. A higher proportion of males were proceeded against for indictable offences (23%) compared to females (14%). Over the last 5 years, the proportion of prosecutions for summary non-motoring offences has been decreasing for both male and female defendants, offset by increases in indictable and summary motoring offences, and accounted for 39% of female prosecutions and 20% of male prosecutions in 2021.
Figure 5.03: Proportion of defendants proceeded against at magistrates’ courts, by offence type and sex, 2017 to 2021, England and Wales
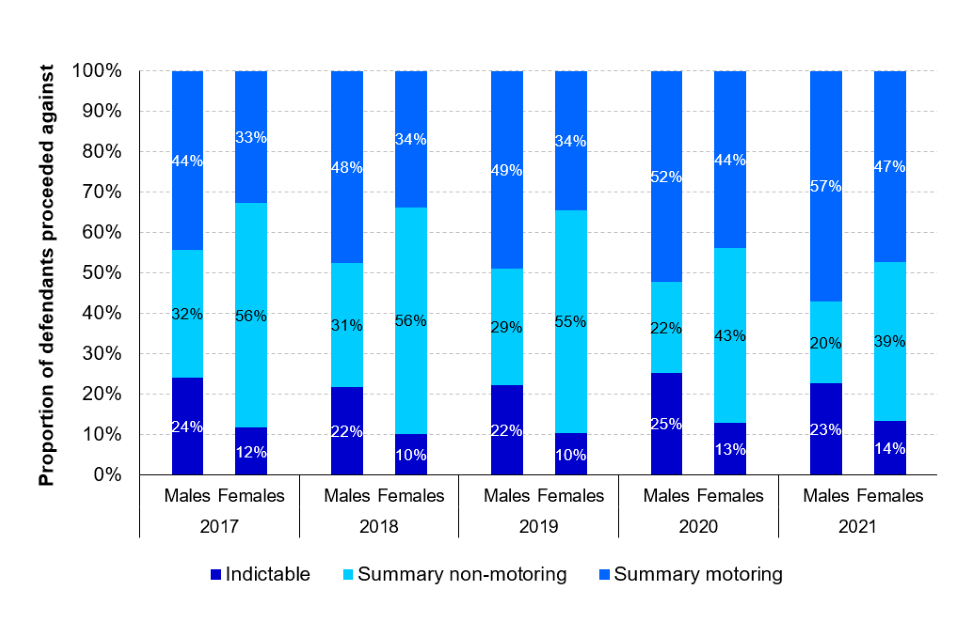
(Source: Ministry of Justice - Criminal Justice Statistics Quarterly: year ending December 2021 - Outcomes by Offence data tool)
5.3 Prosecuting authority[footnote 47][footnote 48][footnote 49][footnote 50]
In 2021, 21% of the 1.01 million defendants of known sex that had a completed case in the magistrates’ courts were female. Of all female prosecutions, 30% were brought forward by a prosecuting authority other than the police, compared to 10% for male defendants. The total number of prosecutions brought forward has decreased by 20% since 2019.
Figure 5.04: Proportion of the defendants brought to magistrates’ court by prosecuting authority and sex, 2021, England and Wales
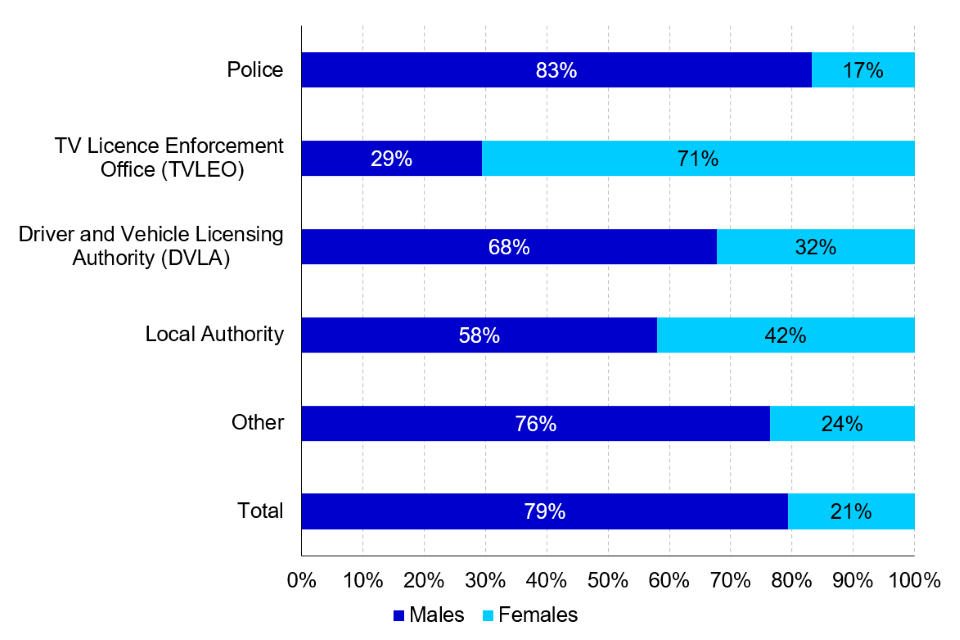
(Source: Ministry of Justice – Women and the Criminal Justice System: Chapter 5: Defendants – Table 5.07[derived from MoJ, Criminal Court Statistics])
Males accounted for over 50% of prosecutions brought forward by all prosecuting authorities in 2021 except for TVLEO, where females accounted for 71% of all prosecutions (where sex was known). Proportions of males and females brought forward by the police, TVLEO and DVLA have remained stable across the last 5 years, however a decrease was observed in the proportion of females prosecuted by the local authority and ‘other’ prosecuting authorities.
5.4 Criminal Legal Aid
Criminal legal aid consists of legal advice and representation provided to people being investigated or charged with a criminal offence, covering police stations, prisons, and the courts. Crime higher concerns legal representation in the Crown Court and above. Crime lower covers work carried out by legal aid providers regarding police station advice, magistrates’ court work and prison law.
In 2021, 15% of the total crime lower legal aid workload was for female clients and this proportion has remained stable over the last 5-year period[footnote 51]. The proportion of female legal aid recipients in the Crown Court was lower with 9% of the crime higher legal aid workload in 2021[footnote 52].
Figure 5.05: Crime lower legal aid workload, by sex and legal aid category, 2021, England and Wales
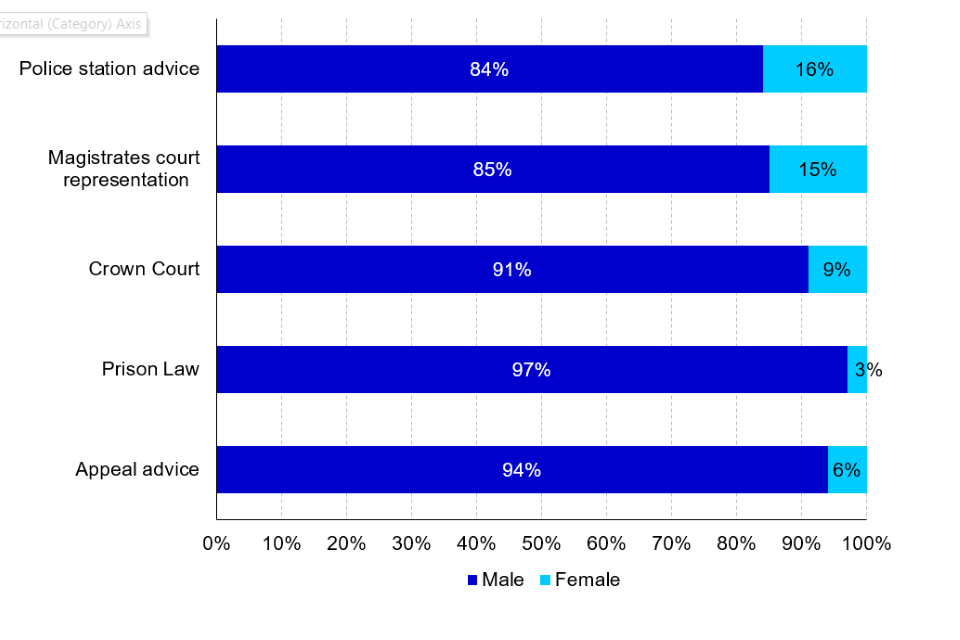
(Source: Ministry of Justice - Women and the Criminal Justice System: Chapter 5: Defendants – Table 5.01 [derived from MoJ, Legal Aid Statistics])
Police station advice and magistrates’ court representation constitute the majority of the total crime lower workload (98%). With police station advice alone making up 69% of the workload for males and 72% of females in 2021.
Prison law comprised less than 1% of the female and 3% of the male workload; both proportions have remained steady in the last 5 years but reflect falling prison population figures.
The most common offences for which female legal aid clients received police station advice were offences against the person (45%) followed by public order offences (9%). In magistrates’ court representation, 32% of workload were offences against the person and 15% theft - similar trends are found for males.
In the Crown Court, 91% of crime higher legal aid work related to male clients. This proportion has remained very similar over the last 5-year period. Just as with crime lower, there has been a decreasing trend in the volume of crown court legal aid. The proportions receiving legal aid in the Crown Court for indictable offences has remained relatively stable across the past 5 years at 28% for males and 29% for females.
5.5 Crown Court cases[footnote 53]
In 2021, the majority of defendants dealt with for triable-either-way cases that were sent to the Crown Court were sent on the direction of the magistrate (85%). This proportion was slightly lower for females (80%), than for males (85%).
In 2021, 14% of males and 20% females elected to be tried at the Crown Court. Between 2017 and 2021 there was a rise in proportion of defendants electing to be tried at the Crown Court, up 6 percentage points for females and 4 percentage points for males.
Representation at the Crown Court
When defendants appear in court, they have the right to either speak for themselves, or to be represented and to have someone with legal expertise speak on their behalf. Across males and females, the majority of defendants dealt with at the Crown Court were represented at their first hearing. The proportion of males and females represented fluctuated between 91% and 95% between 2017 and 2021, and was 93% for both males and females in 2021.
Plea at the Crown Court[footnote 54][footnote 55]
In each of the last 5 years, a consistently lower proportion of female defendants entered a guilty plea, at 62% in 2021 compared to 73% of male defendants. Jury trials were suspended during the early stages of the COVID-19 pandemic leading to a higher proportion of guilty plea cases being disposed of.
5.6 Convictions
The proportion of convicted offenders who were female followed a similar trend to prosecutions, at 21% in 2021, a decrease from 26% in 2017. Of females convicted in 2021, 13% were for indictable offences, in comparison to 22% of male convictions.
5.7 Remands[footnote 56][footnote 57]
Police and pre-court remand
In 2021, 1.02 million defendants[footnote 58] were directed to appear at magistrates’ courts (including those who failed to appear).
Over the last 5 years, a higher proportion of males were arrested and bailed or remanded in custody by the police, accounting for 16% and 12% respectively of all male remand decisions in 2021. In comparison, a lower proportion of female defendants were bailed (12%) or remanded in custody (5%) by the police in 2021, which may be due, in part, to the different types of offences for which females and males are prosecuted.
Magistrates’ court remand
Remands at magistrates’ court followed similar trends to police remands over the last 5 years, with lower proportions of female defendants bailed or remanded in custody. In 2020, COVID-19 prioritisation of more serious offences led to an increase of the proportion of defendants granted bail and remanded in custody at magistrates’ court.
Figure 5.06: Remand status at magistrates’ courts, by sex, 2017 to 2021, England and Wales
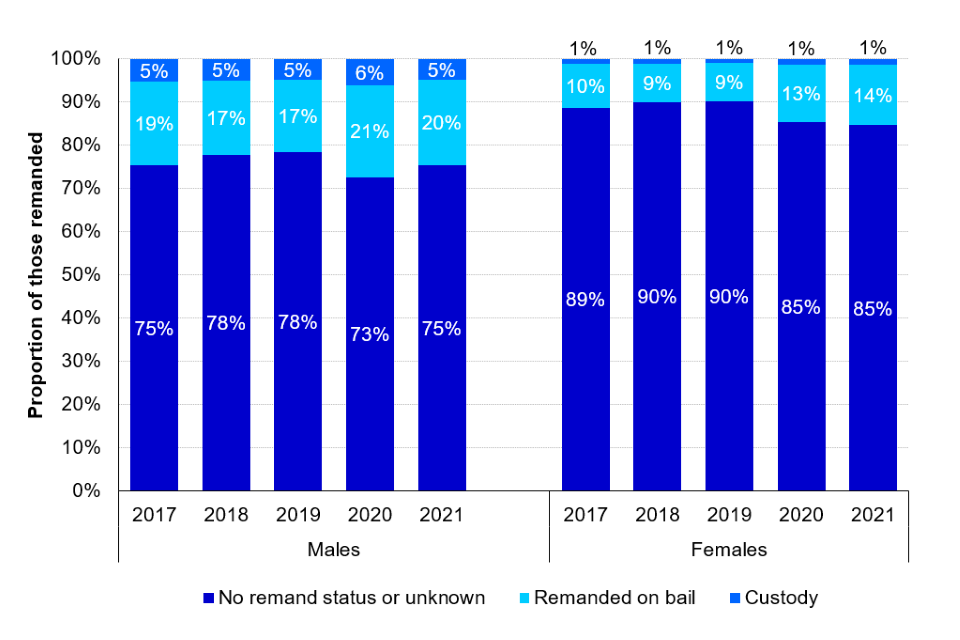
(Source: Ministry of Justice - Criminal Justice Statistics Quarterly: year ending December 2021 – Remands: Magistrates’ court data tool)
Of those remanded in custody at magistrates’ court in 2021, 66% of male defendants were sent for trial or sentencing at Crown Court, compared to 53% of female defendants. This is reflected in the higher proportion of females remanded in custody who were sentenced to immediate custody at magistrates’ court, at 13% in 2021 compared to 11% for males.
Crown Court remand
In contrast to what is seen for police and magistrates’ courts remand, females consistently had a higher proportion than males to be bailed at the Crown Court, with 51% of females receiving a remand status of bail at Crown Court in 2021, compared to 33% of males.
Figure 5.07: Remand status at Crown Court, by sex, 2017 to 2021
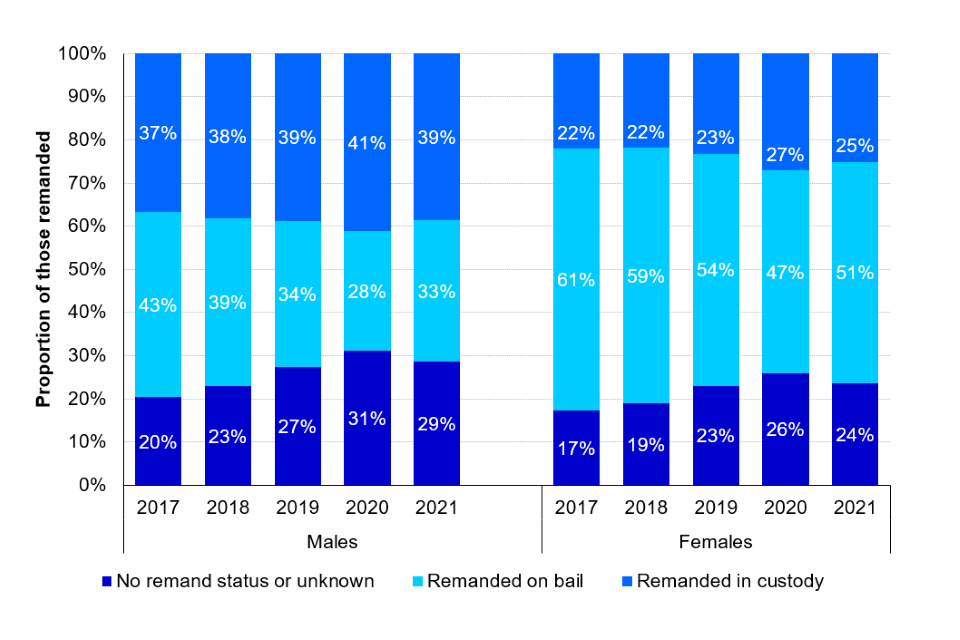
(Source: Ministry of Justice - Criminal Justice Statistics Quarterly: year ending December 2021 – Remands: Crown Court data tool)
Outcomes for defendants remanded in custody at Crown Court
Of those remanded in custody at Crown Court in 2021, 75% of male offenders were sentenced to immediate custody compared to 56% of females. These proportions gradually increased between 2017 (74% and 59% respectively) and 2019, but a decrease was observed in 2021. Compared to male offenders, a larger proportion of females were given suspended sentences in each of the last 5 years, at 7% and 17% respectively in 2021.
5.8 Case Management[footnote 59]
Effectiveness of trials[footnote 60]
Between 2017 and 2021, the proportion of ineffective trials has increased for both males (15% to 23% of male trials) and females (17% to 27% of female trials), with ineffective trials accounting for a higher proportion of all female trials than males in each of the last 5 years.
Across the same time period, the proportion of cracked trials has decreased for both males (from 34% to 29% of male trials) and females (from 38% to 30% of female trials), with cracked trials accounting for a higher proportion of all female trials than males in each of the last 5 years.
Consequently, females had a lower proportion of trials that were effective, compared to males, in each of the last 5 years, at 43% of female trials and 48% of male trials in 2021.
Timeliness[footnote 61]
In 2021, the median average days from the offence to the completion for defendants dealt with in magistrates’ courts criminal cases[footnote 62] was 194 days for females and 201 for males. This is a 34% increase (49 days) in median offence to completion from 2017 for females and a larger rise of 39% (56 days) for males.
The median average days from offence to completion for defendants dealt with in Crown Court criminal cases was 467 days for females and 390 for males. This is a 63% increase (180 days) in median offence to completion from 2017 for females and a 70% increase (161 days) for males.
At Crown Court, the median average days from the offence to completion for all individual offence groups was higher for females than males except for criminal damage and arson offences in 2021.The largest difference between males and females in median days from offence to completion is the 154 days longer (35% longer) for females for Miscellaneous crimes against society offence cases.
Figure 5.08: Median number of days from offence to completion (timeliness) at Crown Court, by offence group and sex, 2021, England and Wales
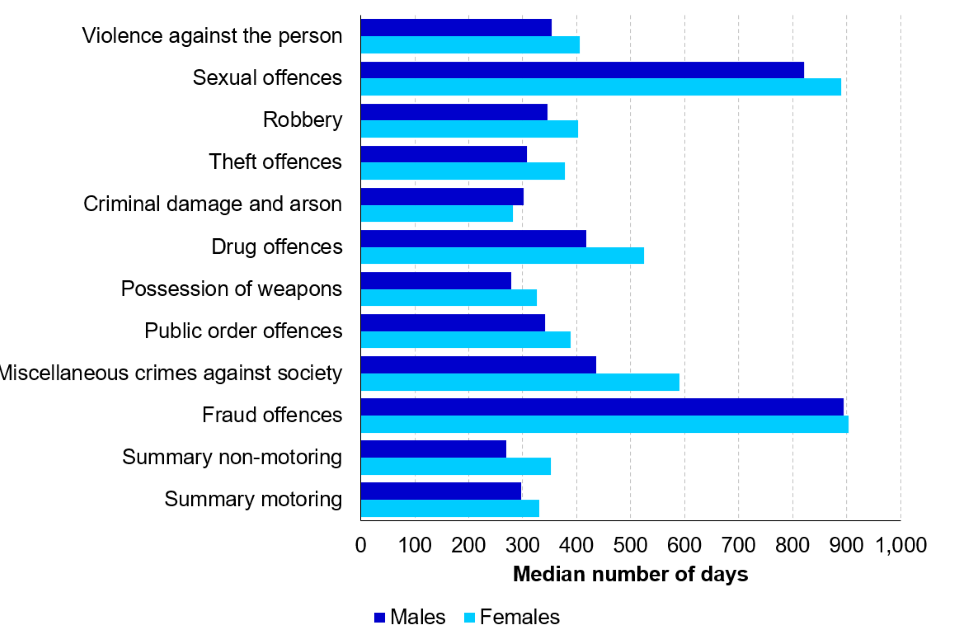
(Source: Ministry of Justice – Women and the Criminal Justice System: Chapter 5: Defendants – Table 5.10 [derived from MoJ, Criminal Court Statistics])
5.9 Pre-sentence reports[footnote 63]
In 2021, 15% of the 88,700 total pre-sentence reports (PSRs) prepared were for females, a proportion which has remained consistent in the last five years.
Since 2017, there has been a 32% decrease in the total number of PSRs issued. In 2021, 25% of all PSRs were oral, fast delivery PSRs[footnote 64]; oral fast delivery PSRs accounted for 29% of PSRs prepared for females and 25% of PSRs prepared for males. At 71% of all PSRs issued in 2021, written fast delivery PSRs were more common and accounted for 69% of all PSRs prepared for females and 71% of all PSRs prepared for males. Since 2017, there has been a 70% decrease in the number of oral fast delivery PSRs and a 27% increase in the number of written PSRs. Meanwhile, standard PSRs[footnote 65], which are given for more serious offences, were much less common and were given proportionally more often to male offenders (4%) compared with female offenders (2%). This aligns with the differences in the types of offence males and females were typically prosecuted for, as discussed in Chapter 8: Offence Analysis.
The decrease in oral PSRs issued between 2017 and 2021 is largely driven by a 59% decrease in the year 2020; this is a result of court closures/limited court activity as a response to the COVID-19 pandemic. The probation service was, therefore, limited in its capacity to deliver reports orally at court. Between 2020 and 2021, as the courts recovered to pre-pandemic activity, the number of standard and written PSRs increased by 38% and 46% respectively, while the number of oral PSRs remained at similar levels to 2020. Furthermore, in 2021, while standard PSRs accounted for 4% of the total number of PSRs, written PSRs accounted for 71% and oral PSRs accounted for 25%. This compares to 3%, 43% and 53%, respectively, in 2019, suggesting that, following the pandemic, there has been a shift from oral to written PSRs.
In 2021, the highest level of concordance between sentences proposed and sentences given (excluding suspended sentence orders)[footnote 66] for both males and females was for immediate custodial sentences. Males have had a higher level of concordance for immediate custodial sentences in each of the last five years, at 89% in 2021 compared to 83% for females in 2021. In contrast, females have had a higher level of concordance for community sentences in each of the last five years, at 61% in 2021 compared to 49% for males.
Figure 5.09: The level of concordance between sentences proposed and outcomes for female and male offenders, by sentence type, 2021, England and Wales[footnote 67]
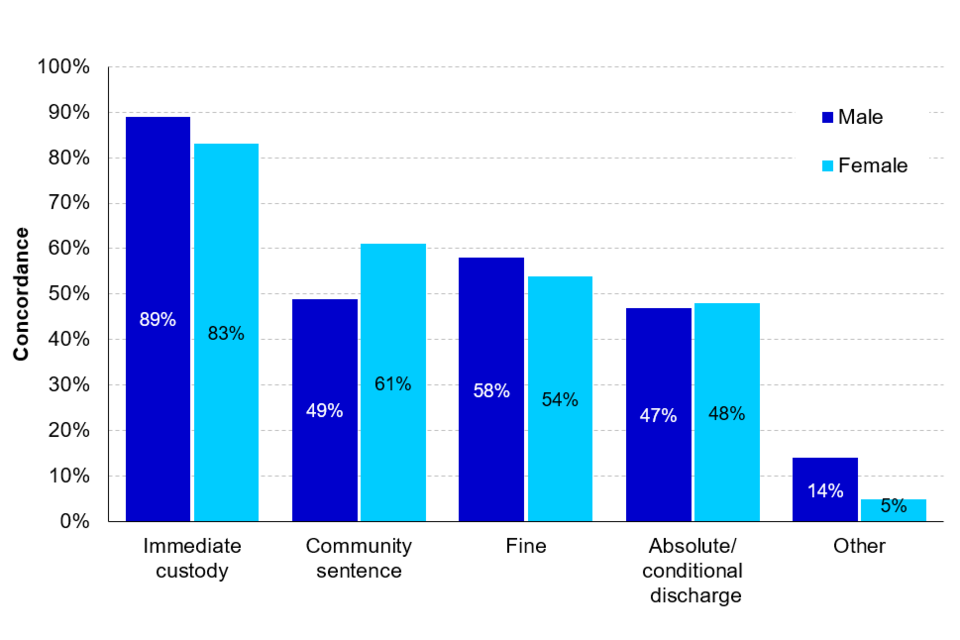
(Source: Ministry of Justice – Women and the Criminal Justice System: Chapter 5: Defendants – Table 5.16)
5.10 Sentencing[footnote 68]
In 2021, 850,000 offenders were sentenced, of which 21% were female. The proportion of females sentenced has decreased over the past 5 years, from 26% in 2017.
In 2021, fines remained the most common sentence given to both male and female offenders sentenced at all courts, but females typically had less severe sentencing outcomes. Of those sentenced, a consistently higher proportion of female offenders were fined and had a lower average fine than male offenders over the last 5 years.
In 2021, 83% of female offenders were sentenced to a fine with an average fine of £289, compared to 72% of male offenders with an average fine of £345. Compared to male offenders, a larger proportion of female offenders were prosecuted for summary offences, which may account for this difference.
Figure 5.10: Proportion of offenders sentenced, by sentencing outcome and sex, 2021, England and Wales
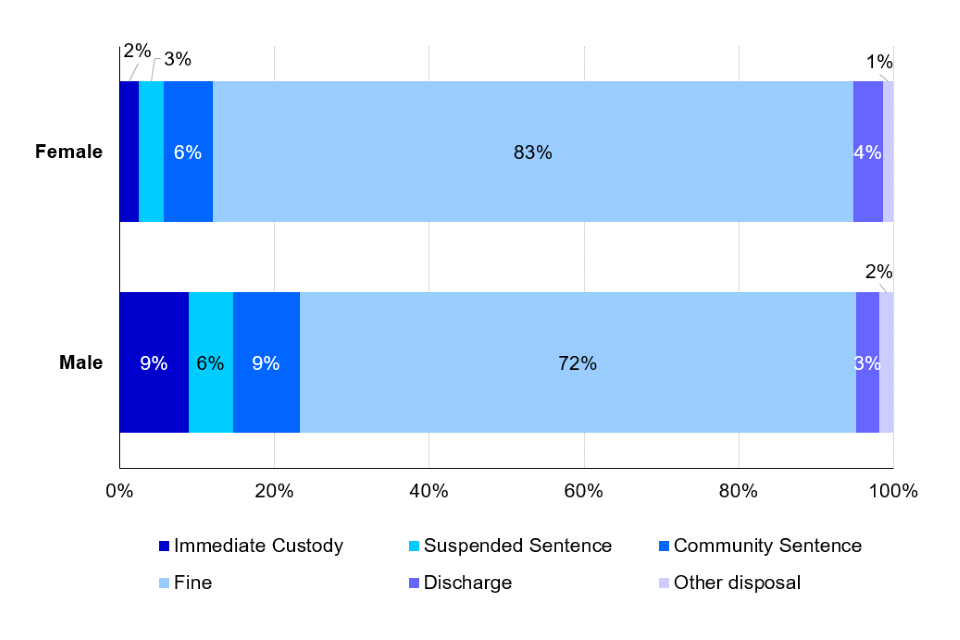
(Source: Ministry of Justice - Criminal Justice Statistics Quarterly: year ending December 2021 - Outcomes by Offence data tool)
Sentencing outcomes for indictable offences
In 2021, a smaller proportion of female offenders were sentenced for indictable offences at 13%, compared to 22% of male offenders.
When comparing sentencing outcomes for male and female offenders, a consistently larger proportion of male offenders receive custodial sentences whereas larger proportions of female offenders receive community sentences or a conditional discharge.
Figure 5.11: Proportion of offenders sentenced for indictable offences, by sentencing outcome and sex, 2021, England and Wales
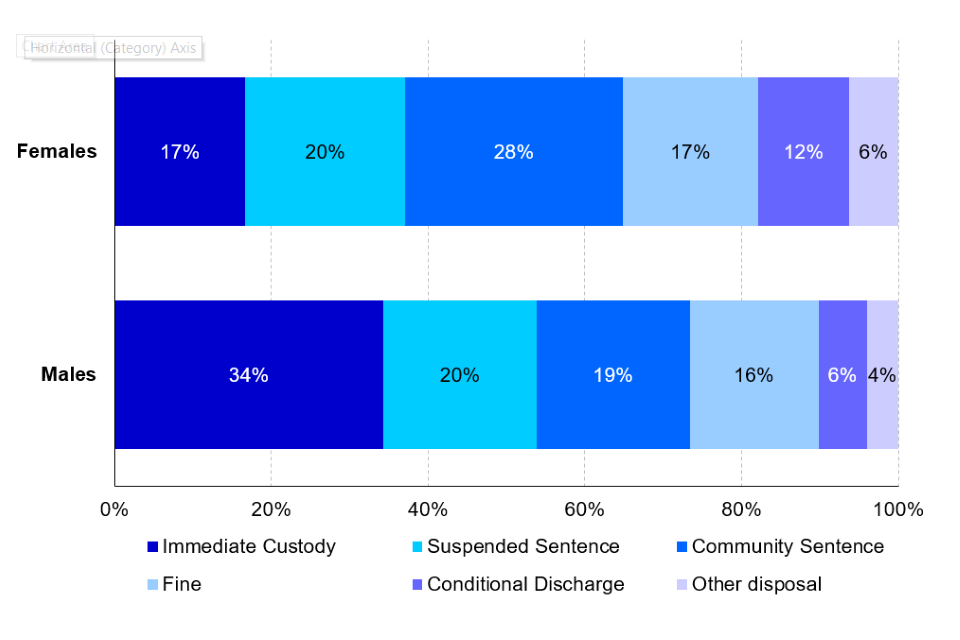
(Source: Ministry of Justice - Criminal Justice Statistics Quarterly: year ending December 2021 - Outcomes by Offence data tool)
Relative Rate Index (RRI)[footnote 69] analysis shows that females were 51% significantly less likely to be sentenced to immediate custody for indictable offences compared to males in 2021. RRIs have been consistently lower for females across the past 5 years, ranging between females being 43% to 46% less likely to be sentenced to immediate custody than males between 2017 and 2020.
Sentence lengths and average custodial sentence length (ACSL)
In 2021, 41% of female offenders who were sentenced to custody received sentences of up to and including 3 months, compared to 26% of males and these proportions have been decreasing for both female and male offenders over the last 5 years.
Figure 5.12: Proportion of offenders sentenced to immediate custody, by custodial sentence length and sex, 2021, England and Wales[footnote 70]
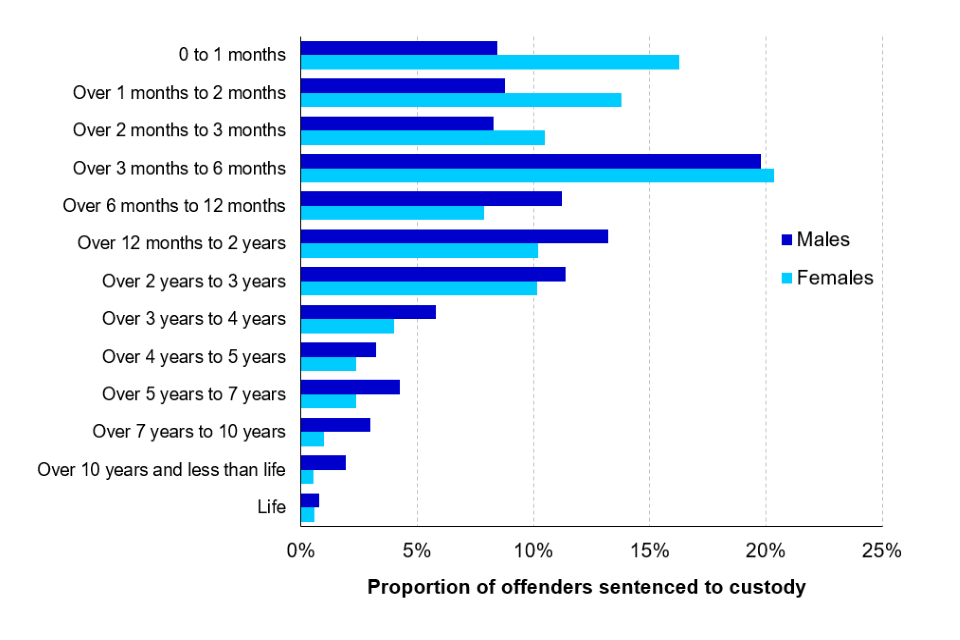
(Source: Ministry of Justice - Criminal Justice Statistics Quarterly: year ending December 2021 - Outcomes by Offence data tool)
The ACSL for male offenders in 2021 was 22.7 months compared to 14.5 months for female offenders. This is driven in part by a higher proportion of female offenders getting sentenced for offences that tend to receive shorter sentences.
The overall ACSL (where sex is known) has been increasing over the last 5 years, from 17.0 months in 2017 to 22.1 months in 2021. This likely represents the rise in the proportion of sentences over 12 months and the decrease in sentences under 3 months.
Figure 5.13: Average custodial sentence length, by sex, 2017 to 2021, England and Wales
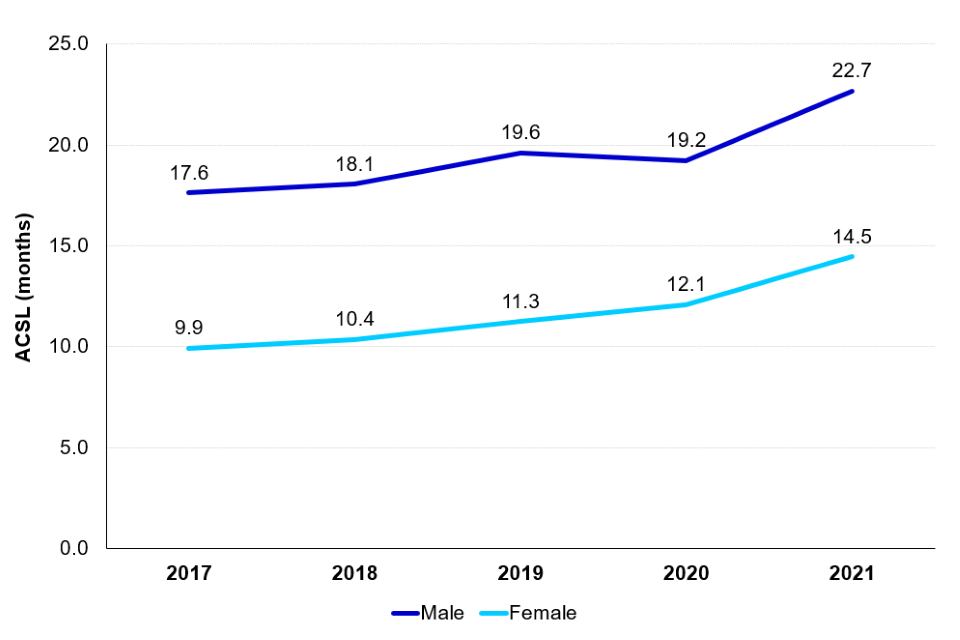
(Source: Ministry of Justice - Criminal Justice Statistics Quarterly: year ending December 2021 - Outcomes by Offence data tool)
6. Offender Management
The majority (96%) of the prison population were male.
As at 30 June 2022, 4% of the prison population were female, this proportion has remained stable for the last 5 years.
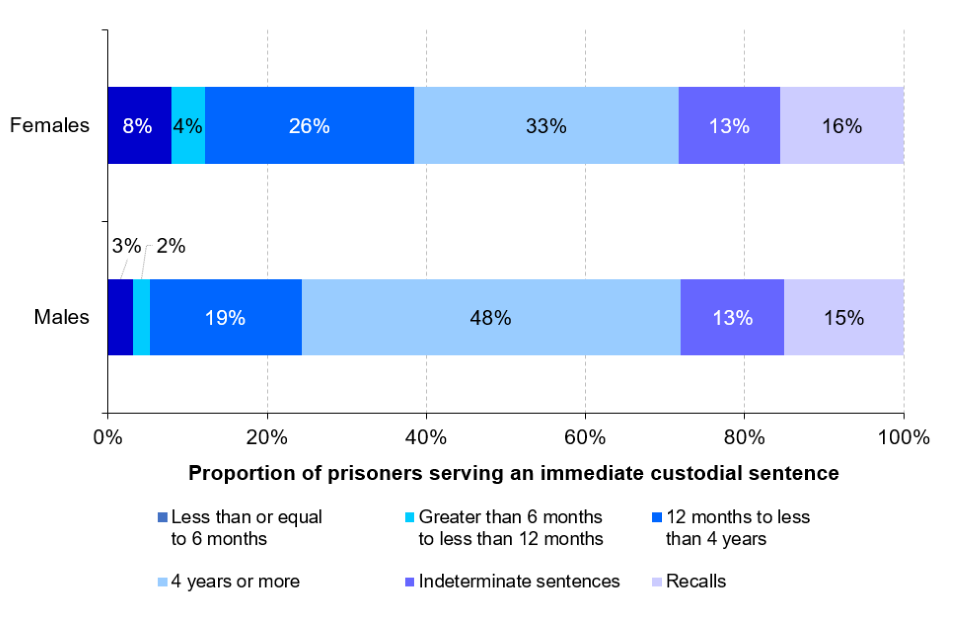
Females were serving shorter custodial sentence lengths.
As at 30 June 2022, 17% of females and 7% of males were serving sentences of less than 12 months.
In the 2021/22 HM Inspectorate of Prisons survey, females reported a high level and breadth of personal need.
Compared to males, a higher proportion of females reported: self-declared mental health problems, physical disability, having drug and alcohol problems, money worries and housing worries.
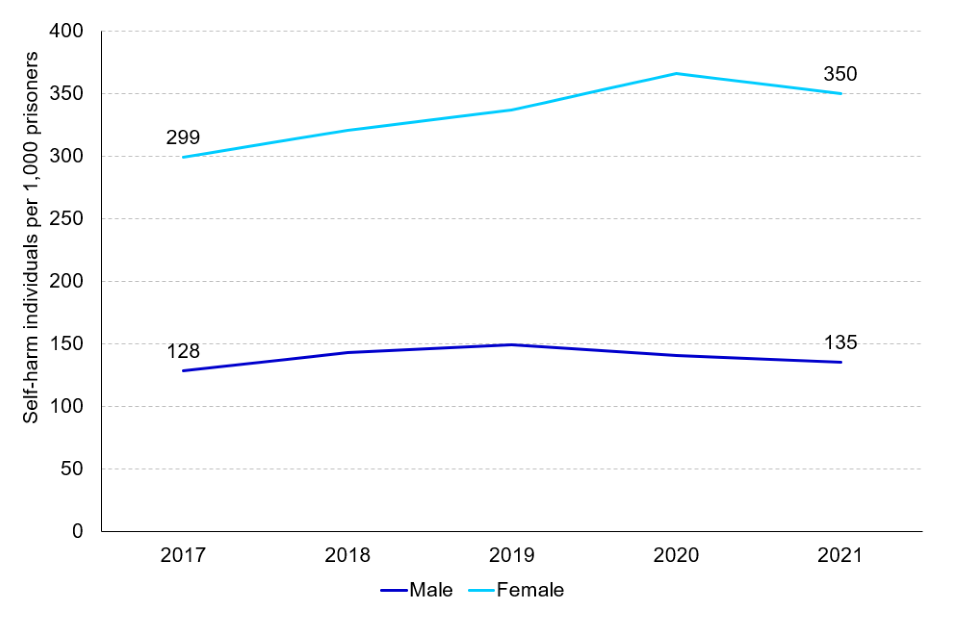
A higher proportion of female prisoners self-harmed in 2021.
In 2021, the number of individuals who self-harmed per 1,000 prisoners was 350 for females and 135 for males. The number of instances of self-harm per self-harming individual was over twice as high for females at 10.6.
This chapter (largely drawing from the ‘Offender Management statistics Quarterly’) provides statistics relating to offenders in custody or under supervision in the community, by sex. Topics include: Prison Population, Youth Custody, Unsentenced prison remand population, Sentences served in prison (type and length) Receptions and Releases, His Majesty’s Inspectorate for Prisons (HMIP) survey, Self-harm in custody, Probation (Community Orders and Suspended Sentence Orders). Please see the user guide accompanying this bulletin for additional related data sources.
6.1 Prison population[footnote 71]
The total prison population as at 30th June 2022[footnote 72] was 80,700. Females represented 4% of the prison population and this proportion has remained relatively stable over the last five years.
In June 2022 the prison population was 2% lower than compared to pre-pandemic levels in June 2019. Whilst the broad proportions of male and female prisoners have remained relatively stable, the number of female prisoners decreased by 14%, from 3,800 to 3,300, between June 2019 and June 2020. The number of sentenced prisoners remained lower in June 2022 than compared to pre-pandemic levels by 8% and 18% respectively for males and females.
Unsentenced remand prison population
As at the 30 June 2022, there were 13,400 prisoners held on remand (unsentenced), 611 of the prison population held on remand were female, representing 5% of the remanded prison population. This proportion has remained relatively stable over the last 5 years despite a 47% increase in the total number of defendants remanded from 9,100 to 13,400, between June 2019 and June 2022.
Youth secure estate[footnote 73]
In June 2022, the number of children and young people aged 18 years old and under in the secure estate[footnote 74] was 502, of which 3% were female. This proportion has remained stable over the last 5 years (June 2018 – June 2022) despite the overall decrease in the population of the secure estate for children and young people.
6.2 Prison receptions[footnote 75] and releases[footnote 76][footnote 77]
In 2021, there were 59,400 first receptions into prison, of which 92% were male and 8% were female. Over the last 5 years, the proportion of female first receptions has decreased from 10% in 2017. Of the 47,000 offenders released from prison sentences[footnote 78] in 2021, 93% were male and 7% female. Female offenders served fewer months on average than male offenders for determinate sentences, with a mean time served of 17.6 months and 26.6 months respectively. The proportion of female offenders released from prison is higher than the proportion of females in the total prison population, as at June 2022, likely driven by shorter sentences served by females.
6.3 Sentences served in prison [footnote 79]
Of the sentenced prison population, sentences can be divided into two broad groups: determinate sentences which are for a fixed period, and indeterminate sentences (these include life sentences and indeterminate sentences for public protection – IPPs).
As at 30 June 2022, 13% of both the sentenced male and female prison population were serving indeterminate sentences.
As at 30 June 2022, the sentence length profile of males and females under a determinate sentence differs, with a higher proportion of females (17%) serving sentences of less than 12 months, compared to 7% of males[footnote 80] (influenced by custodial sentencing in Chapter 5: Defendants and offence mix in Chapter 7: Offence Analysis).
Figure 6.01: Proportion of prisoners serving immediate custodial sentences by sentence length and sex, as at the 30th June 2022, England and Wales
(Source: Ministry of Justice – Offender Management Statistics – Table A1.6)
6.4 Prison experiences[footnote 81]
His Majesty’s Inspectorate of Prisons (HMIP) for England & Wales aims to ensure independent inspection of places of detention, report on conditions and treatment, and promote positive outcomes for those detained and the public. The HMIP Annual Report 2021/22 identifies differences in reported prison experiences between male and female prisoners[footnote 82][footnote 83]. This section covers some of the key statistics included in the report, further breakdowns are published in the HMIP report for female and male prisoners broken-down by religion, race, nationality, and other protected characteristics.
In 2021/22, 3,726 prisoners completed the survey of which 748 were female. Compared to males, a significantly higher proportion of females reported self-declared disability (long-term physical, mental, or learning needs), and having drug and alcohol problems, money worries and housing worries on arrival at the prison. A higher proportion of females also reported having a child under 18 and experiencing bullying or other victimisation from other inmates[footnote 84].
Prisoners from racial minority groups reported more negative relationships with staff than their white counterparts. A lower proportion of male and female prisoners from an ethnic group other than white reported having staff they could turn to for problems (61% and 76% respectively). These proportions were significantly lower compared to white male (75%) and female (86%) prisoners.
A higher proportion of females reported having a disability (48% compared to 35% of males) and mental health problems (76% compared to 51% of males). A higher proportion of females who reported mental health problems had children under the age of 18, reported a disability and had been in local authority care as a child compared to those who reported no mental health problems.
When asked “has your well-being got better or worse since you have been in this prison?” 30% of female prisoners who returned the survey stated their well-being had got better[footnote 85]. This was highest for female travellers at 44% and lowest for female Muslims at 13%.
6.5 Self-harm in prison[footnote 86]
Self-harm in prison custody is defined as ‘any act where a prisoner deliberately harms themselves irrespective of the method, intent or severity of any injury.’ In the last 5 years, females consistently had a higher proportion of prisoners who self-harmed and a higher number of instances of self-harm per 1,000 prisoners[footnote 87].
In 2021, the number of individuals who self-harmed per 1,000 prisoners was 350 for females and 135 for males[footnote 88]. The number of instances of self-harm per self-harming individual was over twice as high for females at 10.6, compared to 4.2 for males.
Figure 6.02: Number of self-harm individuals in prison per 1,000 prisoners by establishment, 2017 to 2021, England and Wales[footnote 89]
(Source: Ministry of Justice – Safety in Custody Statistics, Self-harm annual tables - Table 2.1)
6.6 Probation
The Probation Service supervises offenders living in the community under a court order (including those starting supervision as a result of a community order or suspended sentence order with requirements) and those being released from custody.
In 2021, 17% of offenders starting a community order were female[footnote 90] and 13% of offenders starting a suspended sentence order (with requirements) were female. These proportions have remained stable for the last 5 years.
Over the last 5 years, over half of male and female offenders starting community orders were for summary offences. In 2021, 58% of male and 56% of female offenders were starting a community order for a summary offence. For male offenders, staring a suspended sentence order in 2021, the most frequent offence groups were violence against the person (17%), summary non-motoring (15%) and miscellaneous crimes against society (14%). For female offenders, staring a suspended sentence order in 2021, the most frequent offence groups were violence against the person (21%), summary non-motoring (19%) and theft offences (14%).
As with custodial sentences, females on average received shorter community orders (12.6 months) and suspended sentence orders [footnote 91](17.3 months) compared to males (at 13.6 and 18.4 months respectively).
Over the last 5 years, a higher proportion of female offenders ran their full course for community orders and suspended sentence orders received when compared to male offenders. In 2021, 65% of males and 72% of females had their community order run its full course and 78% of males and 84% of females had their suspended sentence order run its full course. In 2021, conviction of an offence was the most common reason a suspended sentence order was terminated early for both males and females. Similarly, conviction of an offence was the most common reason a community order was terminated early for males and female offenders, alongside failed to comply with requirements for the latter.
6.7 Parole board[footnote 92]
The parole board carry out risk assessments on prisoners to determine whether they can be safely released into the community. Recommendations can also be made on a prisoner’s suitability for a move to the open prison estate.
In the year ending March 2022, there were 6,200 oral parole board hearings where sex was recorded. Of these, 3% were female and 97% were male. These proportions have remained stable across the past 5 years.
In the year ending March 2022, a higher proportion of female offenders received a release result from an oral hearing (71%), in contrast with male offenders (54%), a trend that has been consistent over the past 5 years. The proportion of females receiving a hearing result of release from an oral hearing has increased from 58% in year ending March 2018 to 71% in year ending March 2022. In contrast, the proportion of male offenders receiving a result of release has increased from 50% to 54%.
The number of parole board hearings concluded peaked for male and female offenders in the year ending March 2021 at 6,100 and 207 offenders respectively. The number of parole board hearings with an outcome of release peaked for female offenders in the year ending March 2022 at 141 offenders. In comparison, the number of parole board hearings with an outcome of release peaked for male offenders in the year ending March 2021 at 3,200 offenders.
Figure 6.03: Outcomes of oral Parole Board hearings by sex, year ending March 2022, England and Wales
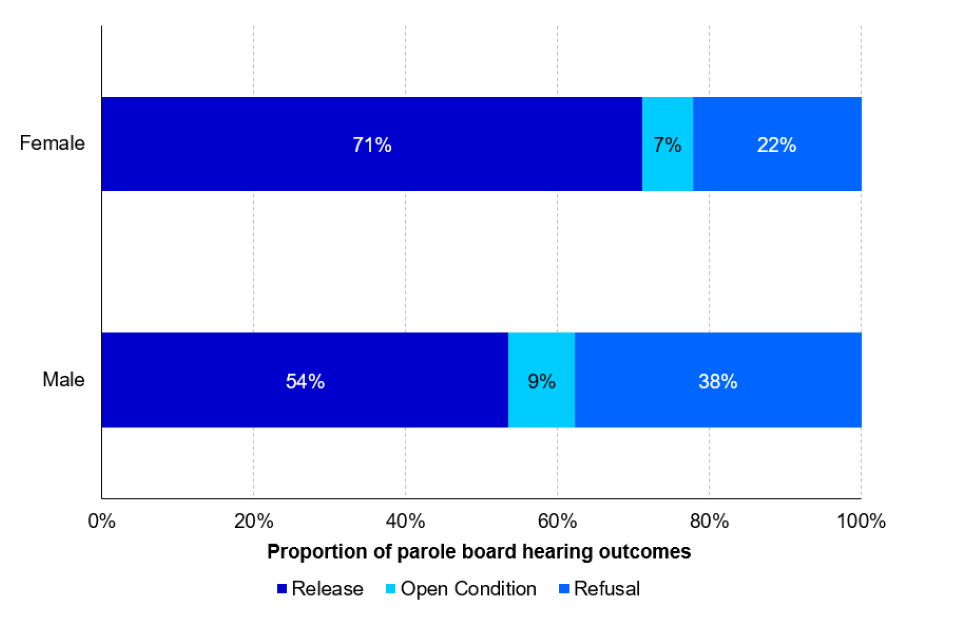
(Source: Ministry of Justice – Women and the Criminal Justice System – Table 6.01 [derived from Parole Board])
7. Offender characteristics
Ethnic minority groups accounted for a higher proportion of prosecutions against males compared to females.
In 2021 Black males were particularly over-represented, accounting for 12% of all male prosecutions. This compared to Black females accounting for 7% of all female prosecutions.
A higher proportion of female offenders were first time offenders, than males.
Of all female offenders cautioned/convicted in 2021, 35% were first time offenders (22% for males).
Females had a higher average number of reoffences per reoffender compared to males.
Females had a higher average number of reoffences per reoffender compared to males, at 3.97 and 3.69, respectively.
Across all three measures, the educational attainment of young people who had been cautioned or sentenced for an offence was slightly higher for females than males.
For example, 15% of females achieved 5 or more GCSEs (or equivalents) graded A* to C, including English and Maths, compared to 13% of males. This is considerably lower than the all-pupil population (56%).
More than half of young people who had been cautioned or sentenced for an offence were eligible for FSM.
This was slightly higher for females (57%) than for males (53%). This contrasts with the proportion of pupils in the all-pupil population where 26% were eligible for FSM.
This chapter looks at the interaction between sex and other key characteristics through the criminal court system including ethnicity and age using data from Criminal Justice System statistics: year ending December 2021. To note, we refer to only the most serious (indictable) offences[footnote 93] throughout the court statistics portion of this chapter, due to ethnicity being largely unknown for less serious (summary) offences. This chapter also includes analysis on offending histories, proven reoffending and educational attainment and overall educational background of offenders through a data sharing exercise between Ministry of Justice (MoJ) and Department for Education (DfE).
7.1 Sex & Ethnicity[footnote 94]
Prosecutions
Ethnic minority groups accounted for a higher proportion of prosecutions against males compared to females. In 2021, black males were particularly over-represented, accounting for 12% of all male prosecutions. This compared to black females, accounting for 7% of all female prosecutions. White female defendants accounted for 86% of all female prosecutions, and this has been broadly stable since 2017.
Remands[footnote 95] Of all females remanded in custody at the Crown Court for indictable offences in 2021, 81% were white, 9% were black, 4% were Asian, 5% were mixed and 2% were Other. In comparison, of males remanded in custody at the Crown Court for indictable offences, 70% of these were White, 14% were Black, 8% were Asian, 4% were Mixed and 2% were Other.
Figure 7.01: Proportion of prosecutions for indictable offences, by sex and ethnicity, 2021, England and Wales
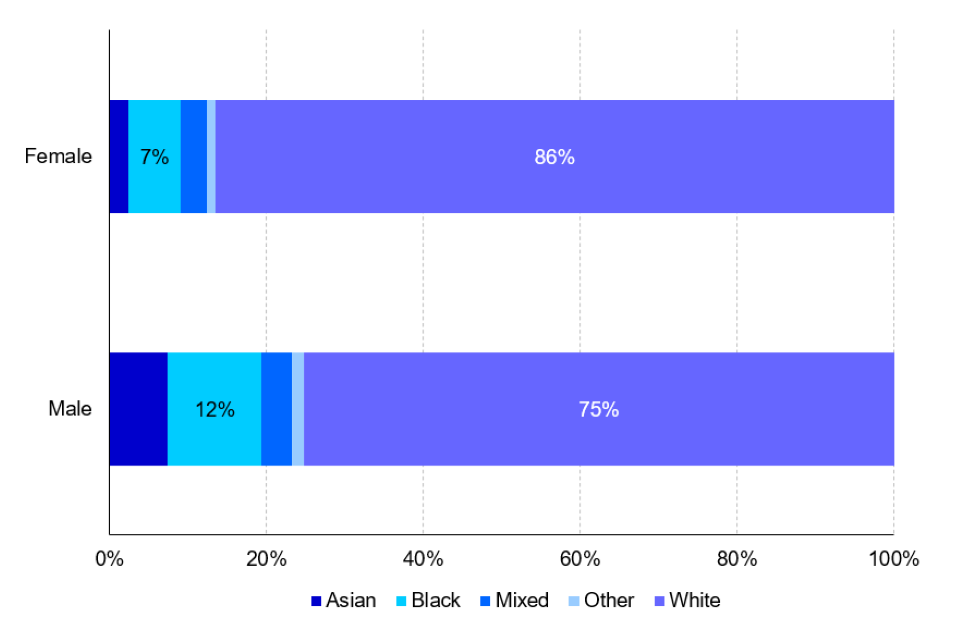
(Source: Ministry of Justice - Criminal Justice Statistics Quarterly: year ending December 2021 - Outcomes by Offence data tool)
Sentencing
Of all females sentenced in 2021 for indictable offences, offenders from the Other ethnic group had the highest custody rate[footnote 96] at 22%. The lowest custody rate for female offenders was 17% for those from the white and black ethnic groups. Similarly, male offenders from the Other group had the highest custody rate at 38%, whilst the white, black, and Asian groups had the lowest at 35%.
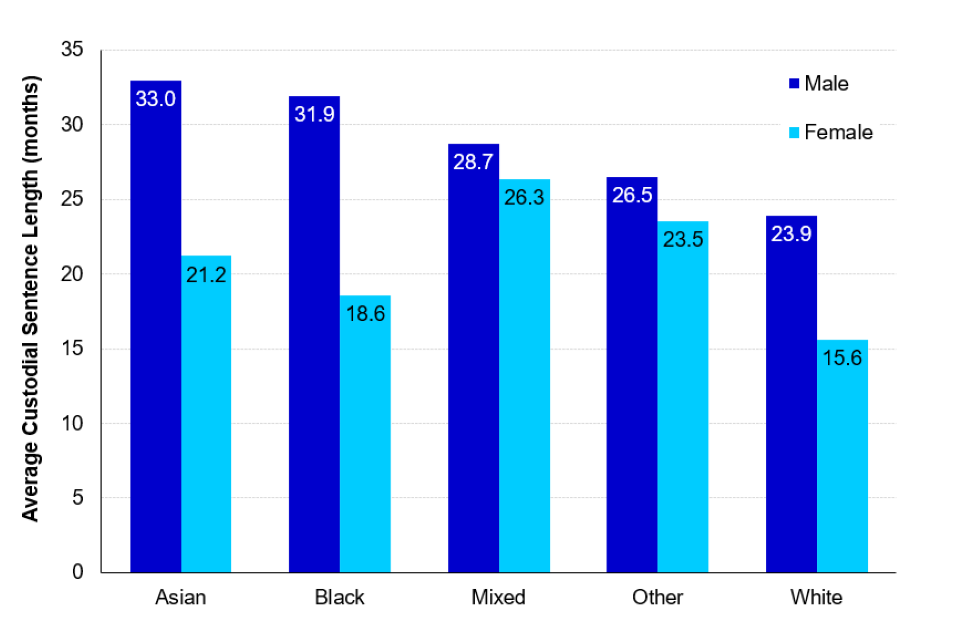
Average Custodial Sentence Length (ACSL)
Of all females sentenced in 2021 for indictable offences, offenders from the Other ethnic group had the highest custody rate[footnote 96] at 22%. The lowest custody rate for female offenders was 17% for those from the white and black ethnic groups. Similarly, male offenders from the Other group had the highest custody rate at 38%, whilst the white, black, and Asian groups had the lowest at 35%.
Figure 7.02: Average Custodial Sentence Lengths (ACSL) for indictable offences by sex and ethnic group, England and Wales, 2021
(Source: Ministry of Justice - Criminal Justice Statistics Quarterly: year ending December 2021 - Outcomes by Offence data tool)
Since 2017, the ACSL for indictable offences has risen for both male and female offenders from all ethnic groups[footnote 97]. Consistently, white females and males had the shortest ACSL. In 2021, female offenders from the mixed ethnic group had the longest ACSL at 26.3 months, whilst Asian females had the longest ACSL for the 4 years prior. For males, those from the Asian ethnic group had the longest ACSL in 4 out of 5 years since 2017, at 33.0 months in 2021. This was closely followed by the black ethnic group, whose ACSL rose 0.6 months above the Asian group in 2019. Differences in offence mix can cause apparent disparity between groups when comparing ACSL. For example, female offenders are more often dealt with for less serious offences than males; therefore, ACSL is consistently lower for female offenders. Equally, the impact of offence mix can be seen across ethnic groups, with each ethnic group potentially more likely to be dealt with for a different combination of offences, whose overall seriousness may impact that group’s ACSL.
Sex & Age[footnote 98][footnote 99]
Prosecutions by age distribution in 2021 remained broadly similar across males and females. The most common age bracket of both male and female defendants was 30 to 39, whilst the volume of male defendants in the category was over 3.5 times higher than females. This trend in age distribution was consistent across offenders both convicted and sentenced.
Figure 7.03: Age distribution of defendants dealt with for indictable offences, by sex, 2021, England and Wales
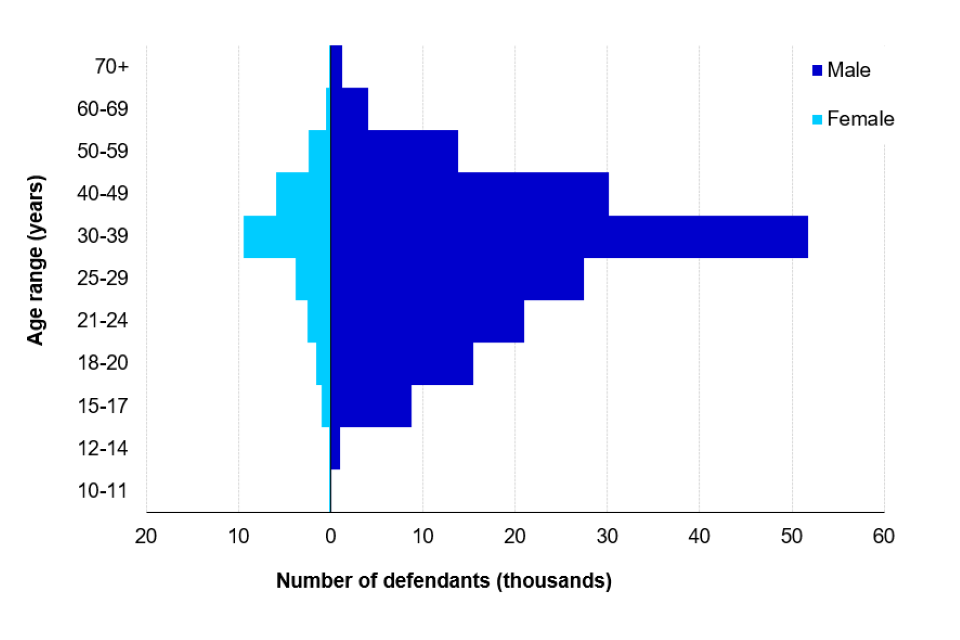
(Source: Ministry of Justice - Criminal Justice Statistics Quarterly: year ending December 2021 - Outcomes by Offence data tool)
7.2 Sex & Age – Children[footnote 100]
The following section discusses child offenders at different stages of the Criminal Justice System. Reference will usually be made to ‘children’ by which we refer to individuals aged 10 to 17 years of age[footnote 101][footnote 102]. It should be noted that because children comprise less than 10% of all offenders prosecuted for an indictable offence (where sex and age of the defendant is known), trends should be interpreted with caution.
Prosecutions
Female child defendants accounted for 10% of all children prosecuted for indictable offences in 2021, compared to 13% of corresponding adult females. The volume of children prosecuted for indictable offences has seen a 39% decline in the last 5 years.
Remands
In 2021, 47% of children remanded for indictable offences at Crown Court were remanded in custody. This contrasts with trends 5 years ago, where 49% of children were remanded on bail for these offences. The proportion of female children remanded on bail (58%) remains consistently higher than that of male children (34%), whilst male children more often receive custodial remand decisions (47% - males, 35% - females).
Sentencing
In 2021, 97% of all custodial sentences given to children for indictable offences were given to male children[footnote 103], with males receiving a custody rate of 8%, compared to 2% for females. Child custody rate has decreased for both male and female children over the last 5 years (3 and 2 percentage points, respectively) .
The ACSL for male children dealt with for indictable offences was higher than that of females, at 23.7 months in 2021 compared to 19.7 months for females. This follows a drop in ACSL in 2020, where reductions in court activity due to the COVID-19 pandemic presented an artificially low ACSL, out of line with the ongoing trend.
7.3 Sex & Age – Ethnicity
Ethnic minority groups were overrepresented at all stages; this is especially true for younger age groups. Of all female children prosecuted in 2021, 25% were from minority ethnic groups, whilst 40% of male children prosecuted in 2021 were from minority ethnic groups. This proportion decreases for young adults of both sexes (19% for females; 38% for males), and again for adult defendants (13% for females; 22% for males). This trend was similar across offenders both convicted and sentenced.
7.4 Offending Histories[footnote 104][footnote 105]
First Time Offenders
A first time offender is an offender who has been arrested by police in England or Wales; and who has received a first conviction, caution or youth caution for any offence[footnote 106] recorded on the Police National Computer. For example, an offender who had a conviction or caution outside England and Wales and was arrested by a police force in England and Wales would be counted as a first time offender. In this section any analysis is conducted where the sex of the offender is known.
First time offenders accounted for 24% of offenders who were cautioned or convicted in England and Wales in 2021, of which 79% were male and 21% females. Of all female offenders cautioned or convicted in 2021, 35% were first time offenders, compared to 22% for males. A higher proportion of females were first time offenders for all indictable offence groups, except for Robbery.
Offenders with 1 to 14 previous cautions or convictions accounted for 53% of all offenders in 2021, 86% were male, compared to 14% who were female. This cohort accounts for 51% of all female offenders cautioned/convicted, compared to 54% for males. In 2021, offenders with 15 or more previous cautions or convictions comprised 22% of all offenders, 90% of offenders were male, compared to the 10% who were female. This cohort accounts for 14% of all female offenders cautioned/convicted, compared to 24% for males.
7.5 Proven reoffending[footnote 107]
A proven reoffence is defined as any offence committed in a one-year follow-up period that leads to a court conviction, caution, reprimand, or warning within that year or within a further six-month waiting period to allow the offence to be proven in court.
In the 2019/20 cohort, the adult reoffending rate was higher for males at 26%, compared to 20% for females. The reoffending rate for males has decreased consistently over the last 10 years, whilst that of females saw a series peak in the 2017/18 cohort (23%). Among both adult female and male offenders, the reoffending rate was highest for those aged 35 to 39 at 25% and 30%, respectively. Reoffending rate was especially high among offenders with 11 or more previous offences, with females presenting a higher rate than males in each of the last 10 years (at 47% for females and 43% for males in 2019/20 cohort).
In the latest year, females had a higher average number of reoffences per reoffender (also known as the frequency rate) compared to males, at 3.97 and 3.69, respectively. Figures for both sexes saw a series peak in the 2017/18 cohort and have both decreased since. The highest frequency rate, in the most recent year, was observed amongst female offenders aged 25 to 29, at 4.35, whilst for male offenders, it was highest in the 35-39 age group, at 4.07 reoffences per reoffender.
Figure 7.04: Adult reoffending rate by age group and sex, April 2019 to March 2020 offender cohort, England and Wales
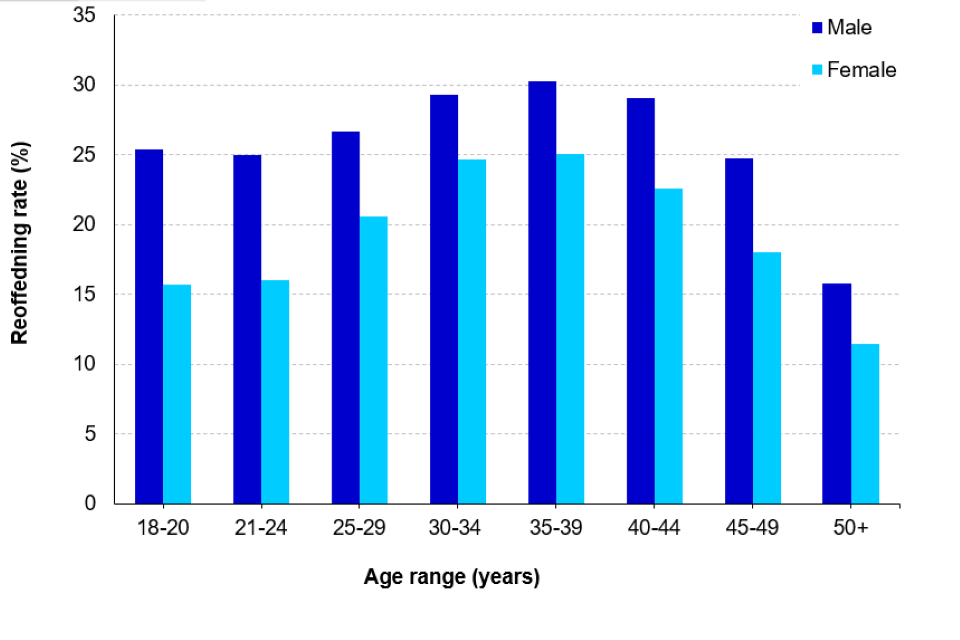
(Source: Ministry of Justice - Proven Reoffending Statistics: Jan to March 2020 - Table 7.02)
7.6 Educational background of young people who had been cautioned or sentenced for an offence
Findings from a recent data sharing exercise between the MoJ and the Department for Education (DfE) are presented here, with analysis on a matched cohort of those who were in year 6 in either 2008/09 or 2009/10 and who were aged ten at the start of those academic years[footnote 108]. To avoid inconsistency in the length of their offending histories, for those with a KS2 academic year of 2008/09 their offending data has been considered up to 31 December 2019 and for those with a KS2 academic year of 2009/10 it has been considered up to 31 December 2020.
This analysis compares the sexes in the matched cohort of young people cautioned or sentenced for an offence, broken down by disposal type, educational attainment, pupil characteristics, persistent absence and exclusion. Results are provided for the all-pupil cohort for comparison purposes[footnote 109][footnote 110].
Educational Attainment at Key Stage 4 (KS4)[footnote 111]
Across all three attainment measures, the educational attainment of young people who had been cautioned or sentenced for an offence was slightly higher for females than males. For example, 15% of females achieved 5 or more GCSEs (or equivalents) graded A* to C, including English and Maths, compared to 13% of males. This is considerably lower than the all-pupil population (56%)[footnote 112][footnote 113].
Figure 7.05: Proportion of young people cautioned or sentenced for an offence who matched to a Key Stage 4 attainment record in academic years 2013/14 and 2014/15, and all-pupil population, by sex, in England
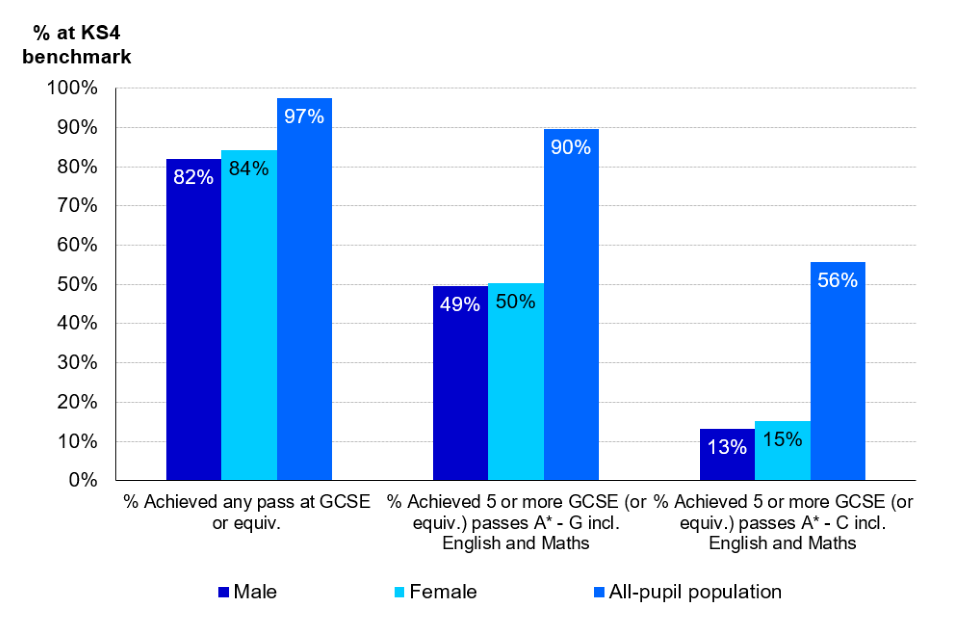
(Source: MOJ/DfE Data Share – Women in the Criminal Justice System: Chapter 7: Offender Characteristics– Table 7_04)
The proportion of young people who had been cautioned or sentenced for an offence who achieved 5 or more GCSEs (or equivalents) graded A* to C, including English and Maths, was highest among those in receipt of a fine. This was higher for females (30%) than males (20%), this difference being the greatest among the disposal types.
The wider attainment measure of 5 or more GCSEs (or equivalents) graded A* to G, including English and Maths was achieved by a greater proportion of pupils. Of all young people who had been cautioned or sentenced for an offence, 50% of females achieved this attainment level, compared to 49% of males. However, this was lower than the proportion of the all-pupil population achieving this attainment level (90%)[footnote 114][footnote 115].
7.7 Pupil Characteristics
In this section, all analysis looks at those in the matched cohort of young people who had been cautioned or sentenced for an offence, who were eligible for Free School Meals[footnote 116] (FSM) and/or recorded as having Special Educational Needs[footnote 117] (SEN), at any point during secondary school.
Free School Meals
More than half of young people who had been cautioned or sentenced for an offence were eligible for FSM. This was slightly higher for females (57%) than for males (53%). This contrasts with the proportion of pupils in the all-pupil population where 26% were eligible for FSM[footnote 118][footnote 119].
Figure 7.06: Proportion of young people who had been cautioned or sentenced for an offence matched to a Key Stage 4 academic year of 2013/14 or 2014/15, known to be eligible for free school meals, by sex and disposal type, in England
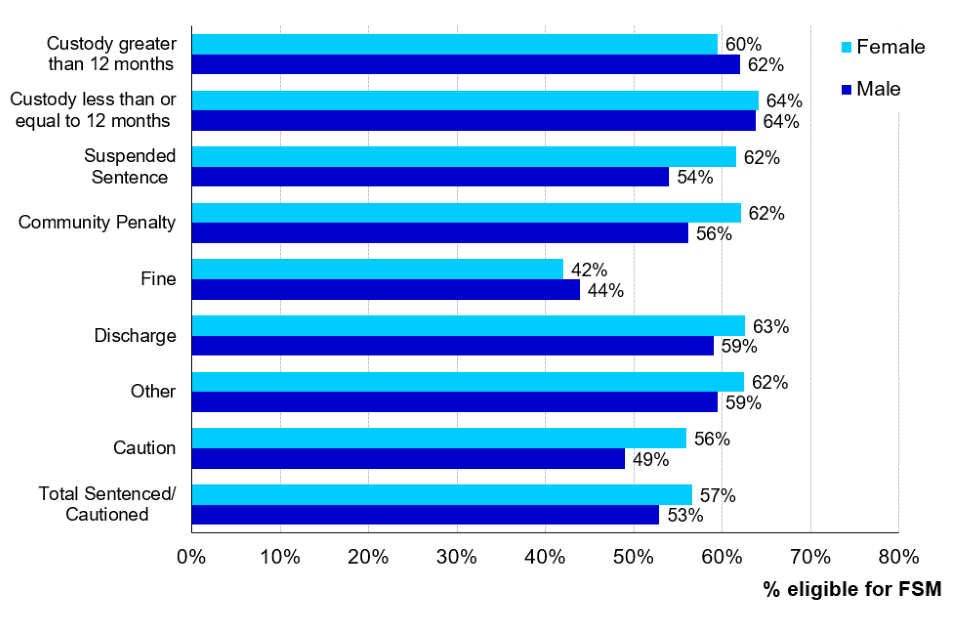
(Source: MOJ/DfE Data Share – Women in the Criminal Justice System – Chapter 7: Offender Characteristics – Table 7_05)
The FSM eligibility of young people who had been cautioned or sentenced for an offence was higher for females across all disposal types except for fines and immediate custody, when compared to males. Figure 7.06 shows the greatest difference in FSM eligibility was for those who had received a suspended sentence, where 8% more females were eligible for FSM than males.
Special Educational Needs (SEN)
Of the young people cautioned or sentenced for an offence, a greater proportion of males were recorded as having an Education, Health and Care (EHC) plan[footnote 120] (15%) compared to females (6%). This was much higher than the proportion of the all-pupil population who were recorded as having an EHC plan (4%)[footnote 121][footnote 122].
Overall, more than half of young people cautioned or sentenced for an offence had been recorded as having SEN support, 58% of both females and males. Across most disposal types there was a larger proportion of young females recorded as having SEN support compared to young males. The greatest difference, however, was among those in receipt of a fine, where 53% of young males were recorded as having SEN support, compared with 45% of young females.
Figure 7.07: Proportion of young people who had been cautioned or sentenced for an offence matched to a Key Stage 4 academic year of 2013/14 or 2014/15, known to be eligible for free school meals, by sex and disposal type, in England[footnote 123]
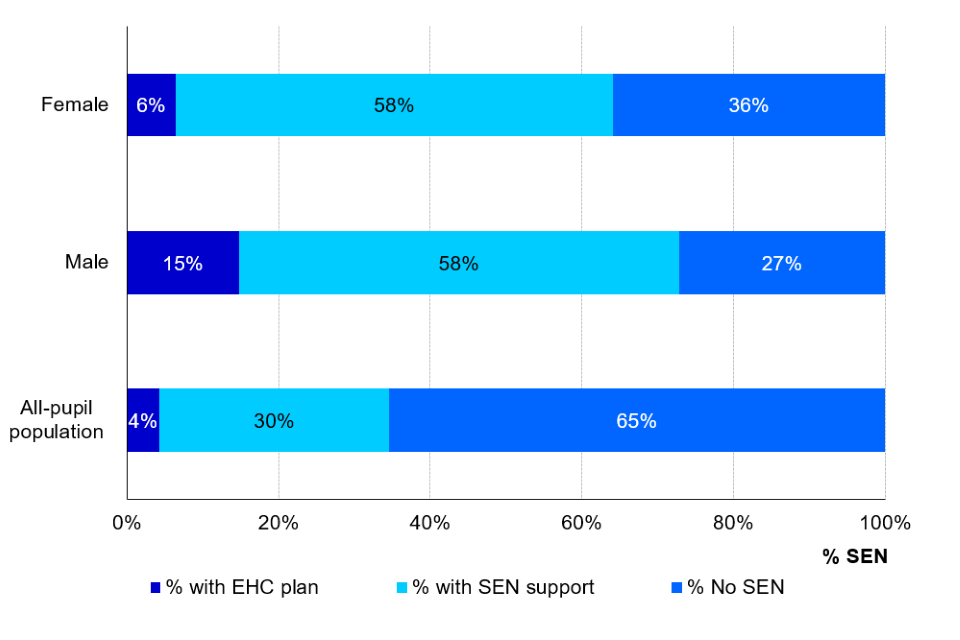
(Source: MOJ/DfE Data Share – Women in the Criminal Justice System – Chapter 7: Offender Characteristics – Table 7_06)
7.8 Persistent absence and exclusion
The matched cohort data also provided information on the proportion of those cautioned or sentenced for an offence that had a history of being persistently absent[footnote 124] from school at any point during secondary school, had a previous record of being permanently excluded[footnote 125] from school at any point during primary or secondary school, or had received a suspension[footnote 126] from school at any point during primary or secondary school .
Persistent absence
Of those young people cautioned or sentenced for an offence, a greater proportion of females had been persistently absent (80%) than males (73%). The proportion of young females persistently absent was higher across every disposal type compared to males except for those who received a fine (63% for both females and males). The greatest difference was for those dealt with by a community penalty (86% of young females compared with 76% of young males).
Exclusions
A larger proportion of young males cautioned or sentenced for an offence received either a suspension (73%), or a permanent exclusion (11%) compared with young females (63% suspension and 8% permanent exclusion). The largest difference for suspensions was between those who were dealt with by a fine. Among males in receipt of a fine, 62% had at some point received a suspension, compared with 44% of females, an 18-percentage point difference.
Figure 7.08: Proportion of young people who had been cautioned or sentenced for an offence matched to a Key Stage 4 academic year of 2013/14 or 2014/15, with a record of suspension, by sex and disposal type, in England
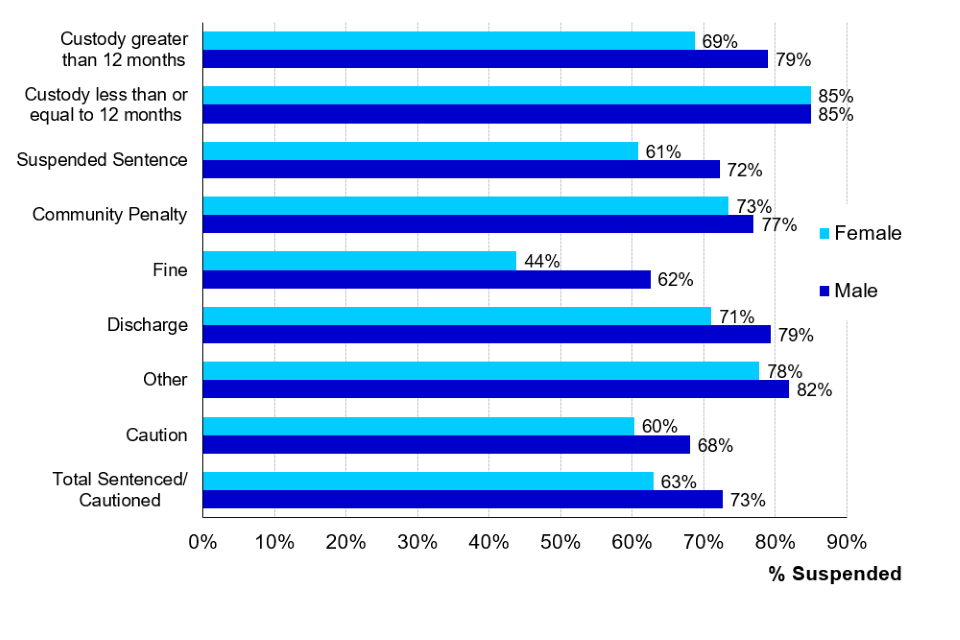
(Source: MOJ/DfE Data Share – Women in the Criminal Justice System – Chapter 7: Offender Characteristics – Table 7_08)
8. Offence analysis
TV licence evasion was the offence with the highest proportion of female defendants in 2021[footnote 127].
In 2021, 75% of those prosecuted for TV licence evasion were female. This offence accounted for 18% of all female prosecutions.
Theft from shops was the most common indictable offence for female defendants in 2021.
Theft from shops accounted for 21% of all female prosecutions for indictable offences, compared to 8% for males. Of the 19,900 defendants prosecuted for theft from shops, 5,600 (28%) were female.
This chapter looks at the most common offences for which females are dealt with by the Criminal Justice System, in comparison to males. It also looks into the proportions of females and males contributing to the total prosecutions for different offence groups. All data presented in this chapter is from the Criminal Justice System statistics: year ending December 2021 publication.
As noted in the introduction, comparisons across females and males do not account for previous offending history, detailed offence mix and other offender characteristics and that should be considered when interpreting results in this section. Therefore, experimental statistics have been used to control for offence mix, exclusively for the average custodial sentence length (ACSL) figures reported later in this chapter.
We have crudely attempted to control for different offence mixes across sexes by applying a similar pattern of offences being sentenced across both sexes, fixing this to the male group. Although it is impossible to make it perfectly consistent (even within an individual offence, there will be fluctuations in severity and aggravating factors etc.), this will reduce the differences in types of offending and enable a more suitable comparison across groups. This means that the ACSL figures reported in this chapter may not match those in published figures.
When controlling for offence mix across sexes, a 28% (4.5 months) increase in ACSL was observed for females sentenced to custody for indictable offences. This highlights that controlling for offence mix reduces the disparity between sexes by around a half.
Figure 8.01: Comparison of ACSL before and after controlling for offence mix, all indictable offences, 2021, England and Wales[footnote 128]
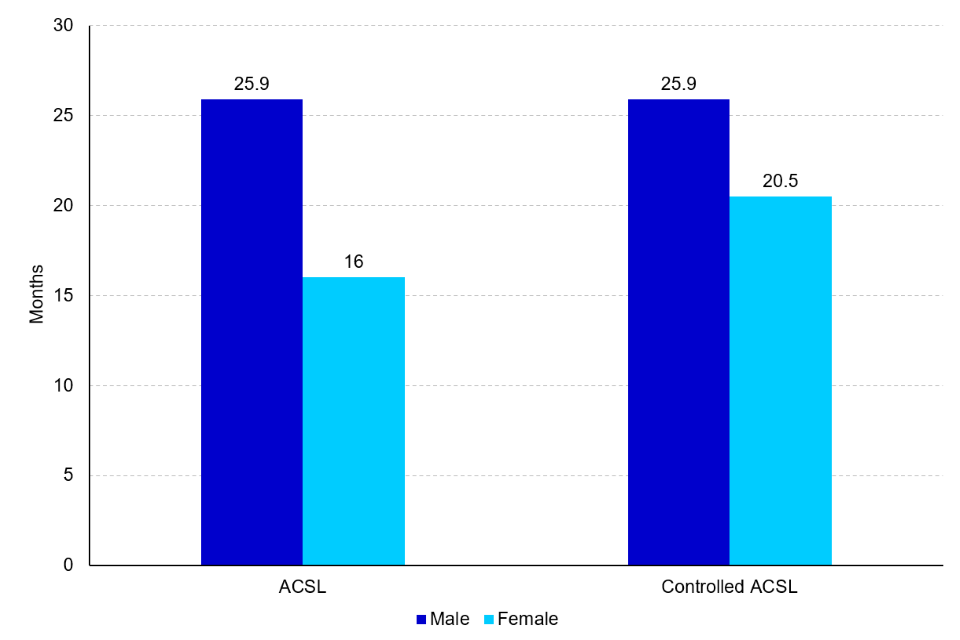
(Source: Ministry of Justice - Criminal Justice Statistics Quarterly: year ending December 2021 - Outcomes by Offence data tool)
8.1 Change in prosecutions by offence group since 2017
Prosecutions for summary offences[footnote 129] for females have decreased by 40% since 2017, from 293,000 to 175,000[footnote 130]. There was less of a reduction in male prosecutions for summary offences over the last five years, a decrease of 17% from 717,000 to 597,000.
Female prosecutions for summary non-motoring offences specifically showed a decrease of 57% since 2017 (185,00 to 79,500), compared to a 48% decrease for males (299,000 to 156,000). Female prosecutions for summary motoring offences decreased by 12% since 2017 (108,00 to 95,500), compared to a 5% increase for males (419,000 to 441,000).
Figure 8.02 Change in female prosecutions for summary offences, by offence group, 2017 to 2021, England and Wales
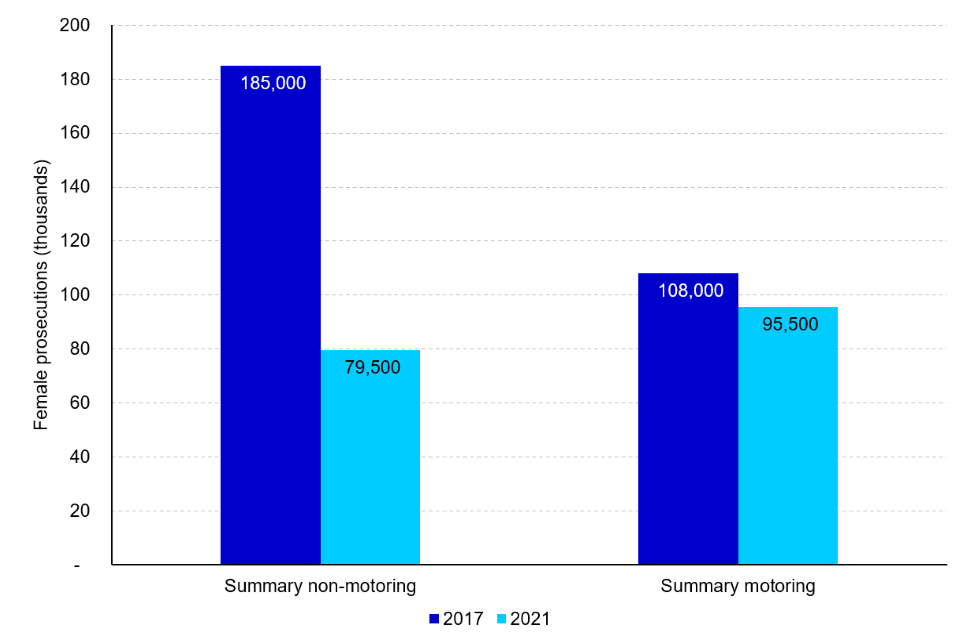
(Source: Ministry of Justice - Criminal Justice Statistics Quarterly: year ending December 2021 - Outcomes by Offence data tool)
Prosecutions for indictable offences for females have decreased by 30% since 2017, from 39,100 to 27,400. A similar trend was seen in male prosecutions over the last five years, where the number of males prosecuted for indictable offences decreased by 23% (228,000 to 175,000). Similar trends are seen for convictions.
Violence against the person was the only offence group to show a notable percentage increase (91%) in the number of prosecutions for females since 2017 (from 4,600 to 8,800). However, this was mainly driven by assault of an emergency worker offences, an offence introduced in 2018.
Figure 8.03: Change in prosecutions for indictable offences, by offence group, 2017 to 2021, England and Wales
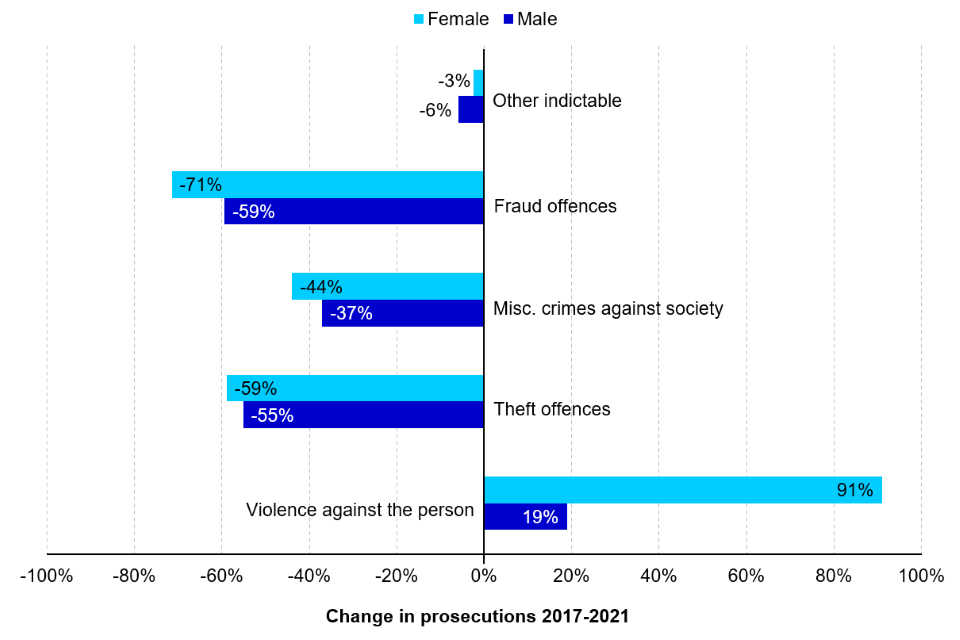
(Source: Ministry of Justice - Criminal Justice Statistics Quarterly: year ending December 2021 - Outcomes by Offence data tool)
8.2 Sex proportions across offence groups
As discussed in Chapter 5: Defendants, in 2021, 21% of individuals[footnote 131] prosecuted in England and Wales were female. This varies by offence type, females accounted for a higher proportion of prosecutions for summary offences (23% of 772,000) than indictable offences (14% of 203,000). Similar proportions are seen in convictions.
Figure 8.04: The proportion of male and female offenders prosecuted for each offence group, 2021, England and Wales
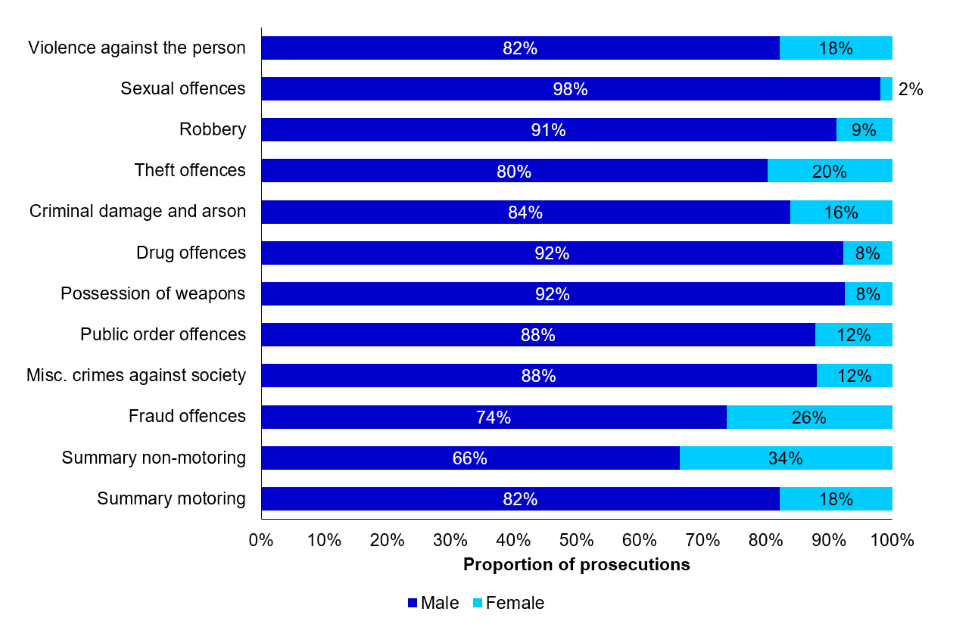
(Source: Ministry of Justice - Criminal Justice Statistics Quarterly: year ending December 2021 - Outcomes by Offence data tool)
The offence groups with the highest proportion of females prosecuted were summary non-motoring (34% of 236,000), fraud offences (26% of 4,000), theft offences (20% of 38,700), violence against the person (18% of 48,900) and summary motoring (18% of 536,000).
8.3 Offence Groups
The offence groups identified above will form the focus of the remainder of this chapter.
Summary non-motoring offences
Summary non-motoring offences accounted for 39% of all 202,000 prosecutions for females in 2021, compared to 20% of all 772,000 prosecutions for males. The main driver of this for females was television licence evasion, which accounted for 46% of all female prosecutions for summary non-motoring offences, compared to 8% for males.
75% of the 48,900 prosecutions for television licence evasion were for females. Of all offences with 50 or more prosecutions, television licence evasion had the highest proportion of females. A contributing factor is the greater availability of females when an enforcement officer visits the home[footnote 132].
The other summary non-motoring offence with a large number of prosecutions and a higher proportion of females than males was truancy, with females accounting for 67% of the 5,000 total prosecutions for this offence.
Fines were the most common outcome, accounting for 88% of sentences for females for summary non-motoring offences and 69% for males.
Summary motoring
Summary motoring was the most common offence group, accounting for 47% of all prosecutions for female defendants in 2021. This was also the most common offence group for males, accounting for 57% of all male prosecutions.
Speed limit offences specifically were the most common within the offence group, accounting for 45% of all female prosecutions for summary motoring offences and 37% for males.
Fines were by far the most common outcome, accounting for 96% of sentencing outcomes for females for summary motoring offences and 94% for males.
Fraud offences
Despite fraud being the offence group with the second highest female proportion of prosecutions (26%), benefit fraud was the only specific offence within the group to have a higher proportion of prosecutions for females compared to males (58% of 231).
Fraud by false representation: cheque, plastic card and online bank accounts, was the highest contributing offence within the group, accounting for 60% of female prosecutions for fraud offences, compared to 72% for males.
Females received a suspended sentence most commonly, accounting for 37% of sentences given to females for fraud offences, compared to 30% for males. Males, on the other hand, received total immediate custody most frequently, accounting for 32% of sentences for males for fraud offences, compared to 21% for females.
After applying weightings for offence mix, as mentioned at the beginning of the chapter, the ACSL for females sentenced to custody for fraud offences in 2021 was 21.3 months, compared to 27.1 months for males.
Theft offences
Theft offences accounted for 28% of female prosecutions for indictable offences in 2021. Theft from shops accounted for 21% of this alone, the most common indictable offence for female defendants in 2021. This compares to 8% of all male prosecutions for indictable offences being for theft from shops. This offence accounted for 73% of all female prosecutions for theft offences, compared to 46% for males.
Community sentences were the most common outcome for females, accounting for 27% of sentences given for theft offences, compared to 22% for males. Males received total immediate custody most frequently, accounting for 34% of sentences for theft offences, compared to 18% for females.
After applying weightings for offence mix, as mentioned at the beginning of the chapter, the ACSL for females sentenced to custody for theft offences in 2021 was 10.7 months, compared to 13.9 months for males.
Violence against the person
Violence against the person was the most common indictable offence group, accounting for 32% of female prosecutions for indictable offences in 2021, compared to 23% for males. This is largely driven by the assault of an emergency worker offence, introduced in 2018. This offence accounted for 56% of the 8,800 female prosecutions for violence against the person offences, compared to 29% of 40,200 for males.
Assault of an emergency worker was the second most common indictable offence for females after theft from shops, accounting for 18% of female prosecutions for indictable offences, compared to 7% for males.
Cruelty to or Neglect of Children was the other violence against the person offence of note, with a relatively high number of prosecutions (227) and greater proportion of females (55%) than males.
Community sentences were the most common outcome for females, accounting for 38% of sentences given for violence against the person offences, compared to 24% for males. Males received total immediate custody most frequently for violence against the person offences, accounting for 40% of sentences, compared to 13% for females.
After applying weightings for offence mix, as mentioned at the beginning of the chapter, the ACSL for females sentenced to custody for violence against the person offences in 2021 was 20.9 months, compared to 22.9 for males.
9. Practitioners
Over the last 5 years, there have been increases in female representation across almost all CJS organisations and in the proportion of senior staff
The largest increase in female representation was seen in HMPPS staff, from 47% in 2018 to 54% in 2022.
This chapter reports on the trends in the composition of staff and practitioners throughout the Criminal Justice System (CJS) by sex. It draws upon published extracts of human resources records for the police (2021/22), Ministry of Justice (MoJ; 2021/22), Crown Prosecution Service (CPS; 2021), His Majesty’s Prison and Probation Service (HMPPS; 2021/22), magistracy and judiciary. To allow for variable changes in headcount throughout the period considered, the sexes are best considered in terms of proportions of staff rather than absolute numbers.
9.1 Trends in CJS organisations
Ministry of Justice[footnote 133]: Female representation has remained broadly similar between 2018 and 2022, with a slight decrease from 67% in 2018 to 66% in 2022.
Crown Prosecution Service (CPS): The percentage of female practitioners increased from 65% in 2017 to 67% in 2021. CPS was the organisation with the highest female representativity in the most recent data across the CJS organisations.
Police officers: The proportion of female practitioners increased from 30% in 2018 to 33% in 2022. This was the lowest proportion of female staff across the CJS organisations[footnote 134].
His Majesty’s Prison and Probation Service (HMPPS): There was an increase in female representation across HMPPS as whole, from 47% in 2018 to 54% in 2022, representing the largest increase in the proportion of female staff across the CJS organisations across the latest 5 years. This differs between functions, with the Prison Service (including Youth Custody Service) having a lower proportion of females (rising from 38% in 2018 to 41% in 2022) when compared to the HMPPS HQ (and Area Services), and the probation service, which females represented 63% and 76% of respectively in 2022.
Judiciary: Female representation among court judges increased from 29% in 2018 to 35% in 2022. Across the same time period, female representation among all tribunal judges increased from 46% to 52%. Across all judges (court and tribunals), female representation increased from 35% in 2018 to 41% in 2022[footnote 135].
Magistrates: Serving Magistrates’ presented a higher proportion of female practitioners, increasing from 55% female staff in 2018 compared to 57% in 2022[footnote 136].
Figure 9.01: Proportion of practitioners in organisations involved in the CJS of each sex, by organisation, most recent year available[footnote 137] and five years prior, England and Wales
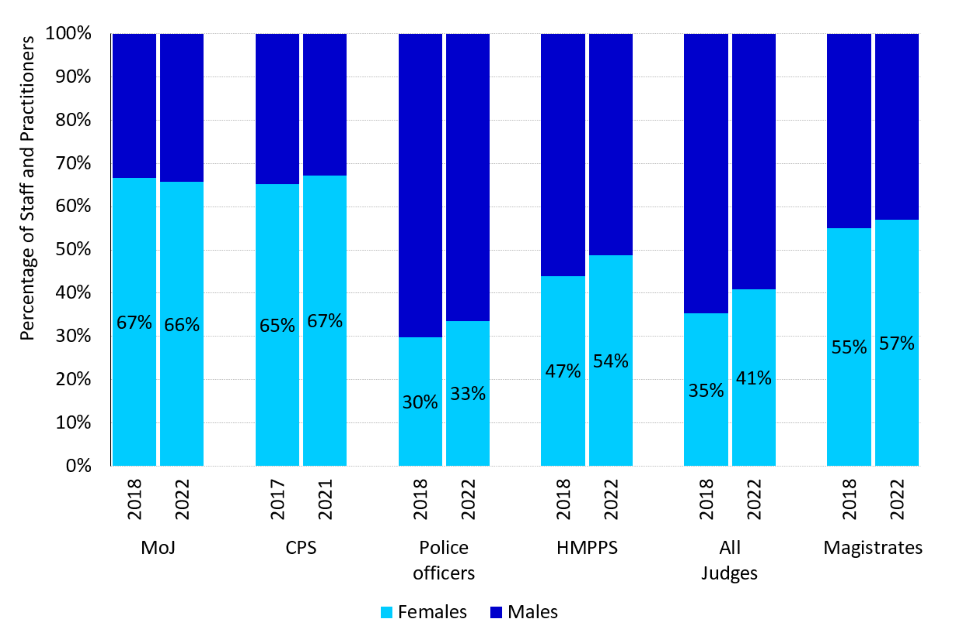
(Source: Ministry of Justice – Women and the Criminal Justice System: Chapter 9: Practitioners – 9.01b, 9.03b, 9.05b, 9.10 and Diversity of the judiciary [2018 and 2022])
9.2 Trends in senior staff and practitioners[footnote 138]
Caution should be taken when considering the sex breakdown of senior staff because the number of individuals represented is small and changing a single case could have a noticeable effect.
In the most recent year, CPS and MoJ had the highest proportions of senior staff who were female at 61% and 54%, respectively. These were the only organisations where the representation of females in senior positions was higher than that of males.
Senior court judges increased their female representation from 23% in 2018 to 30% in 2022, while female senior police officers increased from 25% to 29% over the same period. Contrarily, HMPPS[footnote 139] have seen a slight reduction in female representation of senior staff, from 37% in 2018 to 36% in 2022.
10. Dashboard
A web-based data visualisation tool has been created alongside the report this year, allowing users to view and customise charts based on the published statistics. This dashboard should be seen as a prototype and we hope to continue to develop it for future iterations if there is significant interest. The dashboard should be used as way to discover the data available from the Criminal Justice System and be used a launching point for further investigation.
The production team are looking to focus more on the dashboard and reduce commentary within the WCJS bulletin in the future in order to maximise the experience of our users and flexibility of analysis. Feedback on this proposal is welcomed. Please complete the survey here to contact the team.
11. Further information
11.1 National Statistics status
National Statistics status means that official statistics meet the highest standards of trustworthiness, quality, and public value. This bulletin recently underwent a compliance check with the Office for Statistics Regulation and retained its National Statistics status in October 2022[footnote 140]. All official statistics should comply with all aspects of the Code of Practice for Statistics. They are awarded National Statistics status following an assessment by the Authority’s regulatory arm. The Authority considers whether the statistics meet the highest standards of Code compliance, including the value they add to public decisions and debate. It is the Ministry of Justice’s responsibility to maintain compliance with the standards expected for National Statistics. If we become concerned about whether these statistics are still meeting the appropriate standards, we will discuss any concerns with the Authority promptly. National Statistics status can be removed at any point when the highest standards are not maintained and reinstated when standards are restored.
11.2 Contact
Press enquiries should be directed to the Ministry of Justice press office:
Tel: 020 3334 3536
Email: newsdesk@justice.gov.uk
Other enquiries about these statistics should be directed to the Data and Evidence as a Service division of the Ministry of Justice:
Damon Wingfield, Responsible Statistician and Head of Criminal Courts & Sentencing
Data and Statistics
Ministry of Justice, 3rd Floor, 10 South Colonnade, London, E14 4PU
Email: CJS_Statistics@justice.gov.uk
General enquiries about the statistical work of the Ministry of Justice can be e-mailed to: ESD@justice.gov.uk
Feedback
The structure and content of this report is continually being reviewed to reflect user requirements. If you have any feedback about the changes referred to in the introduction, or the report more generally, please contact the production team through the Data and Evidence as a Service division of the Ministry of Justice: Email: CJS_Statistics@justice.gov.uk
© Crown copyright
Produced by the Ministry of Justice
Alternative formats are available on request from ESD@justice.gov.uk
-
https://www.judiciary.uk/wp-content/uploads/2020/07/07072020_-Amended-Note-on-Listing-Magistrates-re-breaches_APPROVED-3.pdf ↩
-
Available at https://www.statisticsauthority.gov.uk/code-of-practice/ ↩
-
TCSEW estimates and are classed as Experimental Statistics. ↩
-
The face-to-face CSEW was suspended on 17 March 2020 because of the coronavirus (COVID-19) pandemic. A telephone-operated version of the CSEW (TCSEW) was specifically designed to allow the continuation of measuring crime during this period while face-to-face interviewing was not possible. ↩
-
Details can be found in the Technical Guide published alongside this report. ↩
-
Statistics used are from the TCSEW 2021/22 unless stated otherwise; when differences are not referred to as statistically significant these are either not statistically significantly different, or differences have not been tested. ↩
-
All figures relating to the TCSEW are from the accompanying chapter 3 tables. ↩
-
Personal crimes are those against an individual that relate to the respondent’s own personal experience rather than others in the household. Personal crime is defined by the TCSEW as comprising of all violence and thefts, and do not include fraud and computer misuse. ↩
-
Statistical significance is a term used for a result that is unlikely to have occurred by chance. ↩
-
Source: worksheet 4 in the most recently published Homicide in England and Wales, 2021. ↩
-
The year ending March 2021 covered certain time periods where coronavirus (COVID-19) restrictions were in place to limit social contact. These restrictions may have affected patterns of various crime types during this period, including homicide offences. ↩
-
This is not including the 96 victims of the Hillsborough disaster in 2016/17, where 89 were male and 7, female. ↩
-
Figures from worksheets 12, 13 and 14 from the Homicide in England and Wales. ↩
-
Figures calculated using Worksheet 12 and table 31 for domestics homicides in the Homicide in England and Wales data tables. ↩
-
Where there are multiple suspects in a homicide case, they are categorised in the Homicide Index as either the principal or a secondary suspect. There is only ever one principal suspect per homicide victim. If there is conviction information available, the suspect with the longest sentence/most serious conviction is determined as the principal suspect. In the absence of any court outcome, the principal suspect is either the person considered by the police to be the most involved in the homicide or the suspect with the closest relationship to the victim. ↩
-
Homicides are recorded to be “domestic” when the relationship between a victim aged 16 years and over and the perpetrator falls into one of the following categories: spouse, common-law spouse, cohabiting partner, boyfriend or girlfriend, ex-spouse, ex-cohabiting partner or ex-boyfriend or girlfriend, adulterous relationship, son or daughter (including step and adopted relationships), parent (including step and adopted relationships), brother or sister, other relatives. ↩
-
Stop and search data only begun to be collected by sex in the Police Powers and Procedures stop and search open data tables in April 2020 therefore this section will state only the latest year figures and trends. ↩
-
Excluding stop and searches carried out by the British Transport Police. See technical guide for further information. ↩
-
Stop and searches under s60 Criminal Justice and Public Order Act 1994 accounted for approximately 1% of all stop and searches (s1 and s60) in the latest year. For more information on stop and search legislation, please see the accompanying guidance document. ↩
-
Excluding age unknown. Age was unknown in 3% of all stop and searches in 2021/22. ↩
-
This applies to s1 of PACE and other legislation. When a suspect is stopped and searched under s60, the police can search the suspect for offensive weapons or dangerous instruments. For this reason, stops and searches under s60 have been added to the offensive weapons category of s1. ↩
-
Stops and searches that do not result in an arrest should not be immediately regarded as a misuse of power. Arrests that result from stop and search may not be linked to the initial reason for the stop and search. ↩
-
Excluding ‘unknown link’ and ‘unknown whether article found’ ↩
-
‘No further action’ includes a wide range of scenarios, such as where words of advice would be given, or an individual is detained under section 136 of the Mental Health act. ↩
-
Including cannabis/khat warnings, PNDs, cautions and summons. ↩
-
The data in this section refers to arrests for notifiable crimes recorded by the police (excluding the British Transport Police). ↩
-
Figures in this section relate to where sex was known. ‘Other’ and ‘unknown’ sex accounted for less than 1% of all arrest in 2021/22. ↩
-
Source: Police Powers and Procedures arrests open data tables and include all police force areas. ↩
-
Lancashire Constabulary were unable to supply complete data for 2017/18 and 2018/19. Therefore, to ensure comparability with previous years, this police force is excluded from age group comparisons over time for arrests analyses ↩
-
Excludes cases where age is unknown (<1% of cases in each year). ↩
-
See technical guide for more information on what this service covers. ↩
-
Out of court disposals available to the police and CPS in 2021 included: simple and conditional cautions; cannabis and khat warnings; penalty notices for disorder (PNDs); and community resolutions. Data broken down by sex is not available for cannabis and khat warnings or community resolutions, therefore these will not be included in the totals. ↩
-
See technical guide for more information on PNDs ↩
-
Figures on cautions exclude cases where sex is not known (1% of cases) ↩
-
Summary motoring offences are not considered in relation to cautions or cautioning rates as these tend to be addressed using Fixed Penalty Notices. There is no published data available on Fixed Penalty Notices by sex. ↩
-
Indictable offences include indictable-only and triable-either-way offences. Indictable offences are more serious offences that may (if triable-either-way) or must (if indictable only) be passed on to the Crown Court; while summary offences are typically less serious and almost always dealt with entirely in magistrates’ courts. See accompanying technical guide for further details. ↩
-
Caution types include adult conditional caution, adult simple caution, youth caution, youth conditional caution. Criminal Justice Statistics Quarterly have breakdowns by caution type from 2019 onwards. ↩
-
The cautioning rate is the number of offenders who were given a caution divided by the number who were either cautioned or convicted (excluding summary motoring offences). ↩
-
PNDs refers to Penalty Notices for Disorder. ↩
-
‘Other’ sentencing outcomes refers to: compensation, conditional discharge and otherwise dealt with. ↩
-
A single individual can be counted more than once in a year if they are dealt with by the CJS on more than one occasion. The number of individuals formally dealt with by the CJS includes defendants prosecuted at magistrates’ court and individuals given a caution or Penalty Notice for Disorder (PND). Cannabis warnings and community resolutions will not be considered when looking at out of court disposals because they are not recorded by sex. For more detailed analysis on out of court disposals, see Chapter 4: Police Activity. ↩
-
This section looks at persons only and excludes those where sex is not stated. Other defendants such as companies and public bodies are also excluded. ↩
-
Where sex was recorded ↩
-
See technical guide for more information. ↩
-
This section looks at persons only and excludes those where sex is not stated. Other defendants such as companies and public bodies are also excluded. Defendants with sex not stated accounted for 11% of all court proceedings in 2021, companies and public bodies accounted for 1%. ↩
-
Indictable offences include indictable-only and triable-either-way offences. Indictable offences are more serious offences that may (if triable-either-way) or must (if indictable only) be passed on to the Crown Court; while summary offences are typically less serious and almost always dealt with entirely in magistrates’ courts. See accompanying technical guide for further details. ↩
-
Source: data underpinning the Criminal Court Statistics: January to March 2022. These figures are calculated differently from those used for the Criminal Justice Statistics Quarterly: December 2021 bulletin, which is used as the basis for remands convictions and sentencing– they are not directly comparable to these sections. Please refer to the accompanying technical guide for further details. ↩
-
The data used for this section represent experimental statistics and tables on this data are provided in the accompanying overview tables. ↩
-
Includes all defendants in all cases completed in the magistrates’ courts ↩
-
A large proportion of DVLA prosecutions have unknown sex - as such any female / male splits in the table should be considered a sample of the full data and be expressed as proportions instead of numeric values. ↩
-
Where sex is known. 1% of crime lower legal aid clients had an unstated sex. ↩
-
Where sex is known. 4% of crime higher legal aid clients had an unstated sex. ↩
-
Source: data underpinning the Criminal Court Statistics: January to March 2022 bulletin. These figures are calculated differently from those used for the Criminal Justice Statistics Quarterly: December 2021 bulletin, which is used as the basis for remands convictions and sentencing– they are not directly comparable to these sections. Please refer to the accompanying technical guide for further details. ↩
-
Plea data is sourced from table 5_12, a further breakdown of data from Criminal Court Statistics: January to March 2022 bulletin and excludes companies, defendants with unknown sex and unknown plea. ↩
-
Guilty plea rate is the number of defendants pleading guilty to all counts as a proportion of those with a plea. ↩
-
Defendants are reported against their principal (i.e. most serious) remand status. Court custody includes those remanded in custody at any stage of proceedings at magistrates’ or Crown Court who may also have been given bail or not remanded at some stage of those proceedings. Court bail includes those remanded on bail at any stage of proceedings at magistrates’ or Crown Court who were never remanded in custody but who may also have been not remanded at some stage of those proceedings. ↩
-
The data in this section relates to persons remanded in each completed court case rather than to the number of remand decisions (a person may be remanded several times during a case). ↩
-
Excluding companies and those of unknown sex, which accounted for 12% of the total number of defendants in 2021. The total number of defendants in 2021 including those who fail to appear, companies and where sex is unknown was 1.16 million. ↩
-
Statistics on case management come from Criminal Court Statistics: January to March 2022. ↩
-
See technical guide for further information on effective, ineffective and cracked trials ↩
-
These are sourced from linked magistrates’ courts and Crown Court administrative data systems – with a match rate of around 90%. For more information and statistics on criminal court timeliness please refer to the Criminal Court Statistics: January to March 2022 bulletin. ↩
-
Including those sent to Crown Court ↩
-
PSRs provide information to the court about the offender and any circumstances surrounding the offence, to help decide on a suitable sentence. Data on PSRs relates to those aged 18 or older and all offence types. All court reports included in published PSR statistics relate to offenders of known sex. Statistics on PSRs are published alongside Offender Management Statistics. ↩
-
Fast Delivery PSR (oral) – The Criminal Justice Act 2003 removed the requirement for all PSRs to be written. An oral report is usually completed within 24 hours of conviction where a limited amount of information is required by the sentencing court. ↩
-
Standard PSR – A standard delivery (adjourned) PSR is based on a full risk assessment and is suitable for ‘medium’ and ‘high’ seriousness cases and/or where a custody is being considered. ↩
-
Guidance to National Probation Service staff on proposing suspended sentence orders (SSO) changed in 2018, which led to substantial drops in the numbers of SSOs proposed between 2018 and 2021 resulting in volumes too low for a robust comparison, therefore have been excluded from this comparison. ↩
-
See above footnote. ↩
-
This section excludes those where sex is not stated and other defendants such as companies and public bodies – in total these accounted for 12% of all defendants in 2021. ↩
-
See the technical guide for further information on RRI analysis. ↩
-
Please note that the spacing of the time period displayed does not align with the actual time scale, for example the time between sentenced to custody for 0-1 month is smaller than 6 to 12 months. ↩
-
Source: MoJ – Offender management statistics quarterly: January to March 2022 - Annual Prison Population: 2022 – Table A1.7 ↩
-
Includes the following types of custody: remand, sentenced and non-criminal prisoners. ↩
-
Source: HMPPS and Youth Custody Service - Youth custody report - July 2022 – Table 2.8. ↩
-
Monthly Youth Custody Official Statistics are published by the Youth Custody Service. Secure estates includes secure children’s homes (SCHs), secure training centres (STCs) and young offender institutions (YOIs). ↩
-
A first reception is a measure which counts a prisoner’s first movement into custody following a court hearing for a particular set of offences committed. ↩
-
A release is defined as a release from prison where the prisoner has finished serving the custodial term of their sentence and excludes unsentenced prisoners on remand. ↩
-
Source: MoJ - Offender management statistics quarterly - Prison receptions: 2021 - Table 2.1. Source: MoJ - Offender management statistics quarterly - Prison releases: 2021 - Table A3.2i. ↩
-
Sentences includes determinate and indeterminate sentences. ↩
-
Source: MoJ – Offender Management Statistics - Annual Prison Population: 2022 – Table A1.6 ↩
-
Where sentence length was known and excluding recalls. ↩
-
Source: HMIP - Annual Report 2021-22 - Analysis of prisoner survey responses – Excel workbook (896 kB) ↩
-
The detailed results of the survey can be found in HMIP Annual Report 2021/22. ↩
-
Where the differences between two proportions are reported as being significant there is less than 1% probability that the difference is due to chance – however any reason for this observed difference goes beyond the scope of this analysis. ↩
-
For more detail please see Chapter 5 Women in Prison from the HMIP Annual Report 2021/22. ↩
-
This question is unique to the female questionnaire from July 2021 and therefore reflects responses from three out of the five prison establishments inspected in the reporting year for 2021/22. ↩
-
Source: MoJ - Safety in custody: quarterly update to December 2021 - Table 2.1 ↩
-
Source: Safety in Custody Statistics. ↩
-
Individuals self-harming rates are derived by 1,000 x (number of individual in year)/(average monthly population for year). Prison population figures are from the Offender Management Statistics quarterly bulletin and are averaged across 12 months. ↩
-
In prisons, as in the community, it is not possible to count self-harm incidents with absolute accuracy. In prison custody, however, such incidents are more likely to be detected and counted. Care needs to be taken when comparing figures shown here with other sources where data may be less complete. ↩
-
Source: MoJ - Offender Management Statistics quarterly: Probation: 2021. ↩
-
Suspended sentence order with requirements. ↩
-
See technical guide for information relating to parole board. ↩
-
Indictable offences include indictable-only and triable-either-way offences. Indictable offences are more serious offences that may (if triable-either-way) or must (if indictable only) be passed on to the Crown Court ↩
-
Where ethnicity was known. Defendants with unknown or not stated ethnicity accounted for 30% of all indictable prosecutions in 2021. ↩
-
Remands data in this section are based on the Crown Court’s decision on whether a defendant prosecuted for a criminal offence, should – during the court proceeding – go on to be placed in custody or released on bail. ↩
-
The custody rate is the proportion of all offenders sentenced to immediate custody, out of all sentencing outcomes. ↩ ↩2
-
The overall increase in ACSL may be connected to changes in sentencing guidelines – see accompanying technical guide for details ↩
-
The analysis in this chapter excludes defendants where age or sex is unknown unless stated otherwise. ↩
-
This section looks at all offence types ↩
-
Defendants with unknown age and sex are excluded. ↩
-
In some cases, such as in the prison population, the age band for children is defined differently. ↩
-
In this section, children are the standard unit we are describing, even when not explicitly stating so in the text. The only exceptions are when we are deliberately discussing ‘all aged’ offenders. ↩
-
Children can be sentenced to custody in three different establishment types: Young Offender Institutions are for males aged 15-17 only, no females. Secure Children’s Homes and Secure Training Centres are for males (those who are younger or have more complex needs) and females aged 10-17. ↩
-
Data for offending history includes both indictable and summary offences - unless otherwise stated. ↩
-
Where sex is known. Offenders whose sex was unknown were excluded from all analyses in this section, which might lead to very small inconsistencies with other published statistics on offenders. Between 2017 and 2021, offenders of unknown sex comprised less than 1% of offenders. ↩
-
Where there were multiple offences on the same occasion, only the primary offence as recorded on the PNC would be counted. ↩
-
Proven reoffending statistics are reported based on cohorts of offenders who were released from custody, received a non-custodial conviction at court, or received a caution within a three-month period. Annual figures are then produced by aggregating the four 3-monthly cohorts within each given year. This may result in a single offender being included in the annual cohort more than once. Refer to Guide to proven reoffending for further details on methodology. The most recent annual reoffending data available is for the 2019/20 (i.e. April 2019 to March 2020) offender cohort. ↩
-
Equivalently, a Key Stage 4 academic year of 2013/14 and 2014/15; analysis of the attainment data focuses on those cautioned or sentenced for an offence who were at the end of KS4 in the 2013/14 and 2014/15 academic years. Analysis of characteristics such as SEN and FSM are also based on KS4 academic years 2013/14 and 2014/15. ↩
-
The all-pupil population includes both young people who have been cautioned or sentenced for an offence, and those who have not. These figures are a combination of the 2013/14 and 2014/15 statistics. ↩
-
Source: Education, children’s social care and offending: descriptive statistics ↩
-
Pupils at the end of Key Stage 4 are typically aged 15 and 16 ↩
-
Source: Education, children’s social care and offending: Table 1.11.2: Key stage 4 attainment by offending and pupil groups with KS4 academic year of 2013/14 ↩
-
Source: Education, children’s social care and offending: Table 1.11.3: Key stage 4 attainment by offending and pupil groups with KS4 academic year of 2014/15 ↩
-
A young person may be eligible to claim for FSM if they/their family meet certain criteria related to their income and benefits received ↩
-
From 2014 Education, Health and Care plans were introduced. Under previous legislation pupils could be eligible for Statements of SEN. The period for local authorities to transfer children and young people with Statements of SEN to EHC plans started in September 2014 and ended on 31 March 2018. For the purposes of this analysis, ‘EHC plan’ will be used to describe both Statements of SEN and EHC plans unless stated otherwise in the particular context. ↩
-
Source: Education, children’s social care and offending: Table 1.8.3: Free school meal (FSM) eligibility by offending and pupil groups, with key stage 4 academic year of 2013/14 ↩
-
Source: Education, children’s social care and offending: Table 1.8.4: Free school meal (FSM) eligibility by offending and pupil groups, with key stage 4 academic year of 2014/15 ↩
-
An EHC plan is a document which sets out a child’s SEN and any additional help that the child should receive. Having an EHC plan may indicate a higher level of need. ↩
-
Source: Education, children’s social care and offending: Table 1.5.3: Special educational needs (SEN) by offending and pupil groups, with key stage 4 academic year of 2013/14 ↩
-
Source: Education, children’s social care and offending: Table 1.5.4: Special educational needs (SEN) by offending and pupil groups, with key stage 4 academic year of 2014/15 ↩
-
Percentages may not sum to 100% due to rounding ↩
-
Persistent absence is when a pupil enrolment’s overall absence equates to 10 per cent or more of their possible sessions. ↩
-
A permanent exclusion refers to a pupil who is excluded and who will not come back to that school (unless the exclusion is overturned). ↩
-
Suspension refers to a pupil who is excluded from a school for a set period of time. Being suspended can involve a part of the school day and it does not have to be for a continuous period. A pupil may be excluded for one or more suspensions up to a maximum of 45 school days in a single academic year. This total includes exclusions from previous schools covered by the exclusion legislation. ↩
-
Only including offences with 50 or more prosecutions in 2021. ↩
-
Indictable offences include indictable-only and triable-either-way offences. Indictable offences are more serious offences that may (if triable-either-way) or must (if indictable only) be passed on to the Crown Court ↩
-
Figures reported relate to defendants for whom these offences were the principal offences for which they were dealt with. When a defendant has been found guilty of two or more offences it is the offence for which the heaviest penalty is imposed. Where the same disposal is imposed for two or more offences, the offence selected is the offence for which the statutory maximum penalty is the most severe. ↩
-
See the ‘Outcomes by Offence data tool’ in Criminal Justice Statistics Quarterly: December 2021 to obtain all statistics on prosecutions, convictions and sentencing quoted in this chapter. ↩
-
Individuals with known sex. Defendants with unknown or not stated sex accounted for 11% of all prosecutions in 2021. ↩
-
If enforcement officers suspect a household of watching or recording live TV without a valid licence and are not able to contact anyone at the property by letter or by telephone, they visit the household in person. ↩
-
Includes: MoJ HQ, HMCTS, OPG, LAA and CICA, and excludes HMPPS ↩
-
Figures relate to full-time equivalent police officers in post. Further information on additional workforce roles within the police can be found in the open data tables and associated bulletin can be found in the Police workforce, England and Wales: 31 March 2022 publication. ↩
-
Self-declared from HR records, as at 1 April 2022. Reported in table ‘3_4_JO_Trends’ in the Judicial Diversity Statistics 2022 publication. See the Judicial Diversity Statistics publication for further information about non-legal members. ↩
-
Self-declared from HR records, for serving magistrates, as at 1 April 2022. Reported in table ‘3_5_JO_Magistrates’ in the Judicial Diversity Statistics 2022 and 2018 publications. ↩
-
Latest data available depending on whether snapshot is based on calendar year (CPS data) or financial year (all other sources). ↩
-
Senior roles are as follows: CPS: Senior Legal Manager and Senior Civil Servant; MoJ: Senior Civil Servant; HMPPS: Senior Civil Servant; Police: Chief Inspector, Superintendent, Chief Superintendent, and Chief Officers; Judiciary: High Court Judges, Heads of Division and Lord Justices of Appeal. Excluding Probation Service staff. ↩
-
Excluding Probation Service staff. ↩
-
https://osr.statisticsauthority.gov.uk/correspondence/mark-pont-to-abigail-self-statistics-on-women-and-the-criminal-justice-system-for-england-and-wales/ ↩