Vision profile statistical commentary: September 2023
Published 5 September 2023
Applies to England

© Crown copyright 2023
This publication is licensed under the terms of the Open Government Licence v3.0 except where otherwise stated. To view this licence, visit nationalarchives.gov.uk/doc/open-government-licence/version/3 or write to the Information Policy Team, The National Archives, Kew, London TW9 4DU, or email: psi@nationalarchives.gov.uk.
Where we have identified any third party copyright information you will need to obtain permission from the copyright holders concerned.
This publication is available at https://www.gov.uk/government/statistics/vision-profile-september-2023/vision-profile-statistical-commentary-september-2023
The vision profile updates selected indicators developed for the 2021 Atlas of variation in risk factors and healthcare for vision in England. It gives local areas comparable indicators of risk factors, healthcare provision and outcomes for vision health to support commissioning and planning and to identify unwarranted geographical variation. This bulletin highlights new data for outpatients and procedures for eye care.
In an addition to a range of risk factors and sight loss outcome indicators, this profile presents 5 Hospital Episode Statistics (HES) indicators up to the financial year ending 2022:
- vision outpatient attendances
- vision outpatient attendances (persons based)
- admissions to hospital for cataract surgery in people aged 65 years and over
- admissions to hospital for rhegmatogenous retinal detachment surgery in people aged 18 years and over
- intravitreal injection therapy procedures in people aged 60 years and over
The HES indicators are an update to indicators previously published in the 2021 Atlas of variation in risk factors and healthcare for vision in England. The indicators are presented here using a new method for calculating confidence intervals. The revised method takes into account the fact that an individual may attend hospital several times during the year and has been adjusted to take into account the non-independence of these events. The new method has the effect of widening the confidence intervals. More local areas are now in the ‘similar’ to England category.
Main findings
This update shows:
-
in the financial year ending 2022, there were over 8.4 million vision outpatient attendances in England, a rate of 14,613 (14,590 to 14,635) per 100,000 population. This was still below attendances seen before the COVID-19 pandemic
-
in the financial year ending 2022, there were over 3.1 million people who attended hospital outpatient appointments for vision in England, a rate of 5,442 (5,436 to 5,448) per 100,000 population. This number of people was also still below the level recorded before the COVID-19 pandemic
-
in the financial year ending 2022, there were over 409,000 admissions to hospital for cataract surgery in England, a rate of 3,803 (3,789 to 3,816) per 100,000 population. This number had risen above that seen prior to the COVID-19 pandemic
-
there was a 12-fold difference in admissions to hospital for rhegmatogenous retinal detachment surgery in people aged 18 years and over between the sub-Integrated Care Boards (sub-ICBs) with the highest and lowest rate (43.6 (32.3 to 57.0) per 100,000 population NHS West Yorkshire ICB - 02T and 3.6 (1.4 to 7.0) per 100,000 population in NHS Leicester, Leicestershire and Rutland ICB - 04C)
-
there was a 142-fold difference in intravitreal injection therapy procedures rates between the sub-ICBs with the highest and lowest rate (81 (38 to 137) per 100,000 population in NHS Lancashire and South Cumbria ICB - 00R and 11,543 (10,748 to 12,352) per 100,000 population in NHS Humber and North Yorkshire ICB - 03F)
Summary
Vision outpatient attendances
This indicator has been updated with data for the financial year ending 2014 to the financial year ending 2022.
Figure 1 shows the sharp reduction in number of vision outpatient visits in the financial year ending in 2021, corresponding with the first year of the COVID-19 pandemic.
In the financial year ending 2022, there were over 8.4 million vision outpatient attendances in England, a rate of 14,613 (14,590 to 14,635) per 100,000 population. This was still below pre-pandemic levels.
Figure 1: vision outpatient attendance rates, directly standardised rate per 100,000 population, England, in the financial year ending 2014 to the financial year ending 2022

In the financial year ending in 2022, there was a 2.4-fold difference in vision outpatient attendance rates for the sub-ICBs with the highest and lowest rate (23,148 (22,615 to 23,684) per 100,000 population in NHS South Yorkshire ICB - 03L and 9,557 (9,364 to 9,751) per 100,000 population in NHS North East and North Cumbria ICB - 01H).
Figure 2: vision outpatient attendance rates, directly standardised rate per 100,000 population by sub-ICB, England, in the financial year ending 2022
Vision outpatient attendances (persons based)
For diseases that affect vision it is common that a person might attend the hospital several times during the year. This indicator measures the number of people who attended outpatient appointments rather than the number of appointments.
This indicator has been updated with data for the financial year ending 2014 to the financial year ending 2022
Figure 3 shows the sharp dip in number of people who attended hospital outpatient appointments during the first year of the COVID-19 pandemic.
In the financial year ending 2022, there were over 3.1 million people who attended hospital outpatient appointments for vision in England, a rate of 5,442 (5,436 to 5,448) per 100,000 population. This was below pre-pandemic levels.
Figure 3: vision outpatient attendances (persons based), directly standardised rate per 100,000 population, England, in the financial year ending 2014 to the financial year ending 2022

There was a 2.0-fold difference in outpatient attendances (persons based) rates for vision for the sub-ICBs with the highest and lowest rate (8,051 (7,946 to 8,156) per 100,000 population in NHS North East and North Cumbria ICB - 00P and 4,090 (4,007 to 4,174) per 100,000 population in NHS North East and North Cumbria ICB - 99C).
Figure 4: vision outpatient attendances (persons based) rates, directly standardised rate per 100,000 population by sub-ICB, England, in the financial year ending 2022
Admissions to hospital for cataract surgery in people aged 65 years and over
This indicator has been updated with data for the financial year ending 2014 to the financial year ending 2022.
Figure 5 shows the sharp drop in admissions to hospital for cataract surgery in people aged 65 years and over in the first year of the COVID-19 pandemic.
In the financial year ending 2022, there were over 409,000 admissions to hospital for cataract surgery in England, a rate of 3,803 (3,789 to 3,816) per 100,000 population. This was above pre-pandemic levels.
Figure 5: admissions to hospital for cataract surgery in people aged 65 years and over, directly standardised rate per 100,000 population, England, in the financial year ending 2014 to the financial year ending 2022

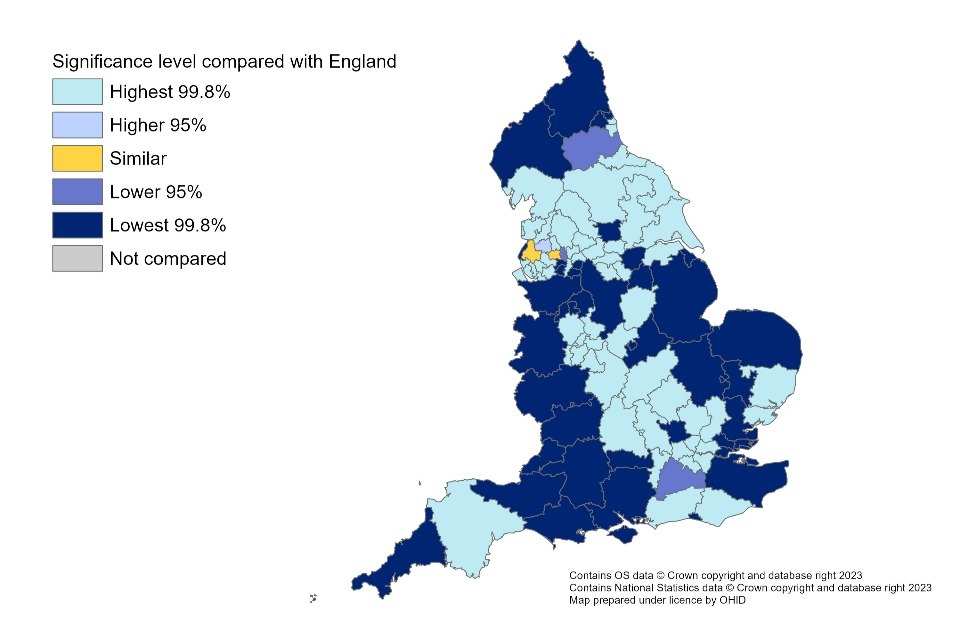
There was a 2.6-fold difference in admissions to hospital for cataract surgery in people aged 65 years and over for the sub-ICBs with the highest and lowest rate (5,207 (4,930 to 5,493) per 100,000 population in NHS Humber and North Yorkshire ICB - 03K and 1,969 (1,906 to 2,034) per 100,000 population in NHS Norfolk and Waveney ICB - 26A).
Figure 6: admissions to hospital for cataract surgery in people aged 65 years and over, directly standardised rate per 100,000 population by sub-ICB, England, in the financial year ending 2022
Admissions to hospital for rhegmatogenous retinal detachment surgery in people aged 18 years and over
This indicator has been updated with data for the financial year ending 2014 to the financial year ending 2022.
Figure 7 shows that despite retinal detachment being a sight threatening condition, admissions to hospital for surgery dropped during the first year of the COVID-19 pandemic.
In the financial year ending 2022, there were over 10,900 admissions to hospital for rhegmatogenous retinal detachment surgeries in England, a rate of 23.4 (22.9 to 24.0) per 100,000 population. This was similar to pre-pandemic levels.
Figure 7: Admissions to hospital for rhegmatogenous retinal detachment surgery in people aged 18 years and over, directly standardised rate per 100,000 population, England, in the financial year ending 2014 to the financial year ending 2022

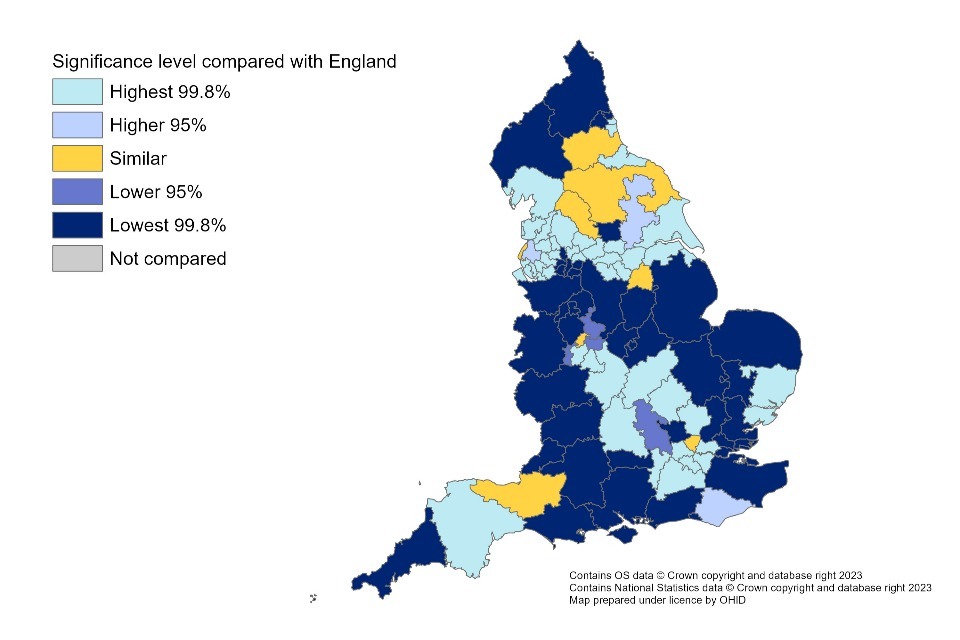
There was a 12-fold difference in admissions to hospital for rhegmatogenous retinal detachment surgery in people aged 18 years and over for the sub-ICBs with the highest and lowest rate (43.6 (32.3 to 57.0) per 100,000 population NHS West Yorkshire ICB - 02T and 3.6 (1.4 to 7.0) per 100,000 population in NHS Leicester, Leicestershire and Rutland ICB - 04C).
Figure 8: Admissions to hospital for rhegmatogenous retinal detachment surgery in people aged 18 years and over, directly standardised rate per 100,000 population by sub-ICB, England, in the financial year ending 2022

Intravitreal injection therapy procedures in people aged 60 years and over
This indicator has been updated with data for the financial year ending 2014 to the financial year ending 2022.
Figure 9 shows a reduction in intravitreal injections during the first year of the COVID-19 pandemic.
In the financial year ending 2022, there were over 677,000 intravitreal injection therapy procedures in England, a rate of 4,796 (4,769 to 4,823) per 100,000 population. This was above pre-pandemic levels.
Figure 9: intravitreal injection therapy procedures in people aged 60 years and over, per 100,000 population, England, in the financial year ending 2014 to the financial year ending 2022

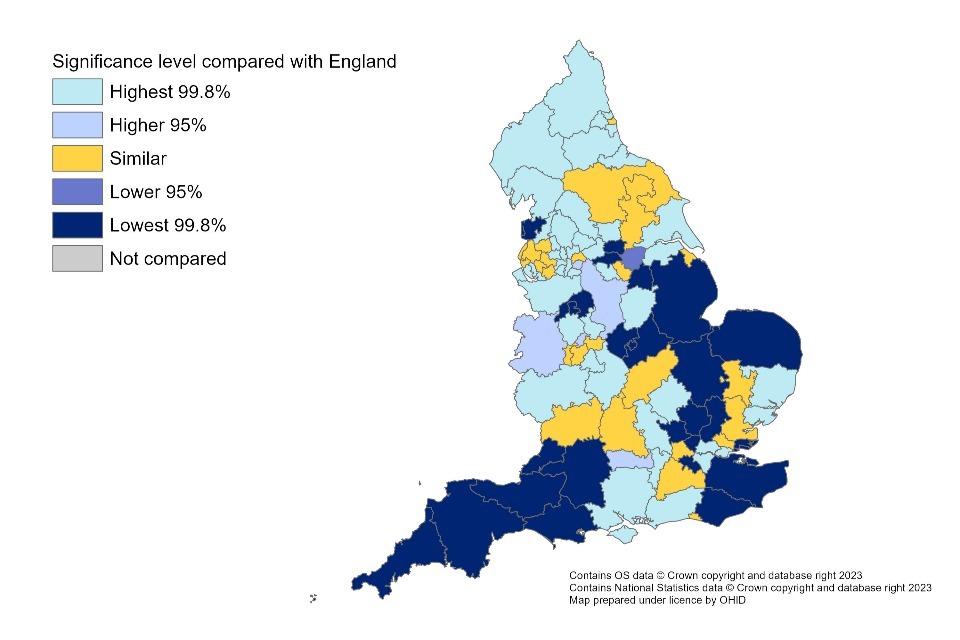
There was a 142-fold difference in intravitreal injection therapy procedures rates for the sub-ICBs with the highest and lowest rate (81 (38 to 137) per 100,000 population in NHS Lancashire and South Cumbria ICB - 00R and 11,543 (10,748 to 12,352) per 100,000 population in NHS Humber and North Yorkshire ICB - 03F).
Some of the 142-fold difference may be due to differences in coding by hospitals as there is no mandatory requirement for Hospital Episode Statistics outpatient episodes to be coded by diagnosis (ICD10) or by procedure (OPCS4).
Methodology
As part of the ongoing work in maintaining the profiles, indicators and methods are regularly reviewed. The Dobson and Byar’s method previously used to calculate the confidence intervals presumes each admission in the year is independent events. For diseases that affect vision however, it is common that a person might attend the hospital several times during the year.
To account for this non-independence of events, we are applying a Dobson and Byar’s method with an adjusted variance that takes into account the actual number of people and the number of multiple admissions.
The new methodology has been applied to 4 of the HES indicators. It has not been applied to the all vision outpatient attendances (persons based) indicator as this only counts unique people. Full technical details of the new methodology will be made available soon and can be requested.
Differences made by the new methodology
The new method has the effect of widening the confidence intervals. Table 1 presents the vision indicators in the financial year ending 2022 for England for both the previous and new method.
Table 1a: difference in 95% confidence intervals between the previous and new method directly standardised rate per 100,000 population, England, in the financial year ending 2022
| Indicator | Count | Denominator | Value per 100,000 | Previous Lower CI 95% | Previous Upper CI 95% | New Lower CI 95% | New Upper CI 95% | % Difference in the 2 Methods Lower CI 95% | % Difference in the 2 Methods Upper CI 95% |
|---|---|---|---|---|---|---|---|---|---|
| vision outpatient attendances | 8,403,135 | 60,744,002 | 14,612.91 | 14,603.00 | 14,622.82 | 14,590.44 | 14,635.38 | 0.09% | 0.09% |
| intravitreal injection therapy procedures in people aged 60 years and over | 677,409 | 14,084,961 | 4,795.81 | 4,784.38 | 4,807.27 | 4,768.81 | 4,822.86 | 0.33% | 0.32% |
| admissions to hospital for cataract surgery in people aged 65 years and over | 409,346 | 10,663,170 | 3,802.54 | 3,790.89 | 3,814.23 | 3,788.65 | 3,816.47 | 0.06% | 0.06% |
| admissions to hospital for rhegmatogenous retinal detachment surgery in people aged 18 years and over | 10,925 | 48,504,983 | 23.45 | 23.01 | 23.89 | 22.93 | 23.97 | 0.32% | 0.31% |
Table 1b: difference in 99.8% confidence intervals between the previous and new method directly standardised rate per 100,000 population, England, in the financial year ending 2022
| Indicator | Count | Denominator | Value per 100,000 | Previous Lower CI 99.8% | Previous Upper CI 99.8% | New Lower CI 99.8% | New Upper CI 99.8% | % Difference in the 2 Methods Lower CI 99.8% | % Difference in the 2 Methods Upper CI 99.8% |
|---|---|---|---|---|---|---|---|---|---|
| vision outpatient attendances | 8,403,135 | 60,744,002 | 14,612.91 | 14,597.29 | 14,628.54 | 14,577.49 | 14,648.35 | 0.14% | 0.14% |
| intravitreal injection therapy procedures in people aged 60 years and over | 677,409 | 14,084,961 | 4,795.81 | 4,777.80 | 4,813.88 | 4,753.27 | 4,838.47 | 0.51% | 0.51% |
| admissions to hospital for cataract surgery in people aged 65 years and over | 409,346 | 10,663,170 | 3,802.54 | 3,784.18 | 3,820.97 | 3,780.65 | 3,824.51 | 0.09% | 0.09% |
| admissions to hospital for rhegmatogenous retinal detachment surgery in people aged 18 years and over | 10,925 | 48,504,983 | 23.45 | 22.76 | 24.15 | 22.64 | 24.27 | 0.51% | 0.49% |
The confidence interval shows where we expect the true result to lie 99.8% and 95% of the time. By taking into account a person’s multiple admissions, the confidence interval is wider indicating less certainty around where the true value lies.
Table 2 shows the number of sub-ICB locations (sub-ICBs) in relation to their significance to the England value using both the previous and new confidence interval method. More areas are now in the ‘No significance’ to England category.
Table 2: number of sub-ICBs in each category of significance in relation to the England value using the previous and new method. Hospital admission rate for the 4 indicators that use the new methodology, directly standardised rate per 100,000 population, England, in the financial year ending 2022
| Indicator | 95% lower CI | 95% higher CI | 99.8% lower CI | 99.8% higher CI | No significance | Suppressed | Total No. of areas |
|---|---|---|---|---|---|---|---|
| Outpatients previous | 0 | 0 | 45 | 60 | 1 | 0 | 106 |
| Outpatients new | 3 | 1 | 42 | 58 | 2 | 0 | 106 |
| Cataracts previous | 1 | 6 | 29 | 50 | 20 | 0 | 106 |
| Cataracts new | 1 | 5 | 28 | 48 | 24 | 0 | 106 |
| Intravitreal previous | 4 | 6 | 47 | 44 | 5 | 0 | 106 |
| Intravitreal new | 5 | 0 | 40 | 41 | 20 | 0 | 106 |
| Retinal Detachment Surgery previous | 4 | 13 | 12 | 7 | 66 | 4 | 106 |
| Retinal Detachment Surgery new | 3 | 10 | 12 | 3 | 74 | 4 | 106 |
Background and further information
The vision profile contains the key indicators contained within the 2021 Atlas of variation in risk factors and healthcare for vision in England to enable indicators to be used alongside other indicators in the fingertips platform.
All the hospital-based indicators from the 2021 Atlas of variation in risk factors and healthcare for vision in England have been updated and can be found in the accompanying datasheet. This includes the 5 HES indicators included in the profile alongside the 5 supporting HES indicators for outpatients, cataracts and intravitreal injections that have been similarly updated. These are:
- vision outpatient first attendances
- vision outpatient follow up attendances
- first intravitreal injection therapy procedures in people aged 60 years and over
- admissions to hospital for first cataract surgery in people aged 65 years and over
- admissions to hospital for second cataract surgery within 12 months in people aged 65 years and over
The website contains where available data for sub-ICBs, ICBs, upper tier local authorities, lower tier local authorities, former Government Office regions and England.
Further details about the profile methodology are available within the definitions section of the online version of the Vision profile.
Responsible statistician, product lead: Liz Rolfe, Julia Verne
For queries relating to this document, please contact: Healthcare.Variation@dhsc.gov.uk