Section 4 – Trade
Updated 19 December 2023

© Crown copyright 2023
This publication is licensed under the terms of the Open Government Licence v3.0 except where otherwise stated. To view this licence, visit nationalarchives.gov.uk/doc/open-government-licence/version/3 or write to the Information Policy Team, The National Archives, Kew, London TW9 4DU, or email: psi@nationalarchives.gov.uk.
Where we have identified any third party copyright information you will need to obtain permission from the copyright holders concerned.
This publication is available at https://www.gov.uk/government/statistics/uk-sea-fisheries-annual-statistics-report-2022/section-4-trade
1. Key Statistics - Trade
The UK is a net importer of fish. The UK’s crude trade gap in 2022 for sea fish is 316 thousand tonnes. This is lower than 2021, where the gap was 322 thousand tonnes.
In 2022 the UK imported 647 thousand tonnes of sea fish, with a value of £3.7 billion. It exported 330 thousand tonnes, with a value of £1.7 billion.
Data on trade is collected by landed weight. This differs to the measure of quantity used in previous sections which is live weight. MMO landings data is reported in terms of live weight which is the weight of the live fish caught from the sea. Landed weight is sometimes smaller if fish are processed (e.g. gutted or shelled) on board a ship prior to being landed.
2. Imports and exports
Figure 4.1: Total imports and exports by the UK in 2022.
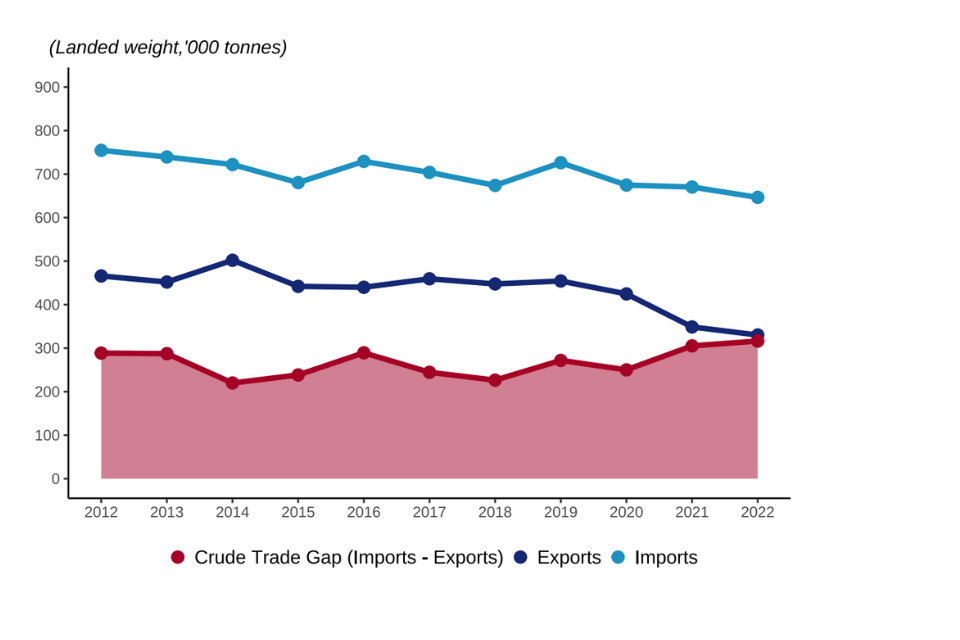
The UK’s trade gap in 2022 for sea fish was 316 thousand tonnes. The UK is a net importer of fish. In 2022 the UK imported 647 thousand tonnes of fish[footnote 1], with a value of £3.7 billion. It exported 330 thousand tonnes. Compared to 2021, the crude trade gap decreased by 2%, caused by a decrease in exports (5%).
Figure 4.2: UK imports and exports of fish and fish products split by species in 2022.

3. Imports
Figure 4.3: Imports into the UK of fish and fish products by top 5 exporting countries in 2022.
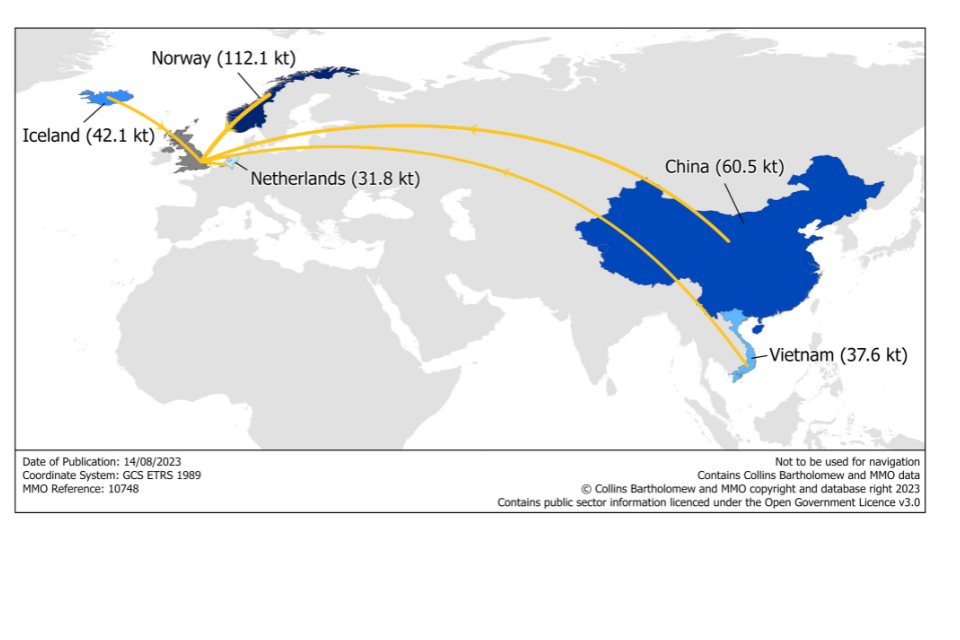
Norway was the country from which the UK imported the most fish and fish products in 2022. Demersal and pelagic fish accounted for 83% of fish imports into the UK by weight. Shellfish accounted for the remaining 17%. In terms of value imported, shellfish made up a slightly higher percentage at 24%, because of the higher price typically fetched by shellfish species[footnote 2].
The UK imported 152 thousand tonnes of fish products[footnote 3] in 2022, with most of which was fish meal (68%). This brings the total imports (including sea fish, freshwater fish and fish products) to 798 thousand tonnes.
Figure 4.4: Imports to the UK of cod by top 5 exporting countries in 2022.
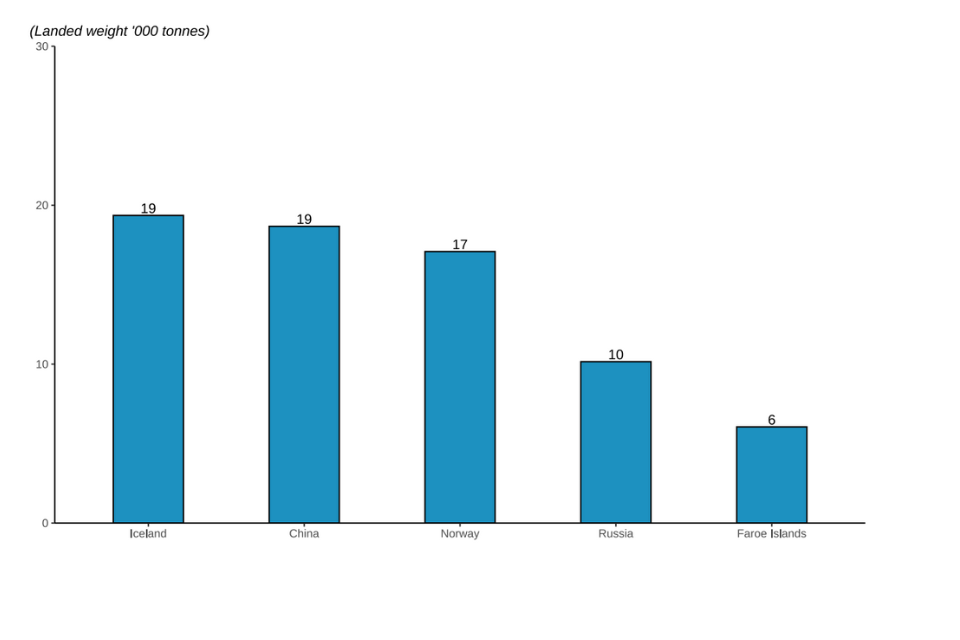
The UK is a net importer of cod, importing 85 thousand tonnes in 2022. The largest exporters of Cod to the UK in 2022 were Iceland (19 thousand tonnes), China (19 thousand tonnes) and Norway (17 thousand tonnes) imports from these 3 countries accounted for 65% of the total imports of Cod into the UK in 2022.
Figure 4.5: Imports to the UK of tuna species by top 5 exporting countries in 2022.
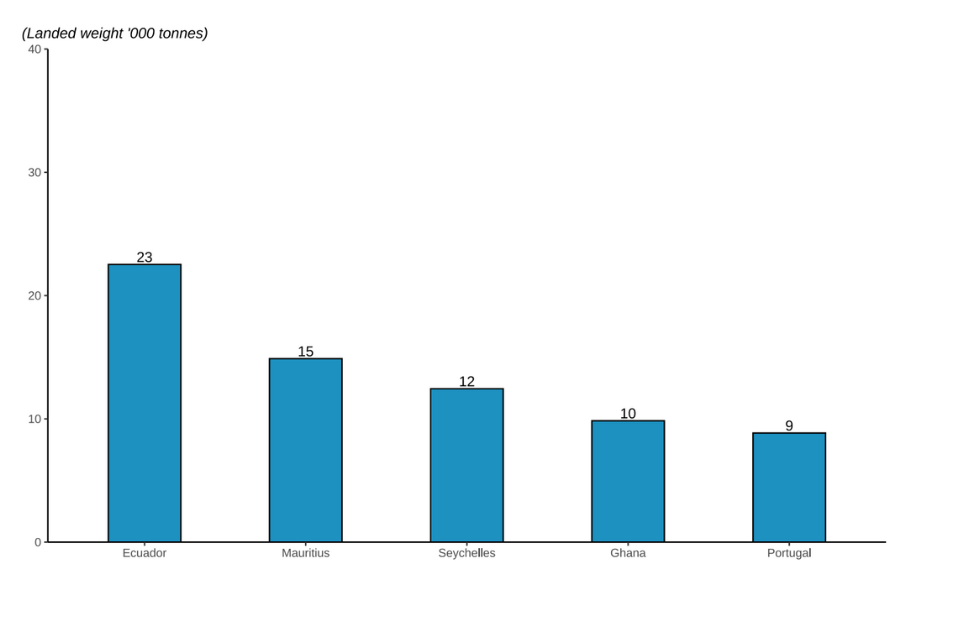
The UK is a net importer of tuna, importing 106 thousand tonnes in 2022. The largest exporters of Tuna to the UK in 2022 were Ecuador, imports from Ecuador accounted for 21% of the total imports of Tuna into the UK in 2022.
Figure 4.6: Imports to the UK of shrimps and prawns by top 5 exporting countries in 2022.
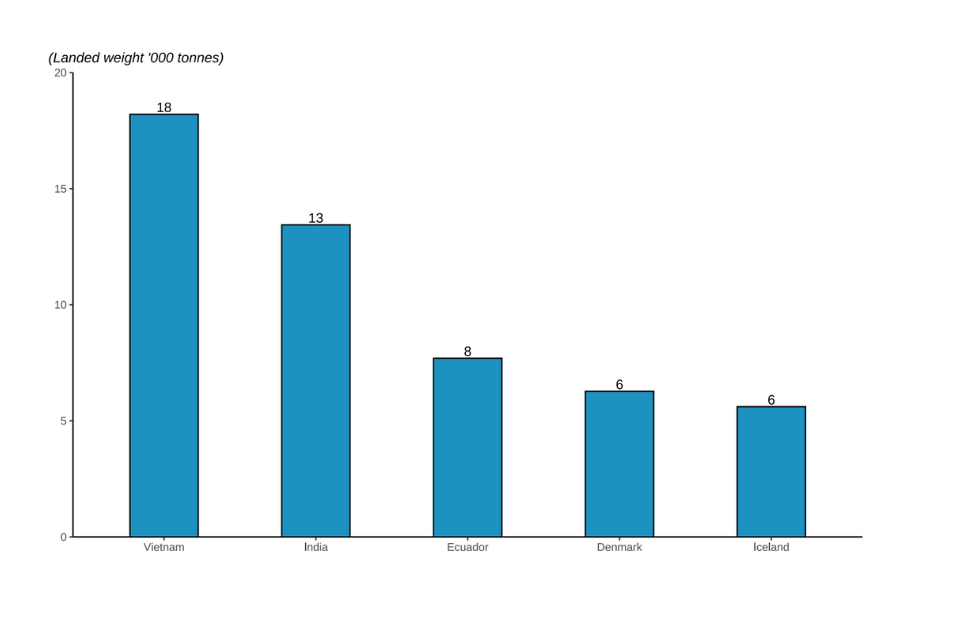
The UK is a net importer of shrimps and prawns, importing 78 thousand tonnes in 2022. The largest exporters of shrimps and prawns to the UK in 2022 were Vietnam (18 thousand tonnes) and India (13 thousand tonnes), imports from these two countries accounted for 41% of the total imports of shrimps and prawns into the UK in 2022.
4. Exports
Figure 4.7: Exports from the UK of fish and fish products by top 5 importing countries in 2022.
The UK exported the most fish and fish products to France in 2022. Demersal and pelagic fish accounted for 83% of fish exports out of the UK by weight with shellfish accounting for 17%. This is identical to the split seen for imports. Shellfish similarly make up a higher percentage of the exports by value owing to their higher price per tonne on average than other sea fish (28%). The UK exported 14 thousand tonnes of fish products in 2022, bringing the total exports (including sea fish, freshwater fish and fish products) to 345 thousand tonnes.
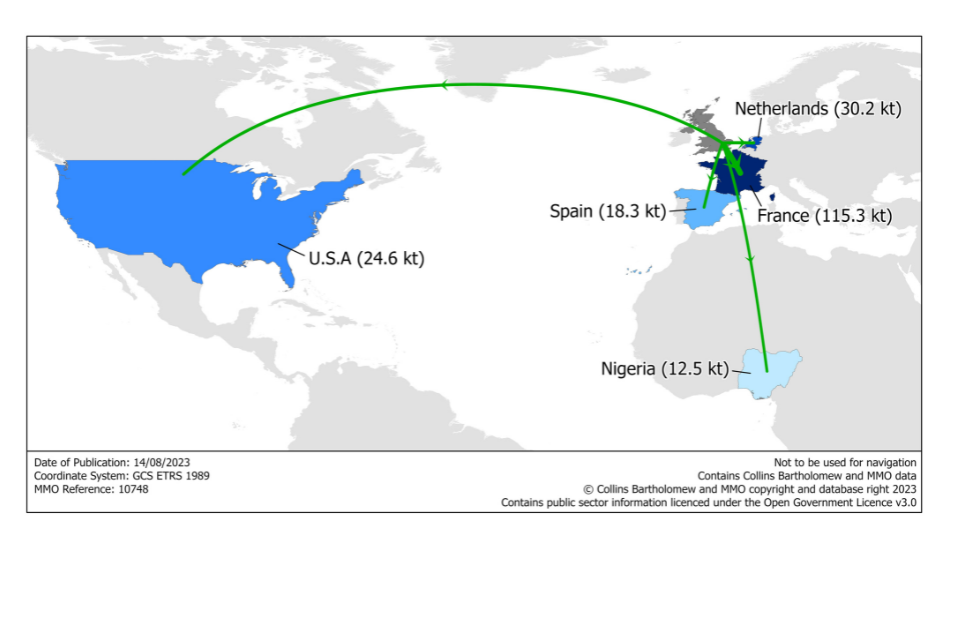
Figure 4.8: Exports from the UK of Mackerel by top 5 importing countries.
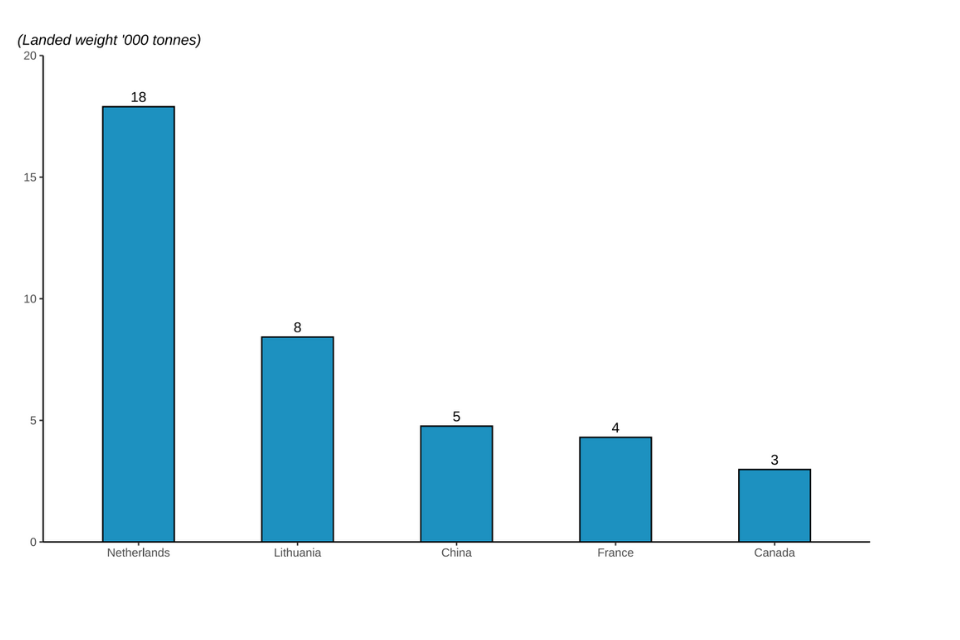
The UK is a net exporter of mackerel, exporting 58 thousand tonnes in 2022. Mackerel exports increased by 6% compared to 2021. The largest share of mackerel exports went to Netherlands (18 thousand tonnes).
5. GDP
GDP
Gross Domestic Product (GDP) provides an economic snapshot for a country. Within countries, this is split into different sectors so you can see how much different industries contribute to the economy. Within the UK GDP for fishing includes landings abroad by the UK fleet and the aquaculture sector. Fishing can then be grouped with the wider agriculture, forestry and fishing GDP total.
The GDP for fishing (including aquaculture) comprises 4.3% of the total for agriculture, forestry and fishing[footnote 4].
-
Excluding fish products ↩
-
Table 2.12. ↩
-
Fish products includes e.g. fish meal and oils. ↩
-
http://www.ons.gov.uk/ons/datasets-and-tables/data-selector.html?table-id=A1&dataset=pn2 . ↩