Section 2 - Landings
Updated 19 December 2023

© Crown copyright 2023
This publication is licensed under the terms of the Open Government Licence v3.0 except where otherwise stated. To view this licence, visit nationalarchives.gov.uk/doc/open-government-licence/version/3 or write to the Information Policy Team, The National Archives, Kew, London TW9 4DU, or email: psi@nationalarchives.gov.uk.
Where we have identified any third party copyright information you will need to obtain permission from the copyright holders concerned.
This publication is available at https://www.gov.uk/government/statistics/uk-sea-fisheries-annual-statistics-report-2022/section-2-landings
1. Key Statistics - Landings
In 2022, UK vessels landed 640 thousand tonnes of sea fish with a value of £1.04 billion. Compared to 2021, this is a decrease of 2% in quantity, however an increase in value of 13%. The increase in value is mainly driven by higher fish prices.
Landings into the UK by foreign vessels in 2022 was 19 thousand tonnes, which compared to 2021 represents a 4% reduction. Landings abroad by UK vessels also decreased to 245 thousand tonnes, a reduction of 5%.
2. UK summary
In 2022, UK vessels landed 640 thousand tonnes[footnote 1] of sea fish into the UK and abroad with a value of £1.04 billion[footnote 2]. Compared to 2021, this is a decrease in the quantity of sea fish landed (2%), however a 13% increase in value landed.
Multiple factors impact fishing, and landings tend to fluctuate considerably over time. Since 2020, the biggest impact on sea fisheries was the effect of the UK’s departure from the EU. This had an impact on the stocks the UK fleet had access to fish in subsequent years, including 2022.
Species groups
Fish are commonly split into three groups of similar species.
-
Demersal fish inhabit the bottom of the ocean. Key demersal species fished by the UK fleet include cod and haddock.
-
Pelagic fish inhabit the water column (not near the seabed or shore). The two main pelagic species fished by the UK fleet are mackerel and herring.
-
Shellfish include various species of molluscs (e.g. scallops, whelks) and crustaceans (e.g. crabs and nephrops).
The quantity of landings in 2022 decreased compared to 2021 driven by a decrease (2%) of lower value pelagic species compared to 2021. However, the overall value of landings increased due to higher value shellfish and demersal species, increasing by 14% and 21% respectively.
3. Vessel nationality
Figure 2.1: Quantity of landings by the UK fleet between 2018 and 2022 by fisheries administration.
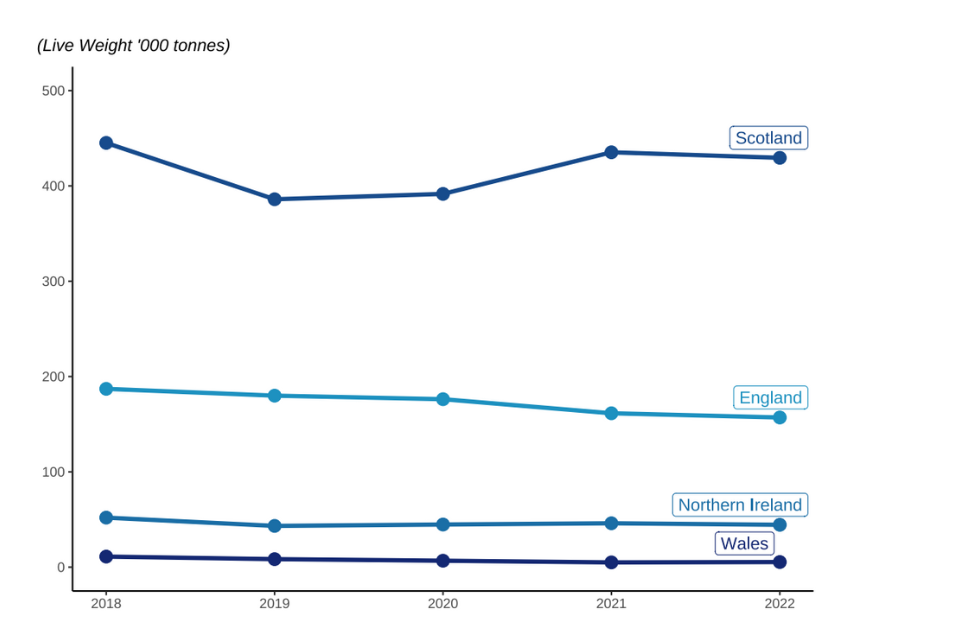
Of the four UK nations, Scotland lands the most fish by quantity and value. At the country level, the landed weight of fish by each of the four nations remains relatively stable over time. A notable exception is the 13% decrease in landings by Scottish vessels between 2018 and 2019. This reduction was mainly driven by a reduction in landings of pelagic species, due to smaller quotas for key pelagic species. In recent years (2021 and 2022) this has now returned to 2018 levels, again driven by an increase in available quota for key pelagic stocks leading to increased pelagic uptake compared to 2019 and 2020.
4. Vessel length
Over three quarters of the total quantity of fish caught by UK vessels in 2022 was landed by vessels over 24 metres in length. In 2022, these vessels represented just 4% of the UK fleet by number. The large volume of landings by these large vessels is explained by their very high fishing capacity and power.
Landings of pelagic species by vessels over 24 metres in length accounted for 97% of the annual total pelagic landings for the whole UK fleet. 75% of all landings of demersal species by the UK fleet were by vessels over 24 metres in length.
In contrast, landings of shellfish are more evenly distributed across the fleet, with vessels 10 metres and under in length accounting for 21% of the total quantity of shellfish landings. Landings of shellfish made by 18 – 24m vessels accounted for 24% of shellfish landings.
Table 2.2: Quantity of landings by UK vessels 10m and under and over 10m
| Vessel Length | 2021 | 2022 | Percentage Change |
| Quantity (‘000 Tonnes) | |||
| 10m and under | 35.9 | 31.9 | -11% |
| Over 10m | 615.9 | 608.4 | -1% |
| Value (£ million) | |||
| 10m and under | 121.5 | 127.1 | 5% |
| Over 10m | 799.8 | 910.1 | 14% |
Figure 2.3: Value of landings by the UK fleet in 2022 by fishing vessel length and species group.
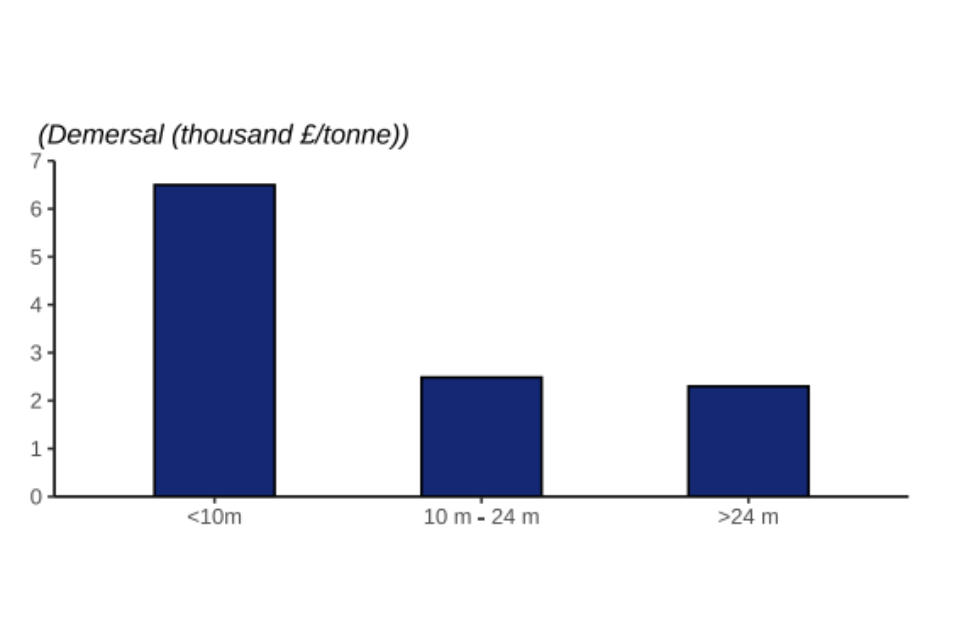
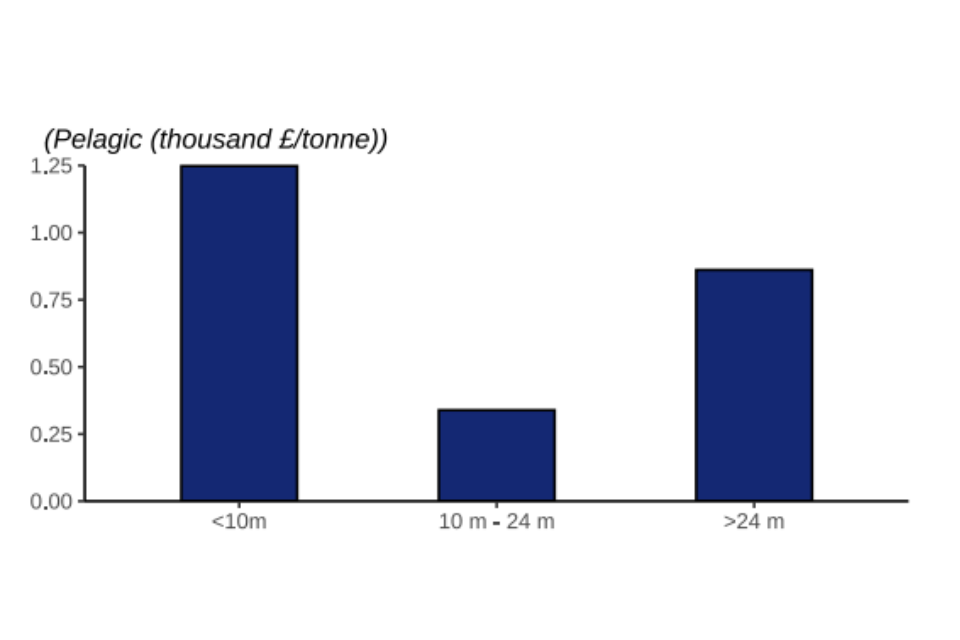
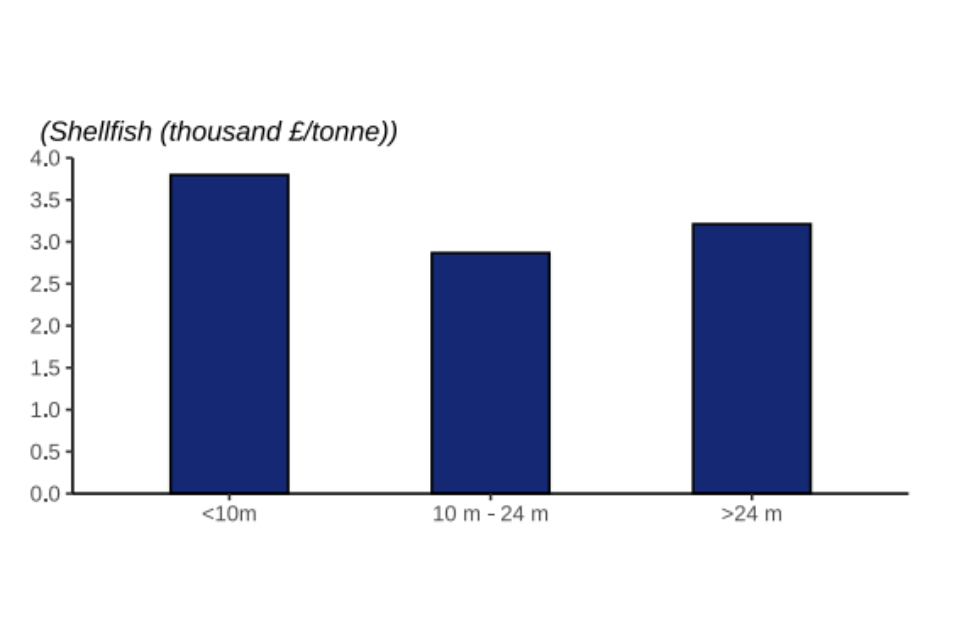
Overall, vessels under 10 metres fetch a higher price per tonne for their landings (landings by under 10 metre vessels are 69% higher than those by over 24 metre vessels). This is especially true for demersal catches. Demersal landings by vessels under 10 metres fetch prices 65% higher than vessels over 24 metres. Landings of demersal species by larger vessels tend to be frozen on board the vessel and sold in bulk, contributing to their lower price per tonne.
5. Industry group[footnote 3]
Around 86% of the quantity of landings by the UK fleet in 2022 was landed by vessels in a Fish Producer Organisation (FPO) . The largest FPO, Scottish FPO, accounted for 18% of both the quantity and value of fish landed by the UK fleet.
Some Producer Organisations target specific species groups. For example, vessels in North Atlantic FPO, Lunar Group and Interfish and Klondyke primarily target pelagic species. Other FPOs are segregated more by region. For example, Wales and West Coast FPO and South Western FPO.
Over a third of UK vessels over 10 metres in length were in the non-sector (vessels without Producer Organisation membership). These vessels typically have limited access to fishing quota and primarily target shellfish species, which are mostly non-quota stocks. In 2022 they caught 29% of all shellfish, 1% of demersal and 1% of pelagic species landed by the UK fleet.
Vessels 10 metres and under in length without Producer Organisation membership (the ‘10m and under pool’) also landed relatively small quantities of demersal and pelagic species, with 79% shellfish landings. The fishing methods used by this sector and the different species targeted mean that they typically gain higher than average prices for their catch (Figure 2.3).
6. Species group
Figure 2.4: Quantity of landings by UK vessels in 2022 by species group.
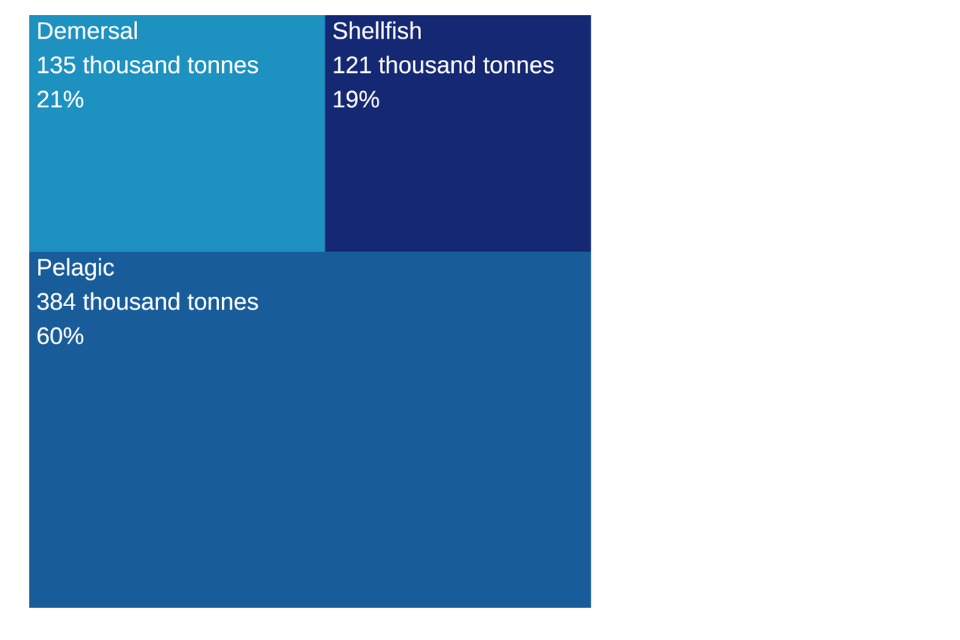
Pelagic species make up 60% of the total quantity of landings by UK vessels, while only contributing just under a third of the value landed (Figure 2.5) this is due to pelagic species typically fetching a lower price per tonne. Shellfish landings make up 19% of the total quantity landed but accounted for £50 million more than pelagic landings. In 2022, a slightly higher proportion of landings by quantity were demersal (21%) than in 2021 (20%).
Figure 2.5: Value of landings by UK vessels between 2018 and 2022 by species group.
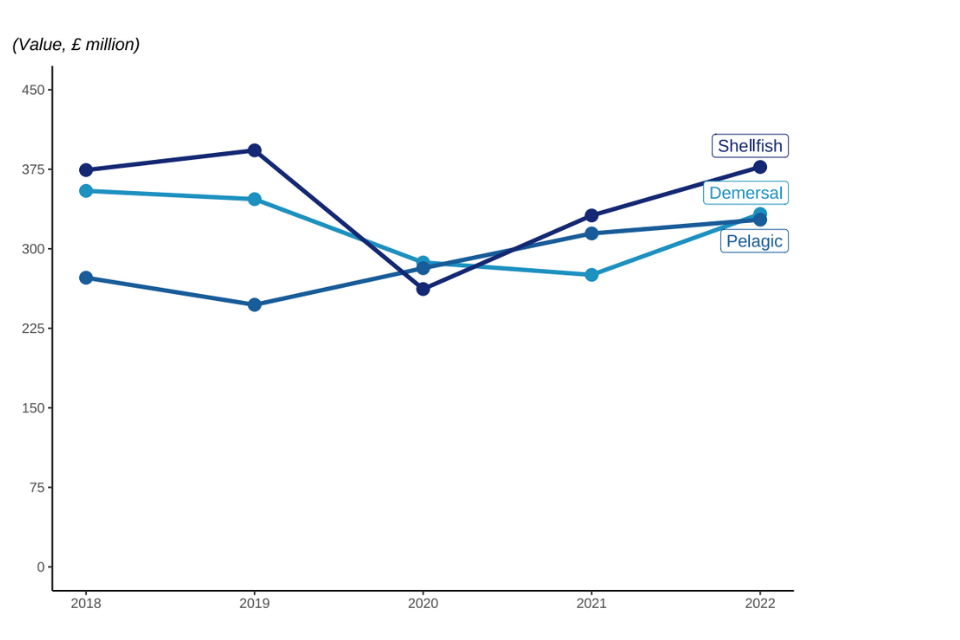
The value of landings increased in 2022 across all species groups, with value of landings for demersal species showing the largest increase compared to 2021.
The value of pelagic landings between 2021 and 2022 increased by 4%, even with a decrease in quantity landed of pelagic species, due to prices of key pelagic species slightly up compared to 2021[footnote 6].
The quantity of demersal landings increased by 2% while the value of those landings increased by 18%. Shellfish landings decreased by 3% while their value increased by 15%. The price per tonne fetched for shellfish species increased across all species groups, with the highest increase seen in shellfish (21%). Pelagic species had the smallest increase (5%).
7. Demersal
Figure 2.6: Quantity and value of landings between 2018 and 2022 by UK vessels of different demersal species fish; Cod, Haddock, and Monks or Anglers.
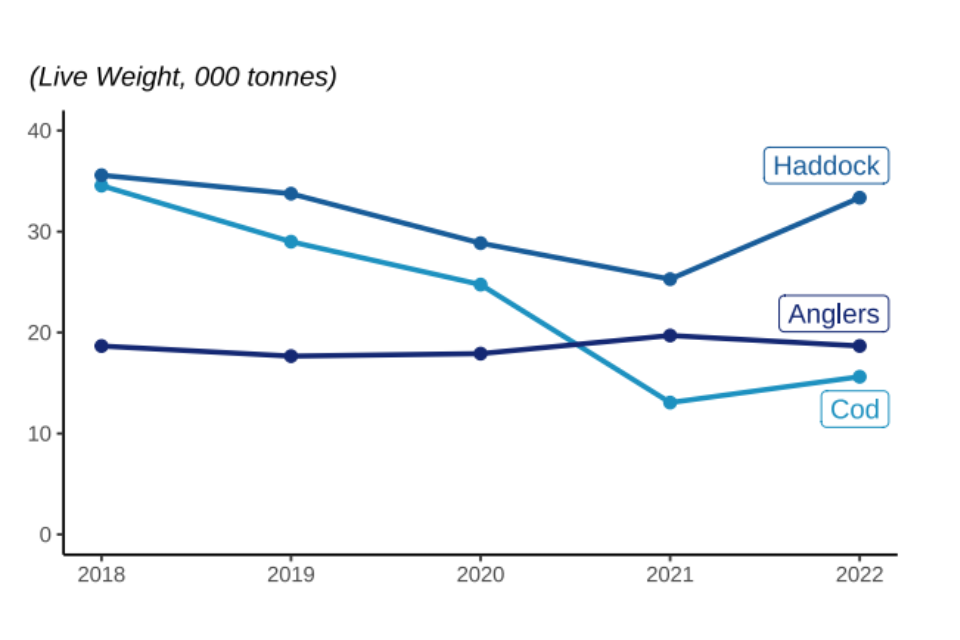
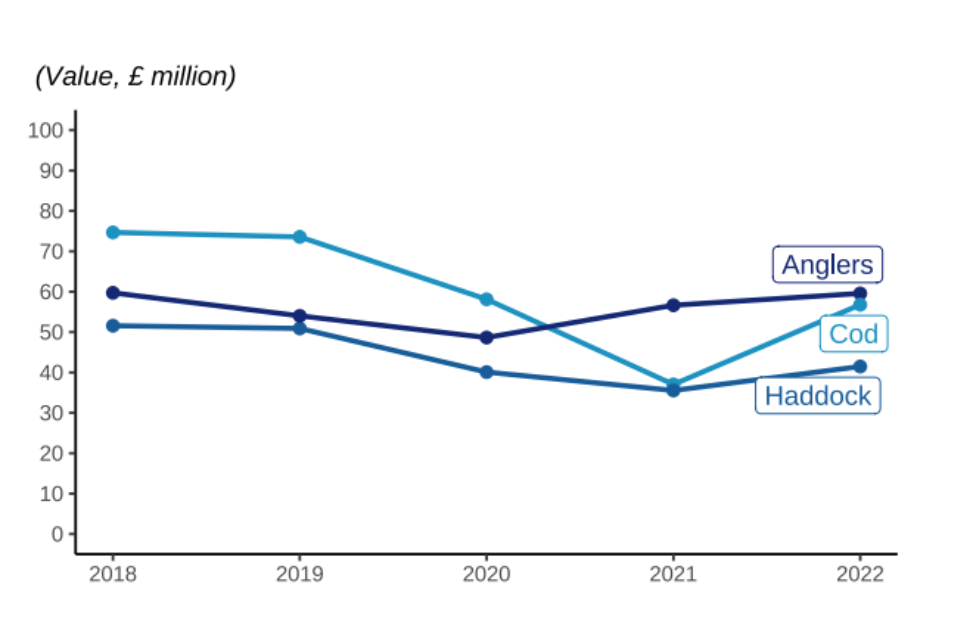
Landings of key demersal, species specifically cod and haddock, have increased in 2022. Landings of cod increased compared to 2021 (20%) leading to a large increase in the value landed (53%).
Landings of demersal species, particularly cod and haddock, have fallen considerably since 1996. This follows the long-term declining trend reported since 1938[footnote 7]. In 2022, landings of demersal fish were around 16% of the quantity landed in 1938.
The decline in landings of demersal fish has several causes, including reductions in fleet size, declining fish stocks and restricted fishing opportunities. National and international regulations have limited demersal fishing activity in recent decades, through decommissioning of fishing vessels, reductions in quotas and fishing effort limits and other provisions of stock management plans.
Figure 2.7: Quantity and value of landings in 2022 by UK vessels of different demersal species fish; Cod, Haddock, and Monks or Anglers.
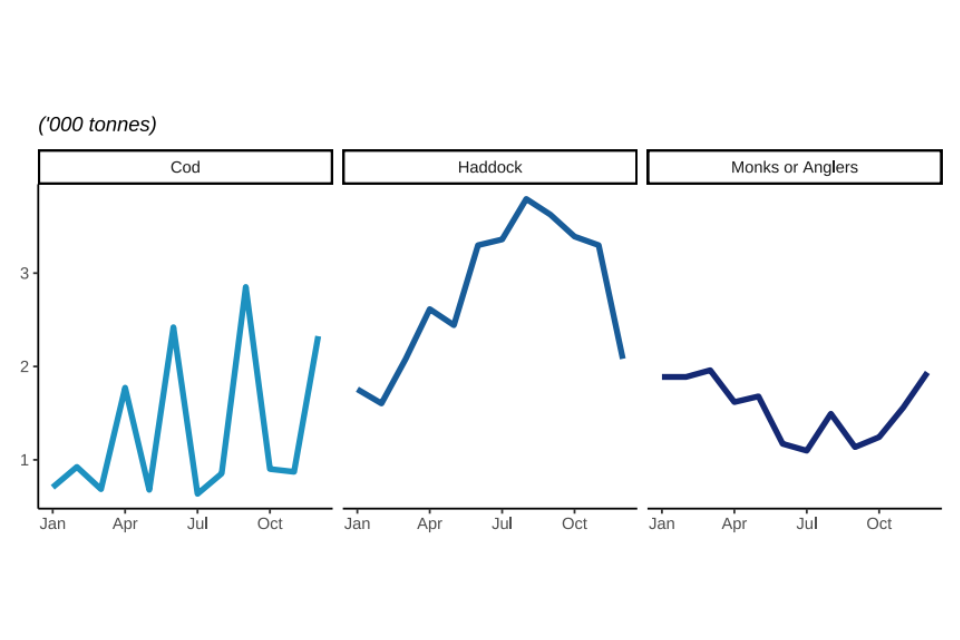
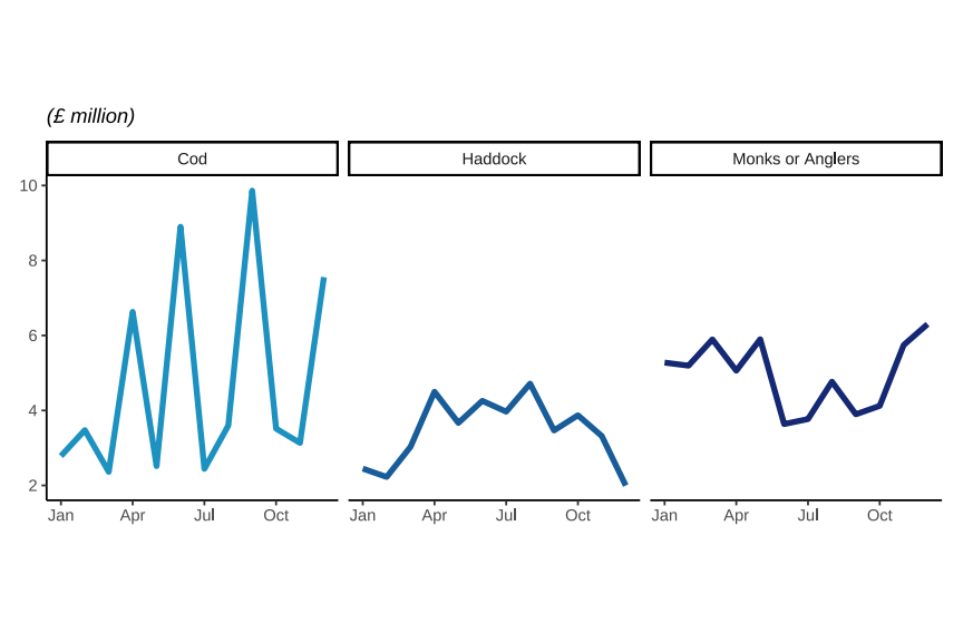
Landings of cod fluctuate more than haddock and anglerfish as the UK’s distant water fleet has targeted cod in e.g., Faroese waters. The distant water fleet are vessels that fish outside their own territories and often into other countries Exclusive Economic Zones (EEZ) and international waters. These large vessels can be out to sea for months and land huge volumes of fish at a time. This explains the spikes in quantity landed every few months.
Sole, turbot and halibut all command the highest price of demersal species landed by the UK fleet, ranging between £12,000 and £15,000 per tonne in 2022[footnote 8]. These high prices, particularly for sole, are likely down to reduced supply following the introduction of the Sole Recovery Zone[footnote 9].
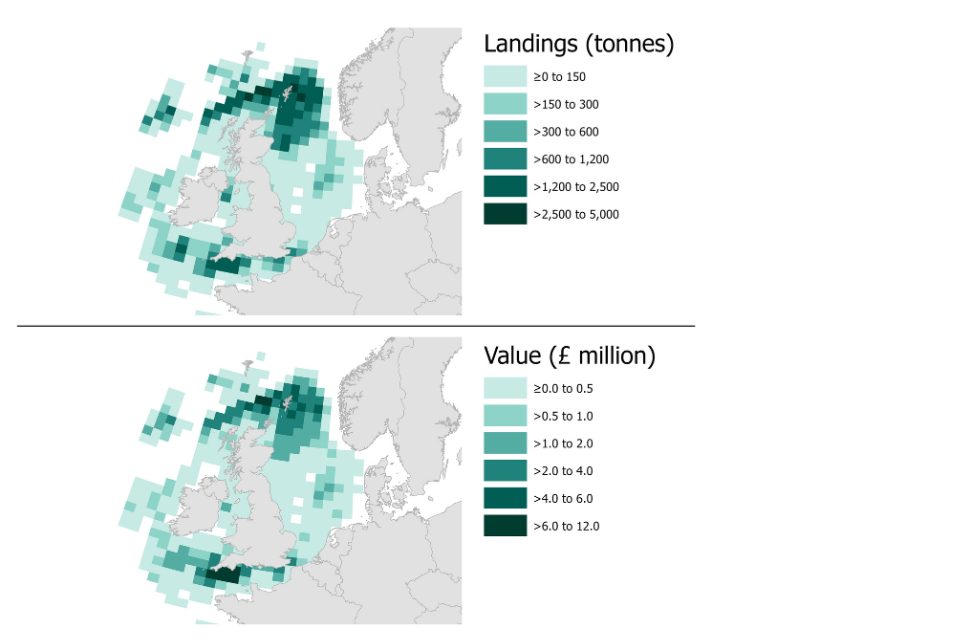
ICES rectangle
The International Council for the Exploration of the Seas (ICES) standardise the division of sea areas for analysis. Each ICES statistical rectangle is 30 min latitude by 1-degree longitude, which is approximately 30 nautical miles by 30 nautical miles. Note that the area of ICES rectangles varies because the Earth is a sphere.
ICES rectangles are amalgamated to create ICES areas.
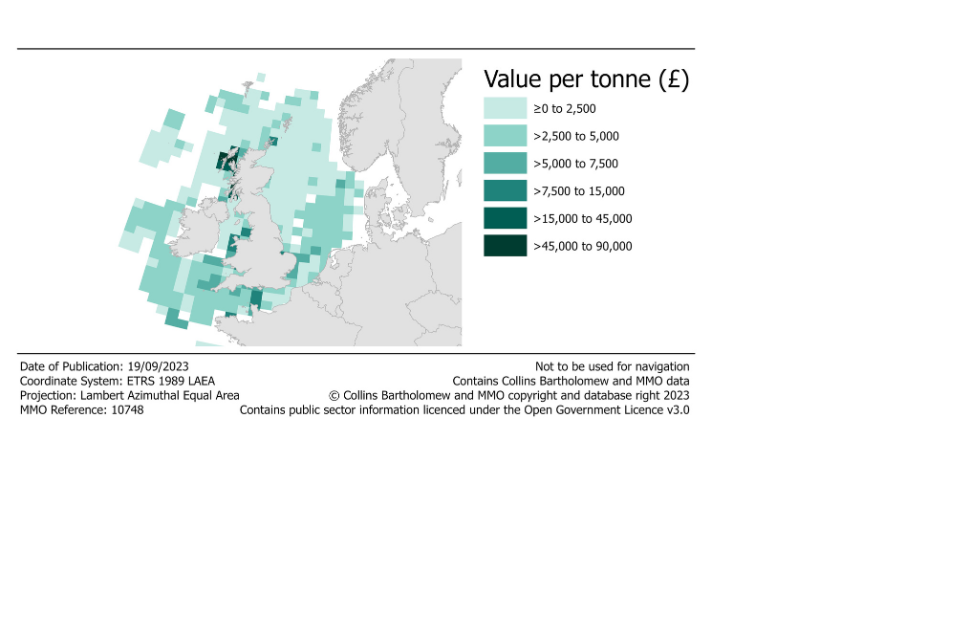
The following maps show landings of demersal species by the UK fleet in 2022 by ICES rectangle of capture. In 2022, the largest quantities and value of demersal species caught by the UK fleet were in the north-east of Scotland, the central North Sea and the English Channel. Demersal species with the highest average prices were captured by the UK fleet from waters along the west coast of Scotland.
Figure 2.8: Quantity and value of landings of demersal species by the UK fleet in 2022 by ICES rectangle.[footnote 10]
8. Pelagic
Figure 2.9: Quantity and value of landings between 2018 and 2022 by UK vessels of different pelagic species fish; Blue Whiting, Herring, and Mackerel.
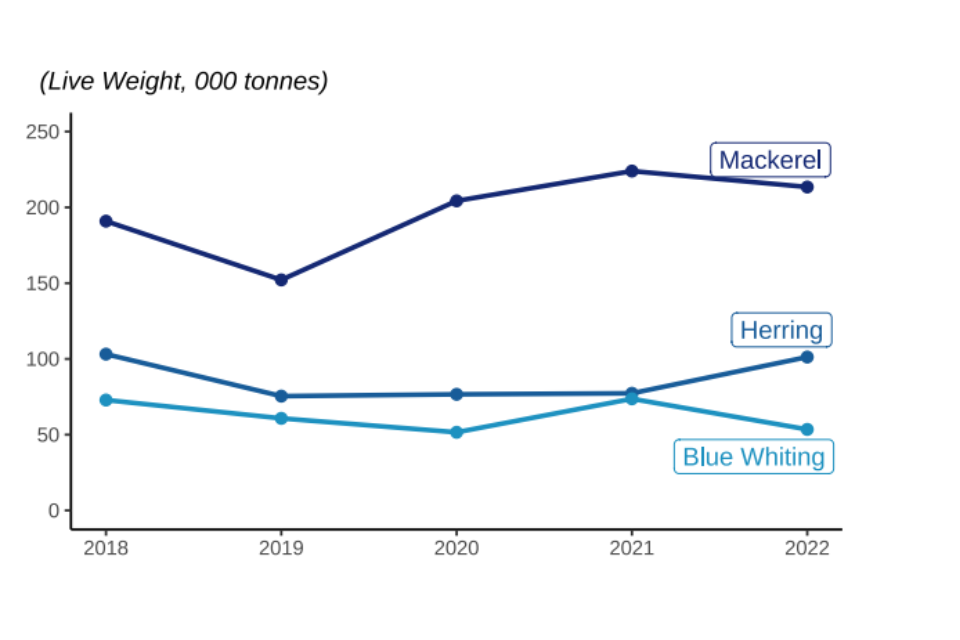
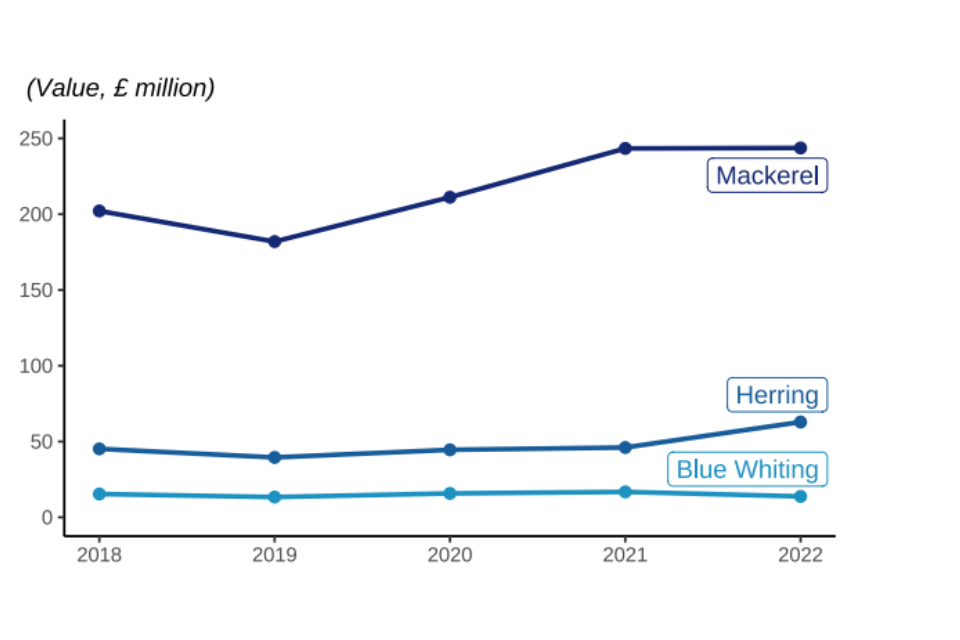
In 2022, the quantity of mackerel landed by UK vessels was 5% lower than in 2021 however, the value landed showed little change (<1%). The UK fleet catches more mackerel than any other species – over 213 thousand tonnes in 2022, comprising 33% of the total UK catch in 2022. 58% of mackerel landings by UK vessels were landed abroad in 2022.
Most pelagic species are under stock management plans with quotas. Their annual landings therefore track quota limits. Landings of herring have not fluctuated as much as mackerel, as their quota limits have been more stable in the past five years.
Like most demersal species, most pelagic species are managed by quota limits. However, pelagic landings have not seen the same reduction as demersal species over the very long term. When compared to 1938, pelagic landings in 2022 were 43 % lower, while demersal landings were down 84%.
Figure 2.10: Quantity and value of landings in 2022 by UK vessels of different pelagic species fish; Blue Whiting, Herring, and Mackerel.
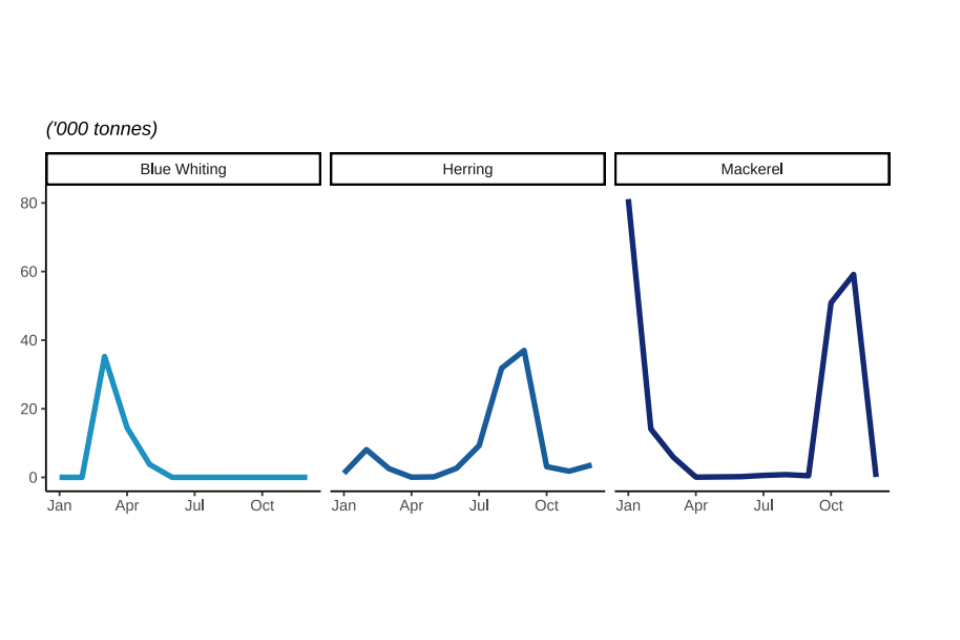
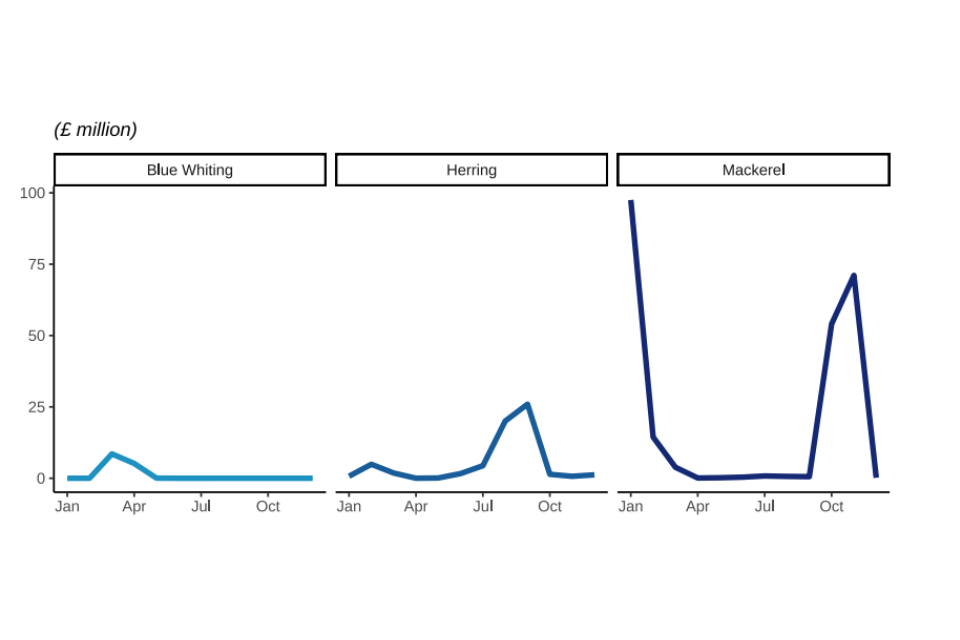
Pelagic landings follow seasonal patterns. Mackerel is a winter fishery for larger vessels therefore, large landings are seen annually in January, February and October and November. Quotas had almost been exhausted by the end of the year, so catches are consistently lower in December.
Around 97% of all mackerel landings into the UK by the UK fleet in 2022 were in those four peak months.
A two-month period (August to September) accounts for 78% of herring landed into the UK by the UK fleet. Landings in June and July came primarily from the Northern North Sea and were supplemented in August and September by fisheries in the Irish Sea.
The following maps show landings of pelagic species by the UK fleet in 2022 by ICES rectangle of capture. In 2022, the largest quantities and value of pelagic species caught by the UK fleet were captured from rectangles near Shetland and from the north coast of Scotland down to the north-west coast of Ireland. Price per tonne was more evenly spread across ICES rectangles, with the highest prices fetched closer to the southwest coast.
Figure 2.11: Quantity and value of landings of pelagic species by the UK fleet in 2022 by ICES rectangle.
9. Shellfish
Figure 2.12: Quantity and value of landings between 2018 and 2022 by UK vessels of different shellfish species fish; Crabs, Nephrops, and Scallops.
Nephrops (also known as langoustine or Norway lobster), crabs and scallops are the main shellfish species landed by the UK fleet, accounting for 68% of all shellfish landings made by the UK fleet in 2022.
Value of landings of these three key species increased between 2021 and 2022, the increase in the value of nephrops landings was the most prominent at 28%.
Over the last eighty years, landings of demersal and pelagic landings have decreased substantially (discussed above). In contrast, landings of shellfish have increased by over 260%, from 32 thousand tonnes to almost 116 thousand tonnes in 2022.
This is partly driven because, for shellfish species, quotas only apply to nephrops. Further, the increase in shellfish landings by the UK fleet is likely due to the industry diversifying into the shellfish sector, where there are often fewer restrictions on fishing opportunities.
Successive improvements in data collection for this sector in recent years, including the introduction of mandatory reporting of first sales of fish, may account for some of the increase in reported landings. A large proportion of shellfish landings are by vessels 10 metres or under in length, for which there was no statutory obligation to report activity prior to 2022. From March 2022 this is now mandatory, with the introduction of the catch recording app. Due to 2022 representing an incomplete year of catch recording data, this is not included within landings figures within this release.
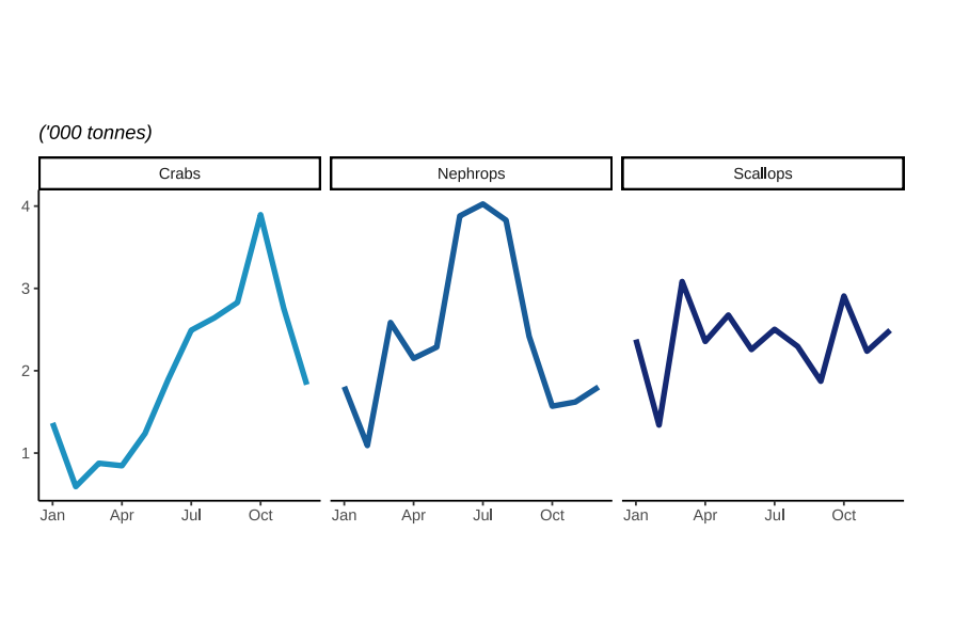
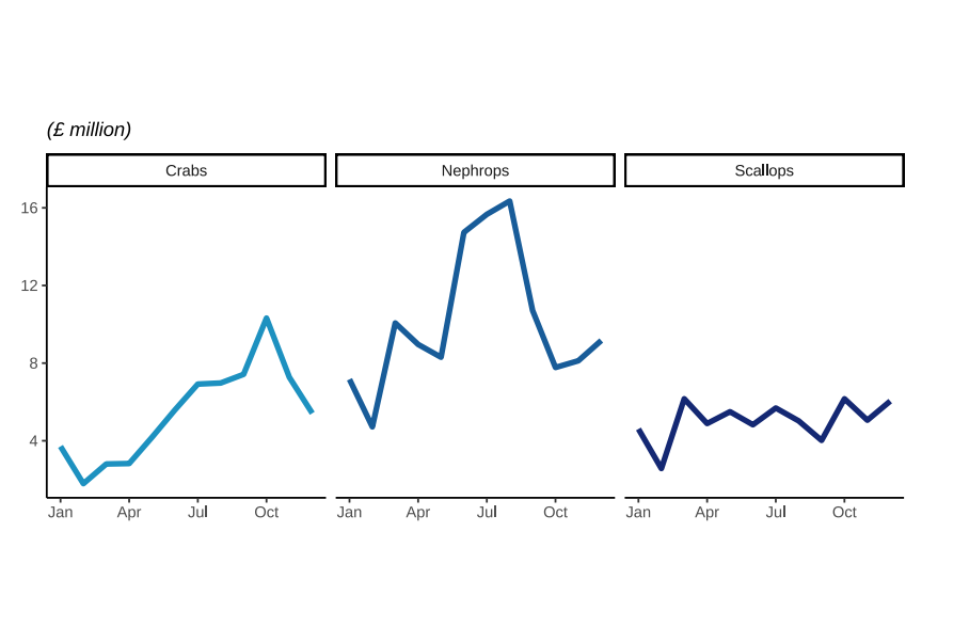
Figure 2.13: Quantity and value of landings in 2022 by UK vessels of different shellfish species fish; Crabs, Nephrops, and Scallops.
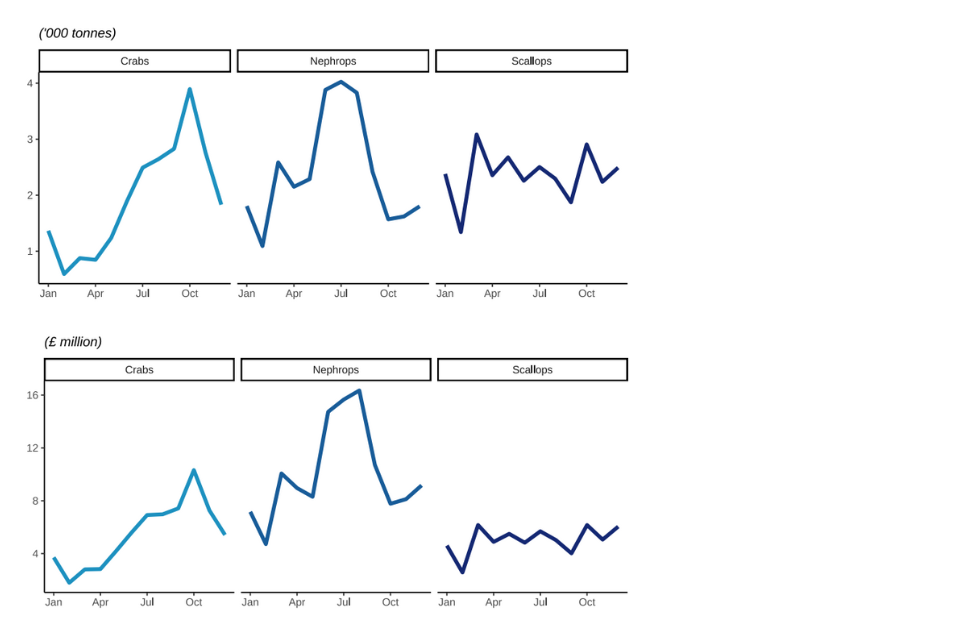
Landings of nephrops fluctuate but show the highest peak in summer months. Crabs and scallops peak in landings towards the end of the year before Christmas period.
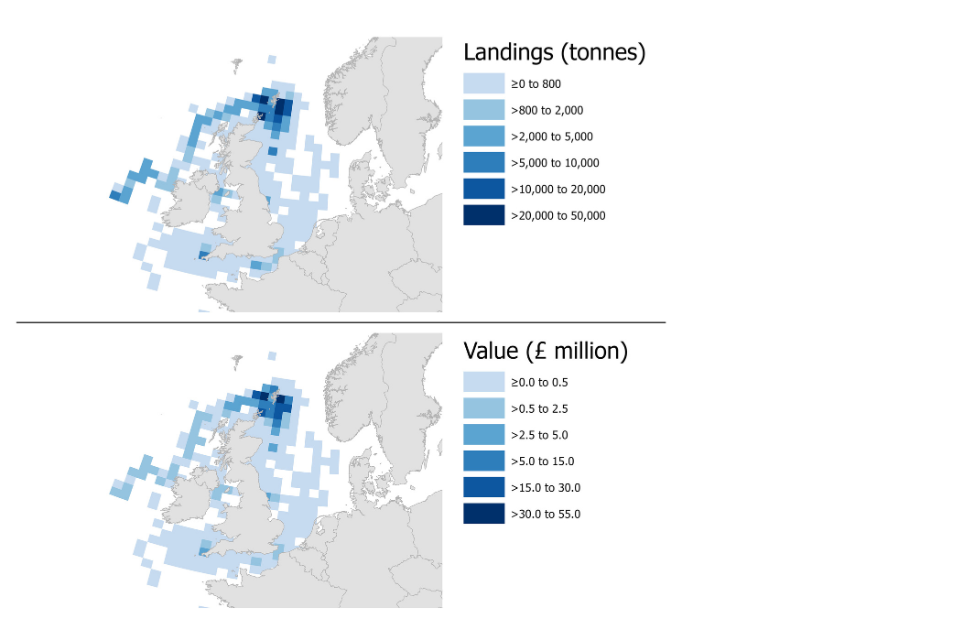
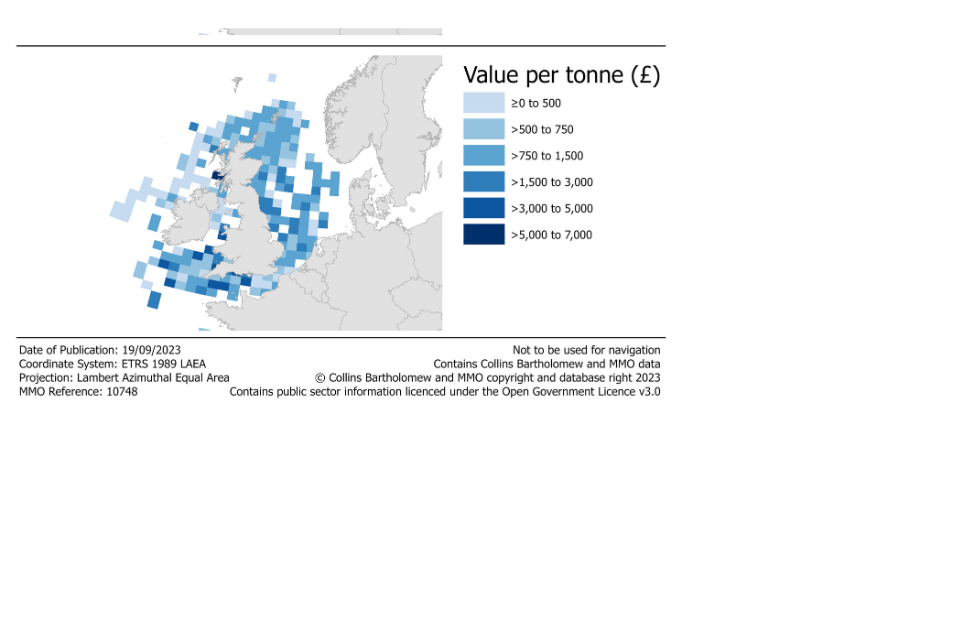
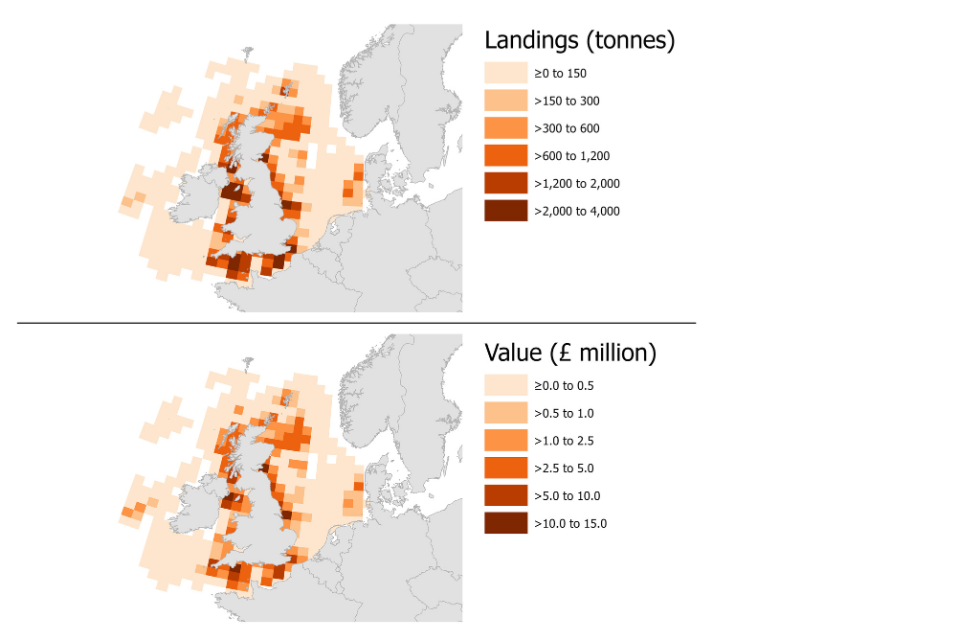
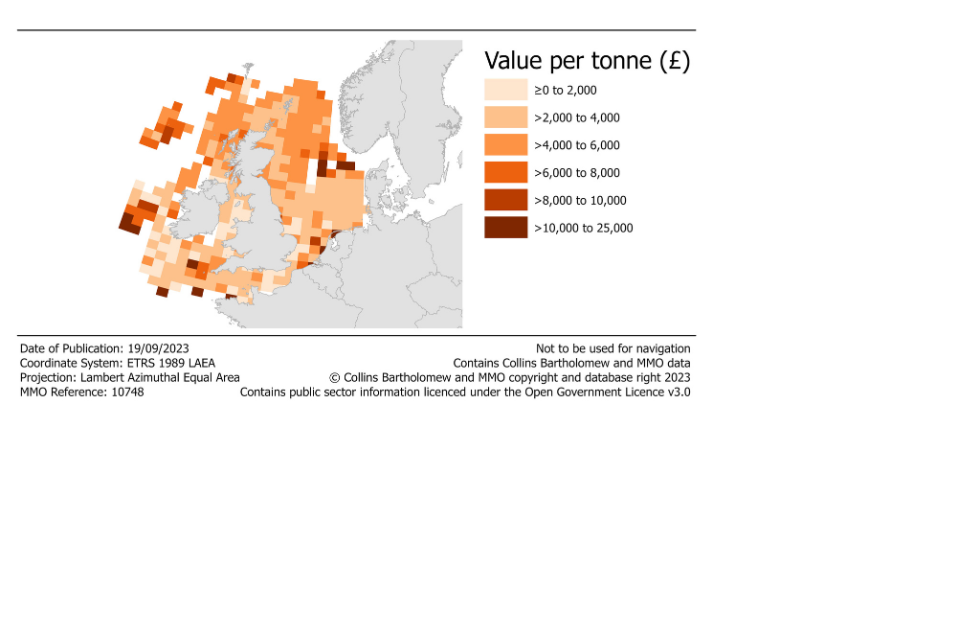
The following maps show landings of shellfish species by the UK fleet in 2022 by ICES rectangle of capture. In 2022, both the largest quantity and value of shellfish were captured in rectangles relatively close to the coast of the UK. However, shellfish species with high prices were typically captured in rectangles away from coastal areas, in particular off the west coast of Ireland around Porcupine bank.
Figure 2.14: Landings of shellfish species by the UK fleet in 2022 by ICES rectangle.
10. Landings by port
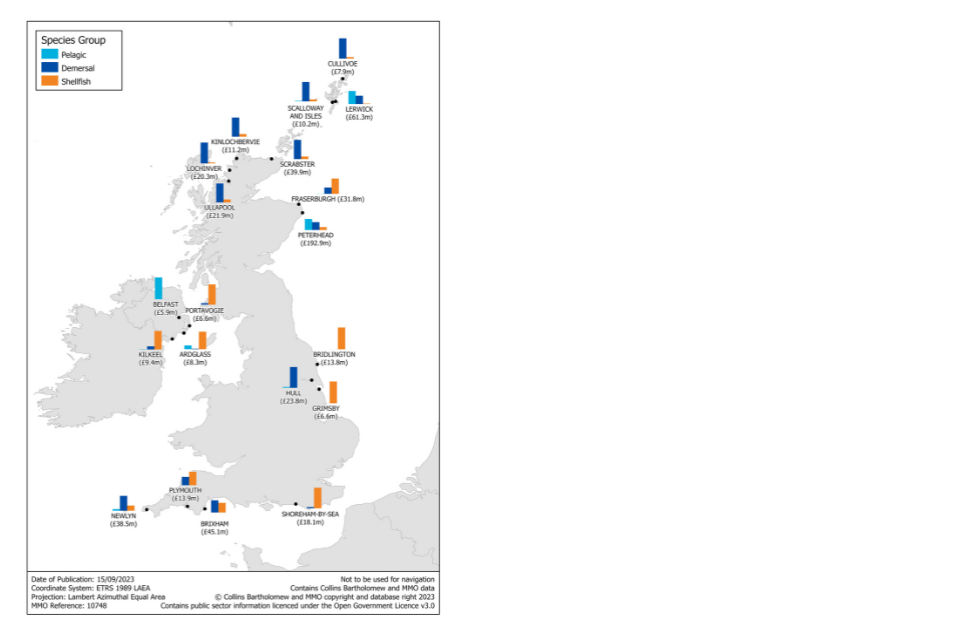
Figure 2.15: Quantity and value of landings in 2022 into UK ports.
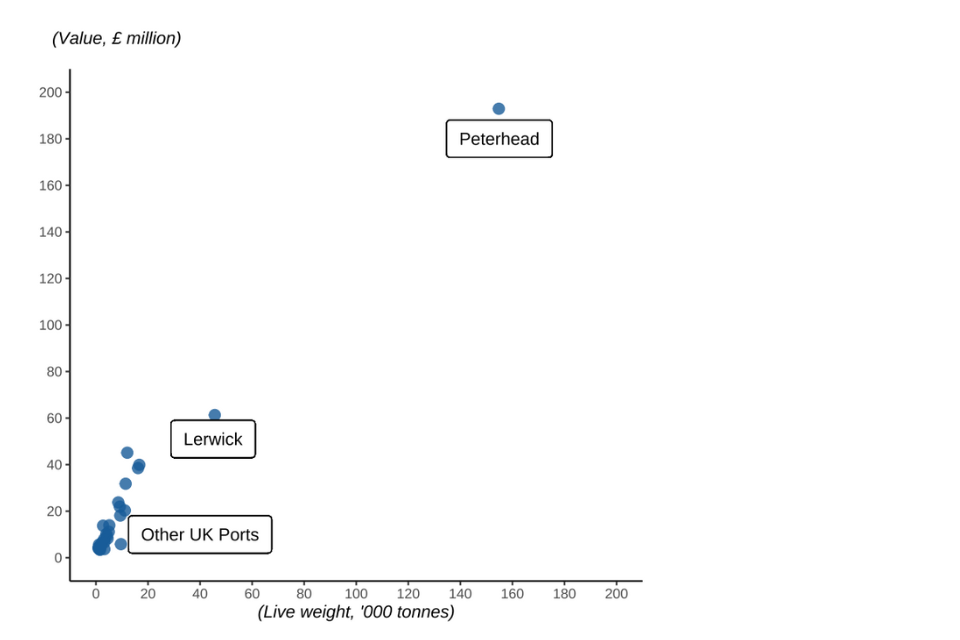
Peterhead continually tops the leader board for the largest port landings, with Lerwick in second place. These ports are all in Northern Scotland. In England, Newlyn was the port with the highest quantity of landings, while Brixham had the highest value of landings.
Approximately 72% of all landings by UK vessels into Scotland were into Peterhead and Lerwick, this is because Peterhead and Lerwick specialise in pelagic species, where landings are higher in 2022 than 2021.
Contrastingly, landings into Newlyn and Brixham (the top 2 English ports) formed only 31% of landings into England, with the remaining landings more evenly spread around the English coast.
Figure 2.16: Quantity of landings into the UK’s top 20 ports in 2022.
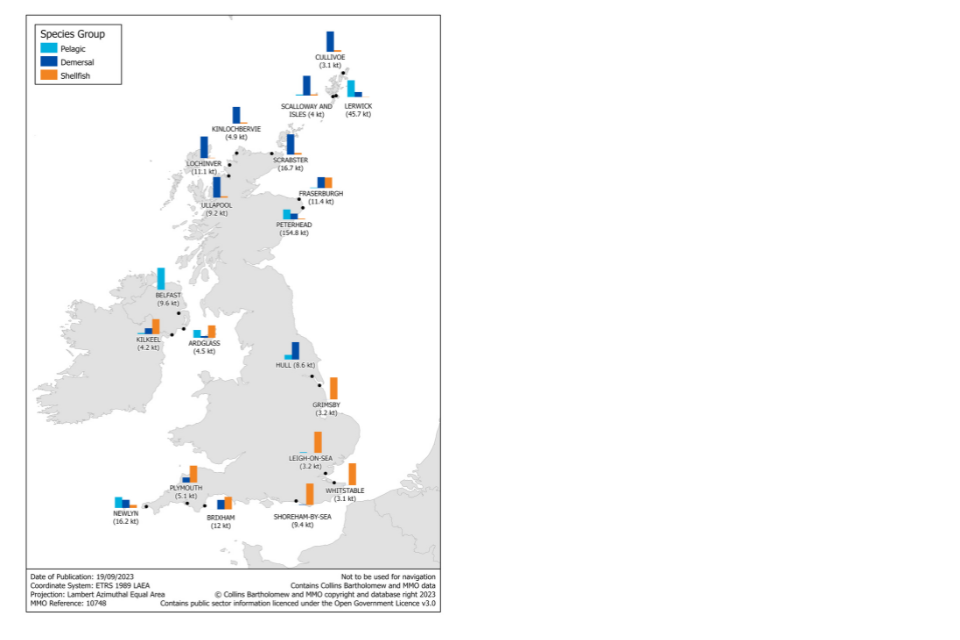
Figure 2.17: Value of landings into the UK’s top 20 ports in 2022.
11. Landings abroad by the UK fleet
Figure 2.18: Quantity of landings abroad by the UK fleet in 2022.
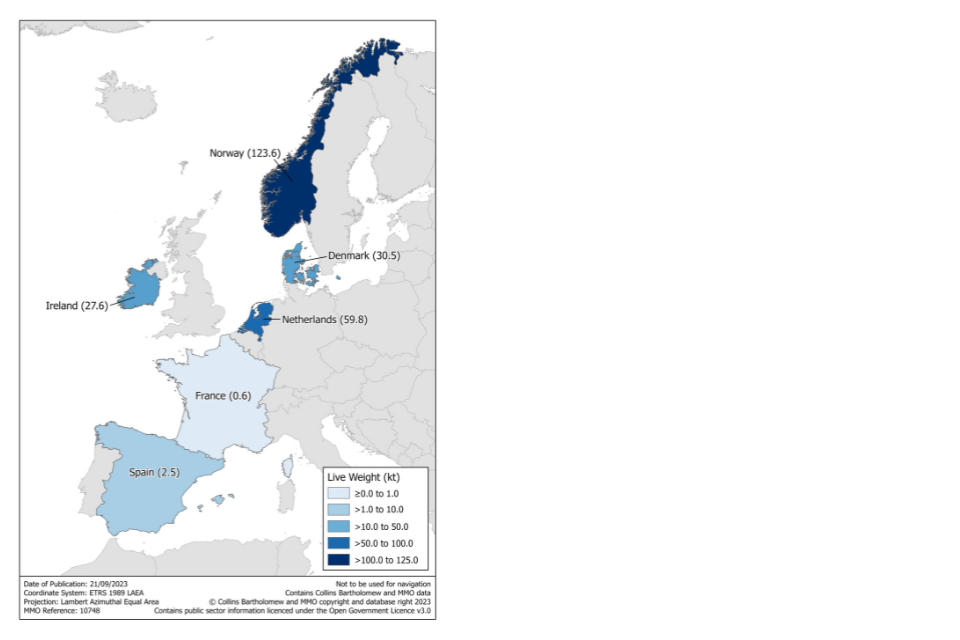
In total in 2022, UK vessels landed 245 thousand tonnes of fish abroad. This is 38% of the total quantity of fish landed by UK vessels and represents 24% of the value of all fish landed by UK vessels. The majority of landings abroad are pelagic fish species. 90% of landings abroad were pelagic species, 52% of which was mackerel. Pelagic species fetch a lower price than most demersal and shellfish species which explains the 17% difference between the quantity and value landed abroad for pelagic species. Half of all landings abroad were into Norway, followed by almost a quarter of landings into ports in the Netherlands. A small number of the UK registered fishing fleet is in Dutch economic ownership; landings by these vessels contribute to the large quantities of fish landed into the Netherlands.
12. Landings into UK ports by foreign vessels
Figure 2.19: Quantity of landings in UK ports by foreign vessels in 2022.
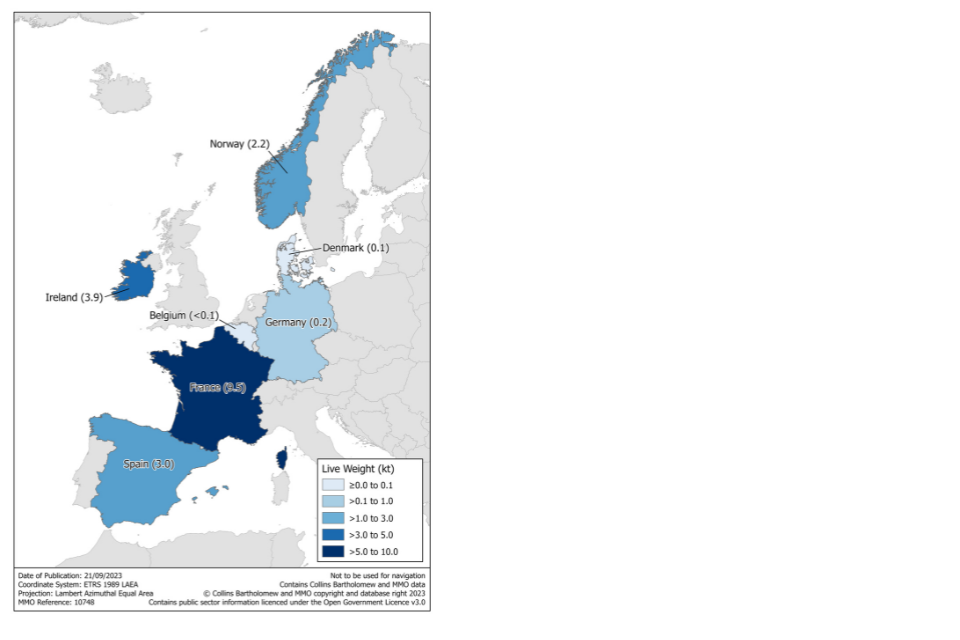
In 2022, 19 thousand tonnes of fish were landed into the UK by foreign vessels, down 4% on 2021. The average change in landings between 2017 – 2019 was only 1% however from 2019 to 2020 there was a 25% decrease. This decrease continued (although not as sharply) between 2020 and 2022 likely be caused by continued reduced access for foreign vessels into UK waters following EU exit.
Close to 67% (13 thousand tonnes) of fish landed into the UK by foreign vessels were demersal. Most of the remainder was pelagic landings (6 thousand tonnes) and a small amount of shellfish, less than one thousand tonnes.
13. Area of capture
Figure 2.20: Quantity of landings by area of capture and species group in 2022.
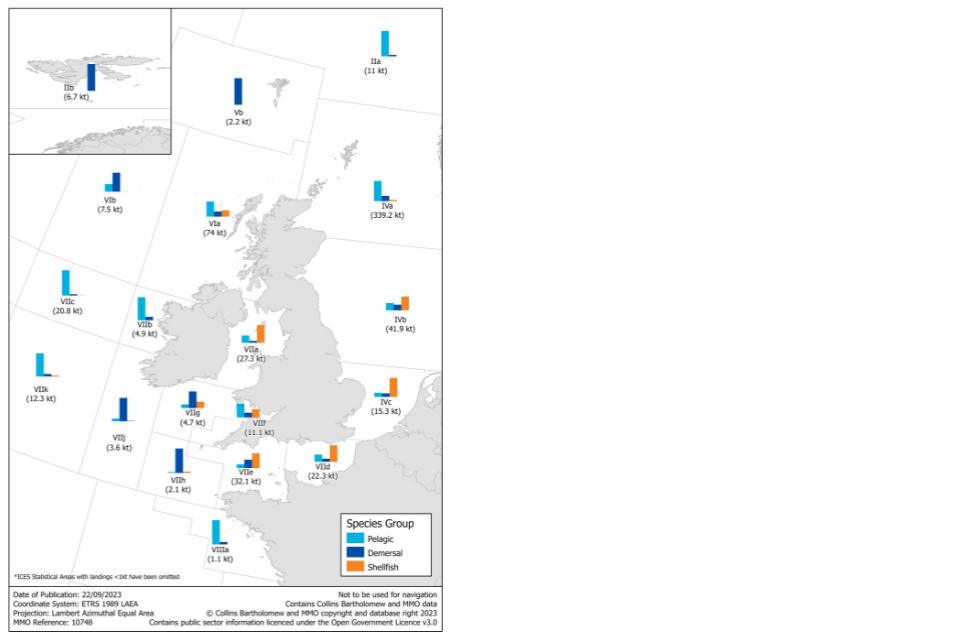
Different sea areas yield different proportions of species.
-
50% (67 thousand tonnes) of the demersal fish landed by the UK fleet was from the Northern North Sea in 2022.
-
67% (256 thousand tonnes) of pelagic fish landed by the UK fleet was from the Northern North Sea in 2022.
-
26% (32 thousand tonnes) of shellfish landed by the UK fleet is from the English Channel.
Typically, shellfish landings form a high proportion of landings from enclosed sea areas with large coastal stretches (Irish Sea, Bristol Channel, English Channel and the Southern North Sea), while pelagic species form the majority of landings from open waters such as the West of Scotland, Northern North Sea, West of Ireland and Porcupine Bank.
14. Landings by Exclusive Economic Zone
Exclusive Economic Zone
The term Exclusive Economic Zone is taken to mean the entire zone under the exclusive jurisdiction of a coastal state or international organisation. This will include the territorial seas which spans 0-12 nautical miles from the coast as well as the UNCLOS Exclusive Economic Zone from 12 up to 200 nautical miles (or roughly 22 to 370 kilometres) from the coast. Where EEZs would overlap a median line is used to delineate the sovereignty of waters.
ICES Statistical Rectangles
The International Council for the Exploration of the Sea (ICES) has implemented spatial divisions of the sea for statistical analysis in major fishing area 27. ICES rectangles are the lowest broadly available unit of spatial reporting for this area. Each rectangle is 0.5 degrees latitude by 1 degree longitude.
From 2021 vessels were required to report fishing activity by EEZ, differentiating between UK and EU waters. From this date the EEZ of capture will be determined by using the landings data as reported in vessel logbooks. Landings data by EEZ published prior to 2021 is based on the estimated EEZ by ICES rectangle spatial apportioning, therefore caution is advised when assessing differences with years before this date due to the alternative methodology used. This is however the most reliable data available to the MMO to determine EEZ for UK fishing vessel activity prior to 2021.
Figure 2.21: The UK’s Exclusive Economic Zone.
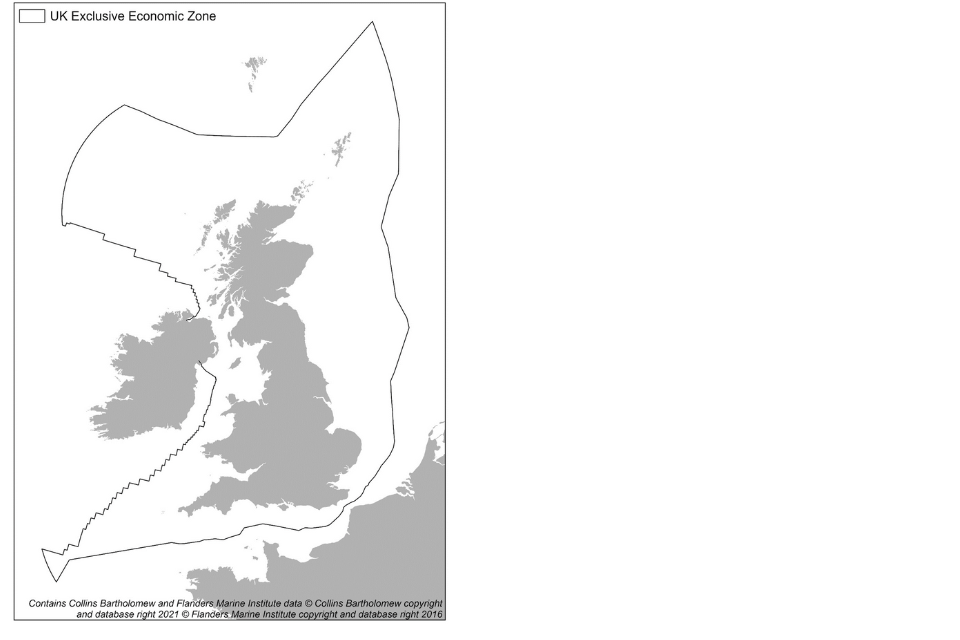
Figure 2.22: Quantity of landings caught by UK vessels in 2022 by waters.
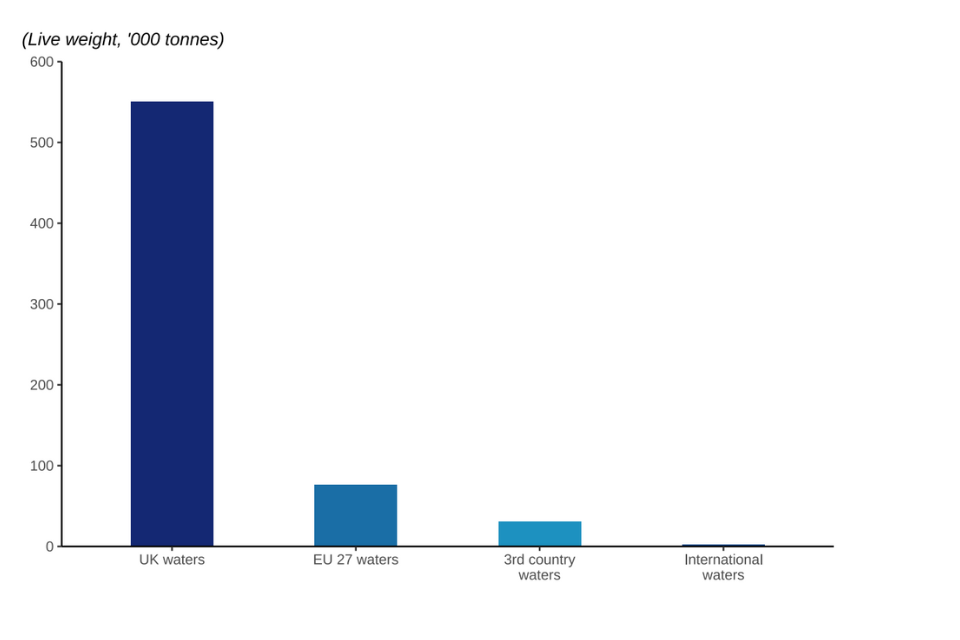
Figure 2.23: Value of landings caught by UK vessels in 2022 by waters.
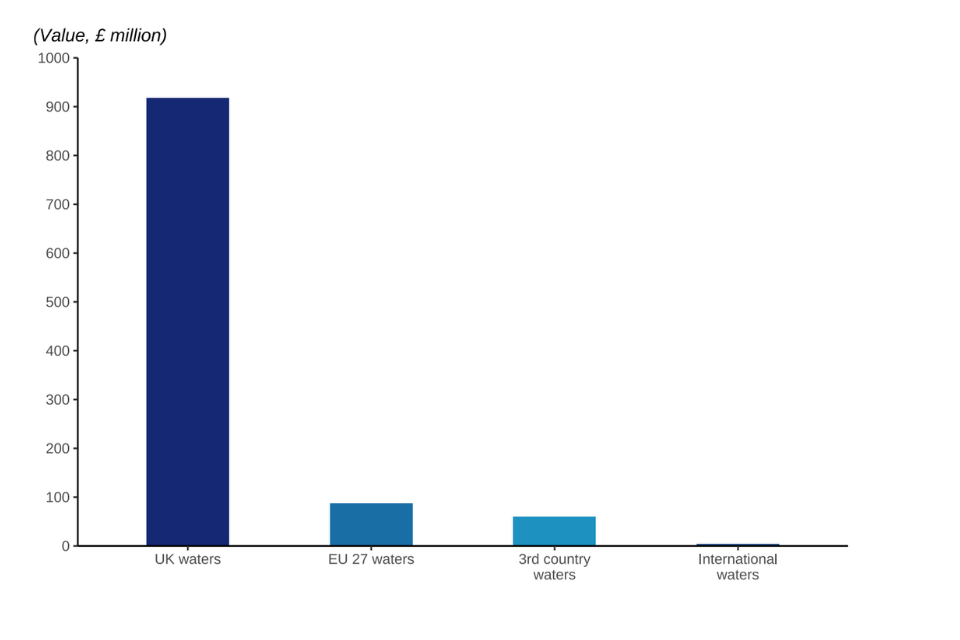
In 2022, 84% of landings and 86% of the value of landings by UK vessels were from UK waters.
Outside the UK’s waters the most important coastal state or bloc was EU-27 waters, where UK vessels caught and landed 74 thousand tonnes of fish and shellfish for a value of £84 million in 2022. This equates to 11% by weight and 8% by value of the UK fleet’s landings.
Figure 2.24: Percentage of species group landed by UK vessels caught from both UK and non-UK waters in 2022.
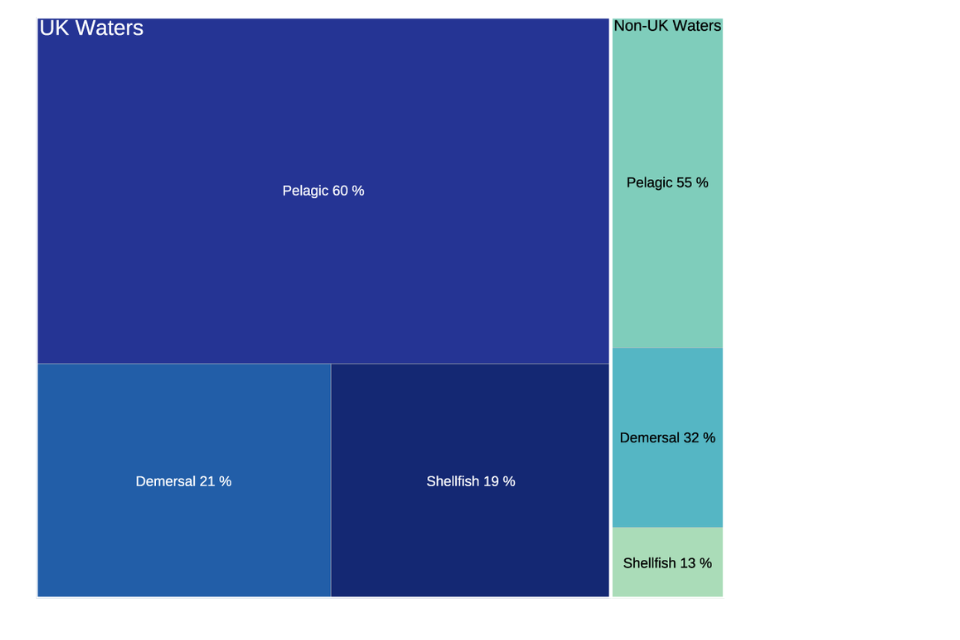
Pelagic species made up the majority of landings caught from both UK and non-UK waters in 2022. UK vessels landed a total of around 540 thousand tonnes of fish and shellfish from UK waters with a first sale value of approximately £900 million. By tonnage 62% of this was from UK waters of area 27.4.a (Northern North Sea); mackerel and herring made up 77% of those UK in UK Northern North Sea landings.
15. Fishing gear
Gear
Different types of fishing gear are used to catch different species of fish. A single vessel can use several gears, or individual vessels may be more specialised. Gears can be grouped several ways. One grouping is active versus passive. Active gears follow the target fish while target fish come to passive gears which remain in one place.
Active gears
-
Beam trawlers target fish on the seabed by towing a net from either side of the boat.
-
Demersal trawlers fish along or just above the seafloor to catch demersal fish. A funnel-shaped net is towed behind one or two boats.
-
Dredges are rigid structures that are towed along the seabed by a boat. They are used to target shellfish species such as scallops and oysters.
-
Seine netting uses a net that is vertical in the water. Demersal seines target bottom dwelling fish while pelagic seines target fish that inhabit the water column.
Passive gears
-
Drift and fixed nets usually target pelagic fish and hang in the water column. They are suspended from buoys or the seabed.
-
Gears using hooks attract fish by placing bait on a hook fixed to the end of e.g. a line.
-
Pots and traps are rigid structures into which fish, mainly shellfish, are enticed through funnels that are hard to escape from.
Most (88% in 2022) of fish landed by UK vessels was captured using active gears. 96% of pelagic fish were caught using active gears and 91% of demersal fish[footnote 11]. 62% of all shellfish were caught using active gears, mainly by scallop dredges and otter trawls.
The type of gear used can make a difference to the average price of fish. For demersal species, the average price of fish captured using passive gears is higher than for active gears. Price differentials are also observed between different gears of the same class. For example, shellfish caught using demersal trawls and seines are sold at a higher average price than dredges. This variation in prices partly reflects the different species caught by different gears. For example, demersal trawls and seines capture the majority of the nephrops landed by the UK fleet, while the bulk of the landings from dredges are scallops, which sell at a lower average price[footnote 12]. However, there can also be a premium attached to the method by which the fish are captured. This is driven partly by consumer choice around the environmental impact of different gears.
16. Landings by quota and non-quota stocks
Quota and non-quota stocks
Landings of quota stocks are those fish which are managed via quota limits, i.e. there is an upper limit set on the amount of fish that can be harvested from the sea. Non-quota stocks do not have an upper limit set on the quantity of fish that can be caught but some are managed via different regimes, e.g. effort limits on days at sea.
Non-quota species include almost all commercial shellfish species, nephrops being the exception.
In 2022, landings of quota species make up 83% of the total quantity of landings by the UK fleet and 71% of the value.
Figure 2.25: Quantity of landings by UK vessels of non-quota and quota species in 2022 by fisheries administration.
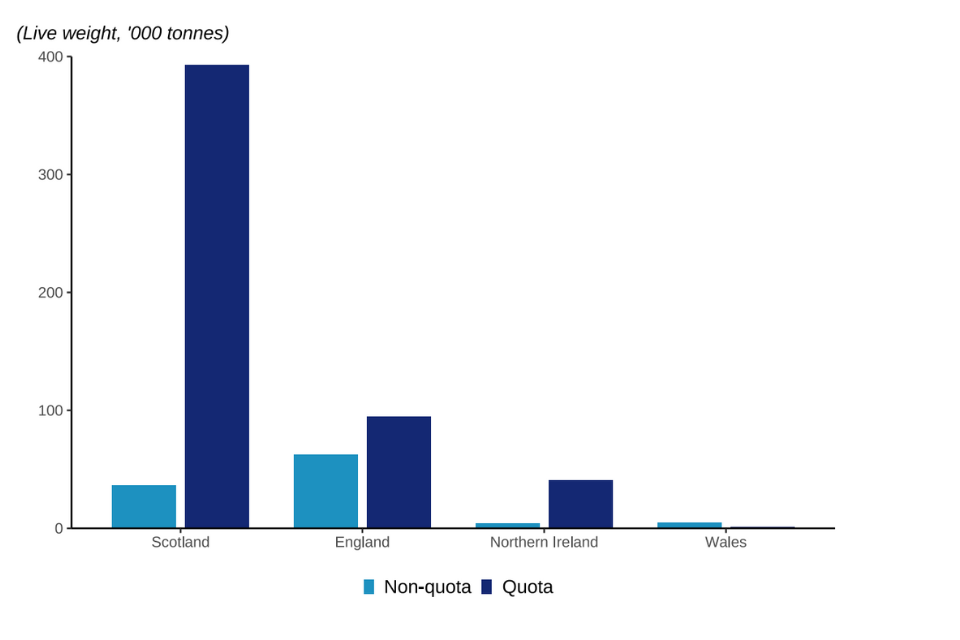
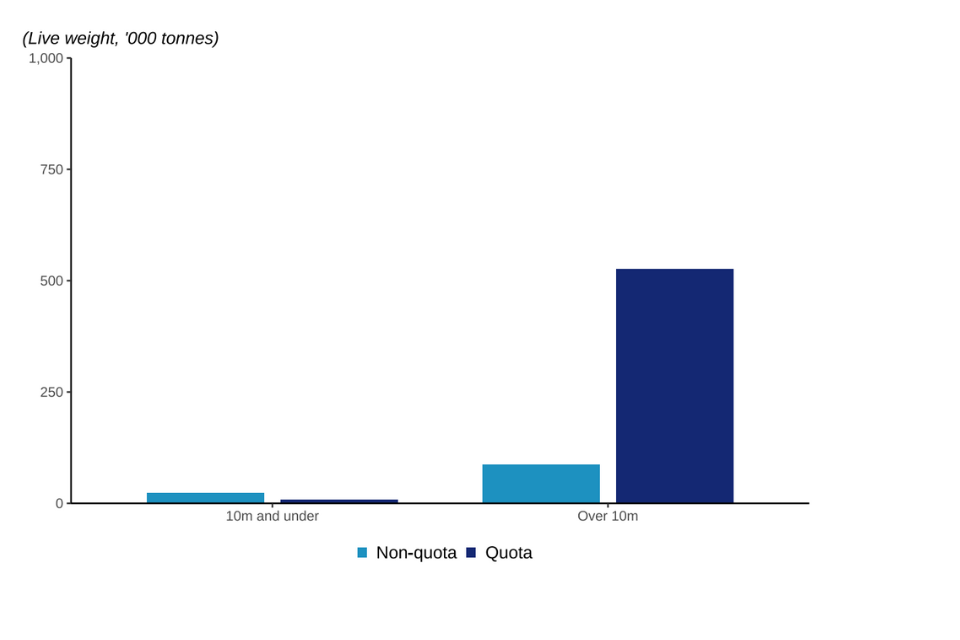
Figure 2.26: Quantity of landings by UK vessels of non-quota and quota species in 2022 by 10m and under and over 10m vessels.
Quota allocations and management
Quota is allocated to the sector (Fish Producer Organisations) and the non-sector. The non-sector is split into two categories based on vessel length – over 10 metre and 10 metre and under.
Each UK nation holds the quota and manages uptake via catch limits for the non-sector. For the sector, individual Fish Producer Organisations are responsible for managing their members quota.
Scottish vessels landed 74% of UK landings of quota species in 2022.
Landings of non-quota species by under 10m vessels were 3 times higher than their landings of quota species. Conversely, landings of quota species by over 10m vessels were almost 6 times higher than their landings of non-quota species. Vessels over 10m in length landed 98% of the landings of quota species by UK vessels.
Quota allocations are primarily based on Fixed Quota Allocation (FQA) units. These are mainly held by vessels in the sector based on their fishing track record of catching quota species. Most vessels in the sector – a member of a Fish Producer Organisation – are vessels over 10m in length. Vessels under 10m in length are mainly part of the non-sector and are allocated a small proportion of the total UK quota. Their landings of quota species are therefore less.
-
In this section, tonnes always refer to live weight tonnes. This is the sum of the live weight of fish caught, prior to any processing e.g. gutting or shelling. ↩
-
Table 2.1 ↩
-
Table 2.9 ↩
-
Table 2.16 ↩
-
Table 2.7 – note this table includes landings into the UK by UK and foreign vessels. ↩
-
Table 2.16 ↩
-
https://www.gov.uk/government/publications/manage-your-fishing-effort-sole-recovery-zone/sole-recovery-zone-rules ↩
-
The very high value per tonne records included here are landings of wrasse species, commonly referred to as “cleaner fish”. These are sold for their use in fish farms. ↩
-
Table 2.11 ↩
-
Table 2.16 ↩