UK Public Survey of Risk Perception, Resilience and Preparedness 2026: Headline Findings (HTML)
Published 19 August 2026

© Crown copyright 2026
This publication is licensed under the terms of the Open Government Licence v3.0 except where otherwise stated. To view this licence, visit nationalarchives.gov.uk/doc/open-government-licence/version/3 or write to the Information Policy Team, The National Archives, Kew, London TW9 4DU, or email: psi@nationalarchives.gov.uk.
Where we have identified any third party copyright information you will need to obtain permission from the copyright holders concerned.
This publication is available at https://www.gov.uk/government/statistics/uk-public-survey-of-risk-perception-resilience-and-preparedness-2026/uk-public-survey-of-risk-perception-resilience-and-preparedness-2026-headline-findings-html
Contact
General enquiries: preparedness.survey@cabinetoffice.gov.uk
Media enquiries: Cabinet Office Press office
User feedback survey: Smart Survey
Introduction
The UK Public Survey of Risk Perception, Resilience and Preparedness is a nationally representative survey of adults in the UK, carried out in order to understand what people think about different types of emergencies, and what steps – if any – they have taken to prepare for them. It is conducted to inform public communications on preparing for emergencies and to monitor trends. These are the headline findings from the second survey, conducted in 2026.
The 2026 survey was funded by the Cabinet Office and the Department for Environment, Food and Rural Affairs (Defra). The Behavioural Science and Insights Unit at the UK Health Security Agency assisted with survey design and quality assurance.
This publication provides the headline findings from the 2026 survey, which ran between 27 February and 11 May 2026. The core survey sample size was 10,791, with an additional 936 respondents recruited as part of an additional boost to ensure a minimum number of respondents in each Local Resilience Forum area in England. The results below use only the core survey sample so that results can be compared to those from the 2025 survey. The sample size for the 2025 survey was 10,536.
Throughout this report we refer to emergencies and disasters. For the purposes of this survey, emergency/disaster was defined as ‘any large-scale incident that could have significant impacts on health, life, property, or environment.’ Respondents were encouraged to think about events that could impact a number of people within an area, rather than an incident occurring to only one individual.
Alongside this publication, readers can access:
- This year’s questionnaire.
- Data tables containing summary statistics for the UK overall, as well as for England, Scotland, Wales and Northern Ireland.
- Data tables that compare the 2026 summary statistics for each region (England, Scotland, Wales and Northern Ireland), with those from 2025.Throughout the report, some charts refer to wave on wave (WoW) tables, which compare statistics from 2025 to 2026.
- Local Resilience Forum data tables containing data from 2026 only, providing indicative findings for each area in England.
- The technical report for this survey.
- Pre-release access list.
The purpose of this data release is to present high-level findings, not detailed statistical analysis of this data. High-level demographic breakdowns can be found in the relevant data tables.
Method overview
The UK Public Survey of Risk Perception, Resilience and Preparedness 2026 was conducted using a sample of 10,791 UK adults (age 18+) recruited from online panels. Recruiting from online panels has many advantages, including efficiency and the reduction of social desirability bias, but also some limitations, as certain demographics are not equally represented on panels as they are in the general UK population.
In order to ensure the sample recruited was as representative as possible of the population in each of the UK’s constituent nations, targets and quotas were set to ensure the characteristics of the sample match those of the adult population in each nation. First, the sample was designed to ensure each constituent nation of the UK had sufficient sample size with the following numbers recruited in the main sample:
- England: 7,082
- Wales: 1,049
- Scotland: 1,578
- Northern Ireland: 1,082
Second, quotas were then applied on each of the following demographics, by nation, to ensure the samples recruited were representative of the relevant population on these metrics:
- Age and gender
- Region
- Ethnicity
- National Statistics Socio-economic Classification (NS-SEC)
- Religion or religion brought up in (Northern Ireland only)[footnote 1]
All percentages presented here have been weighted to be representative of the UK population and then rounded to the nearest whole number. As a result of rounding, the totals of more than one response category added together (e.g. strongly agree and agree) reported in the text above charts may sometimes differ from the sum of their component percentages by +/- 1 percentage point. Unweighted sample sizes are shown in figures and data notes, referred to as ‘n =’.
More information on the sample and weightings can be found in the Technical Report.
At the beginning of the survey, respondents were informed as to the purpose of the data collection. At the end of the survey, they were provided with URL links to both official information on how to prepare for emergencies, and to support services.
Risk perception
Please be aware that all percentages reported below are rounded to the nearest whole number. As these are rounded separately, totals may not add up to 100%, and the sum of multiple categories may differ from the percentages reported in the text above the charts by +/- 1 percentage point.
If you wish to report additional totals that are not included in the text of this report, please use the counts in the data tables. We would advise against doing your own calculations using the percentages in the tables or figures, as due to rounding, the true sum of any two percentages may differ from the total obtained through adding the percentages together.
Anticipated changes to number of emergencies/disasters in the UK
The majority (68%) of survey respondents thought that the number of emergencies/disasters would increase in the next 10 years, with 21% saying the number would increase a lot and 47% saying the number would increase a little.
4% stated that the number of emergencies would decrease and 6% selected that they did not know.
Compared to 2025, there was a small increase in the proportion of respondents who thought emergencies/disasters would increase (68%, up from 66%), with a rise in those saying the number would increase a lot (21%, up from 19%). Conversely, fewer respondents thought the number would stay the same (21%, down from 23%) or decrease (5%, down from 7%).
Figure 1.1: Anticipated changes to the number of emergencies/disasters in the UK in the next 10 years (showing % of respondents) (see UK 2026 table 1 (ODS, 1.15MB))
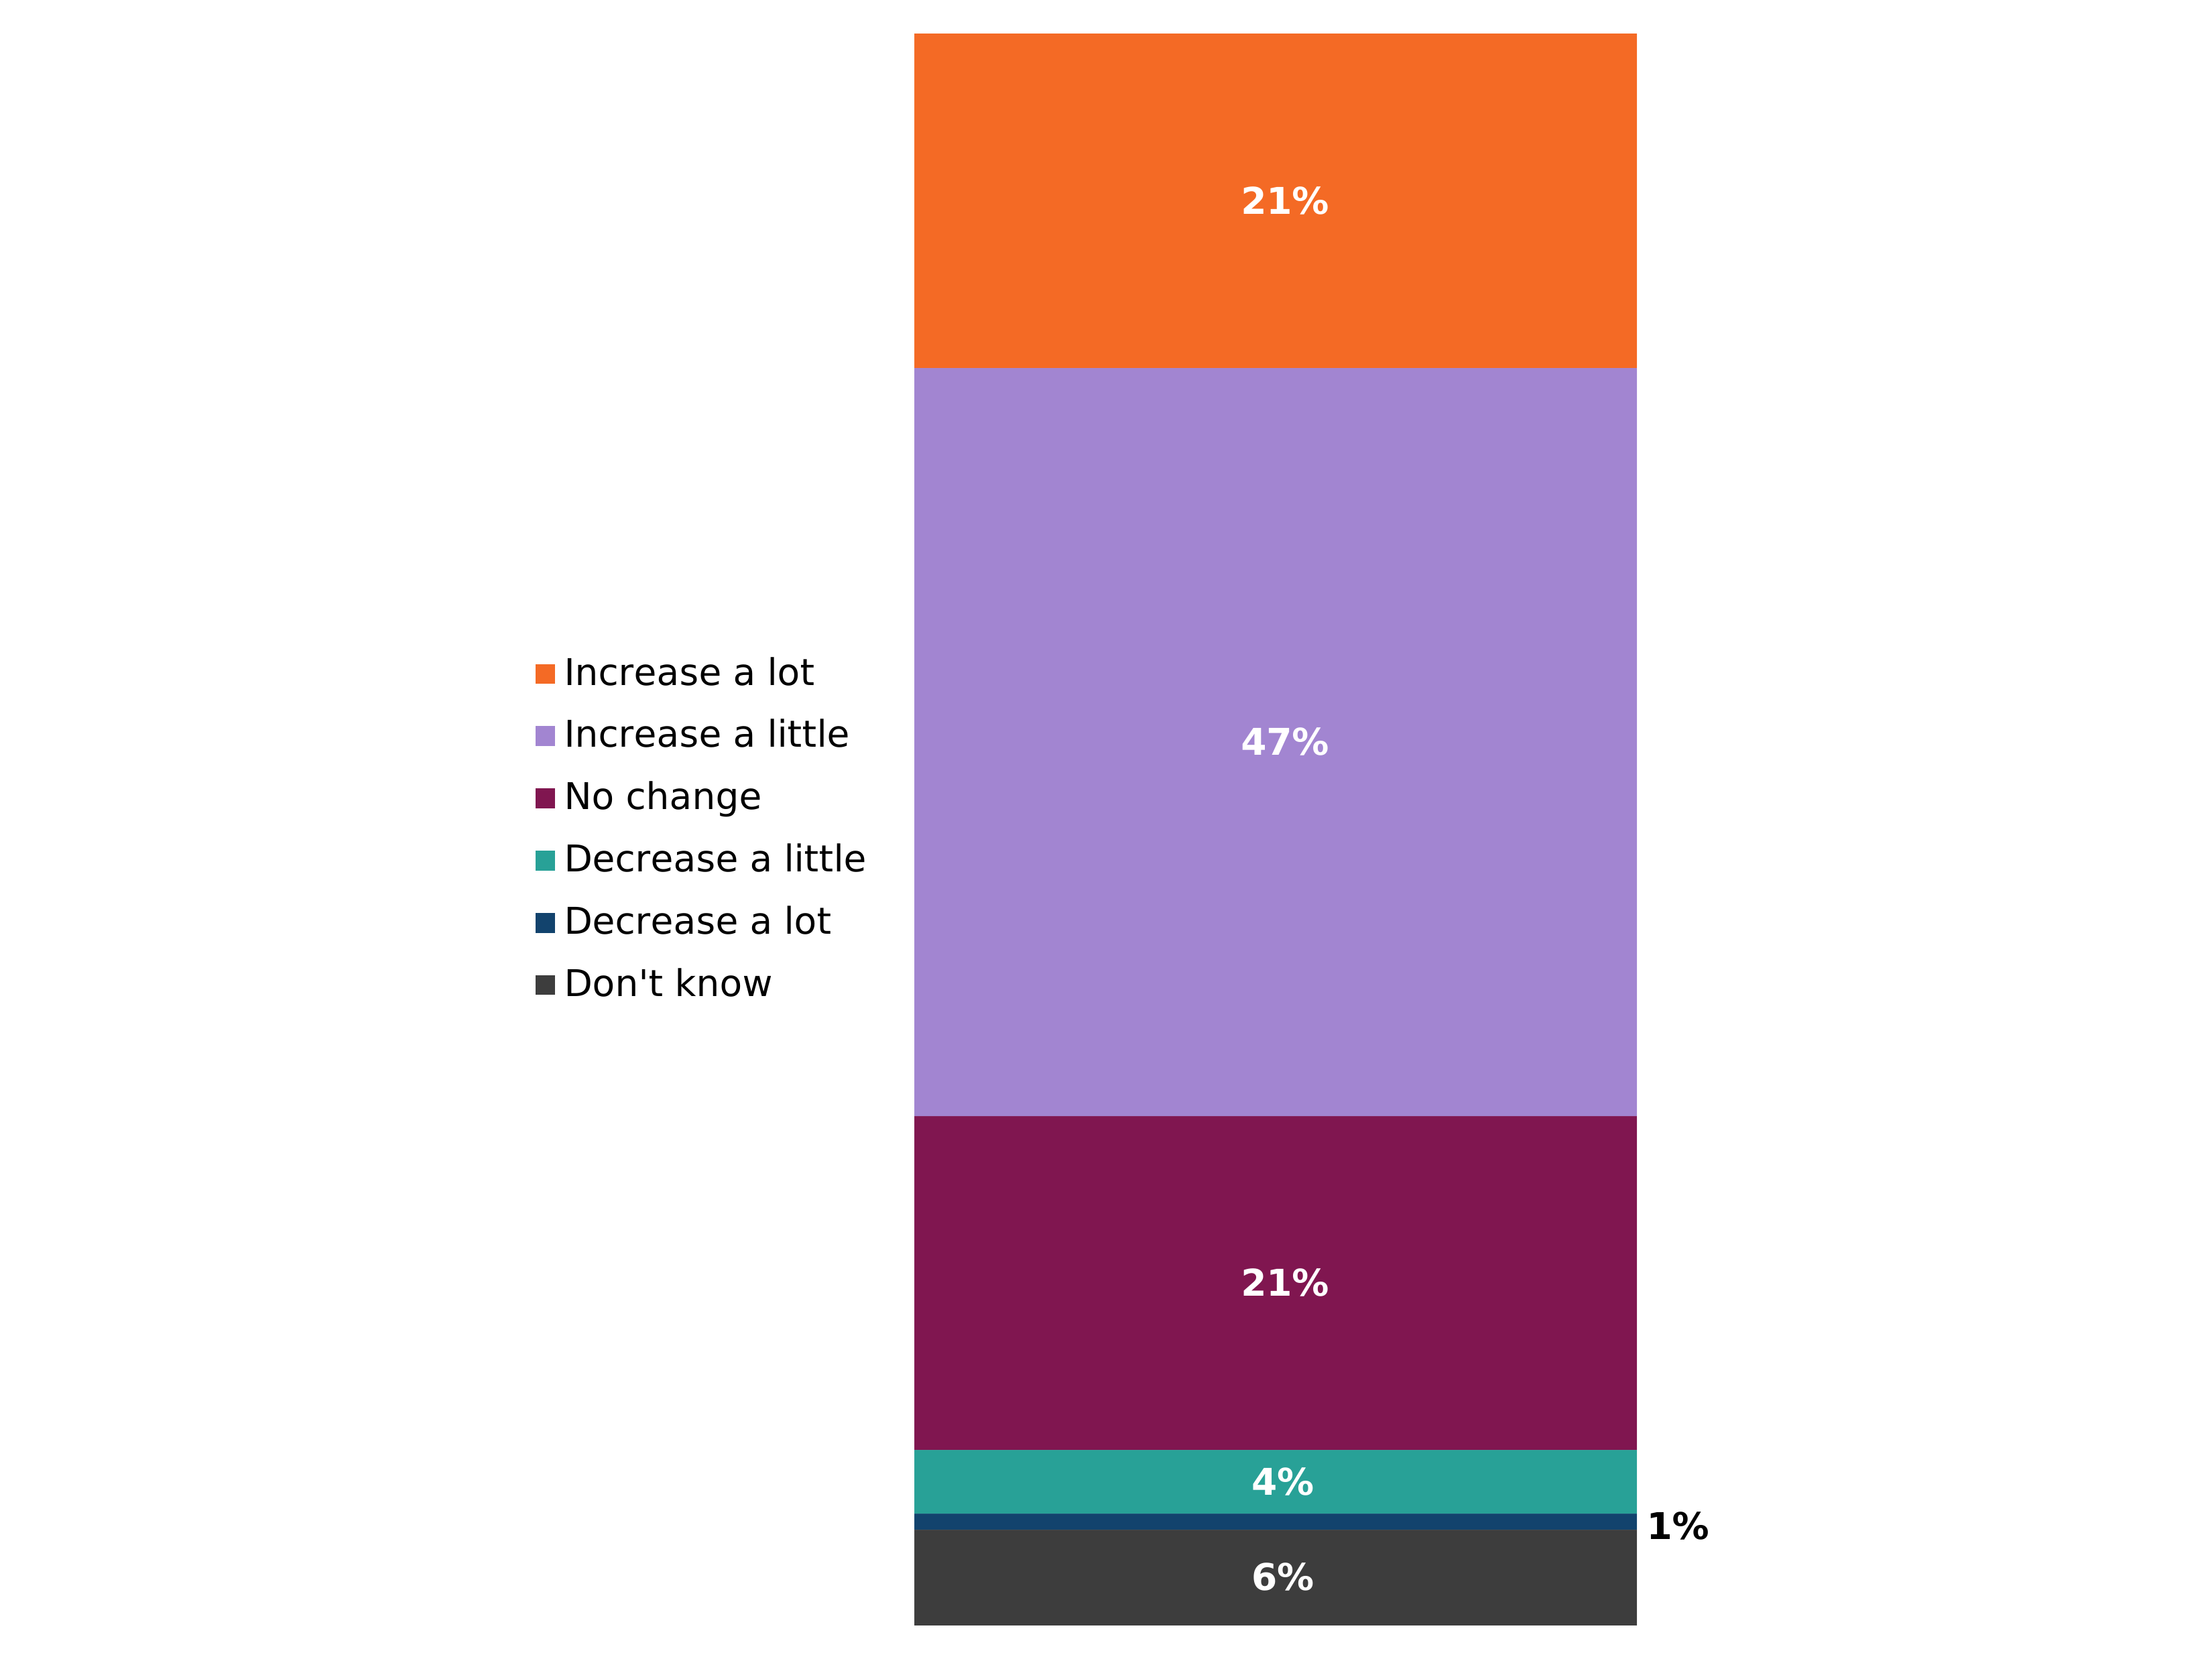
Figure note:
Source: Q1. Do you think the number of emergencies/disasters in the UK will increase or decrease, or stay roughly the same, in the next 10 years?
Base: All respondents in UK sample, 2026 (n=10,791).
Figure 1.2: 2025 to 2026 comparison of anticipated changes to the number of emergencies/disasters in the UK in the next 10 years (showing % of respondents) (see UK WoW table 1 (ODS, 1.65MB))
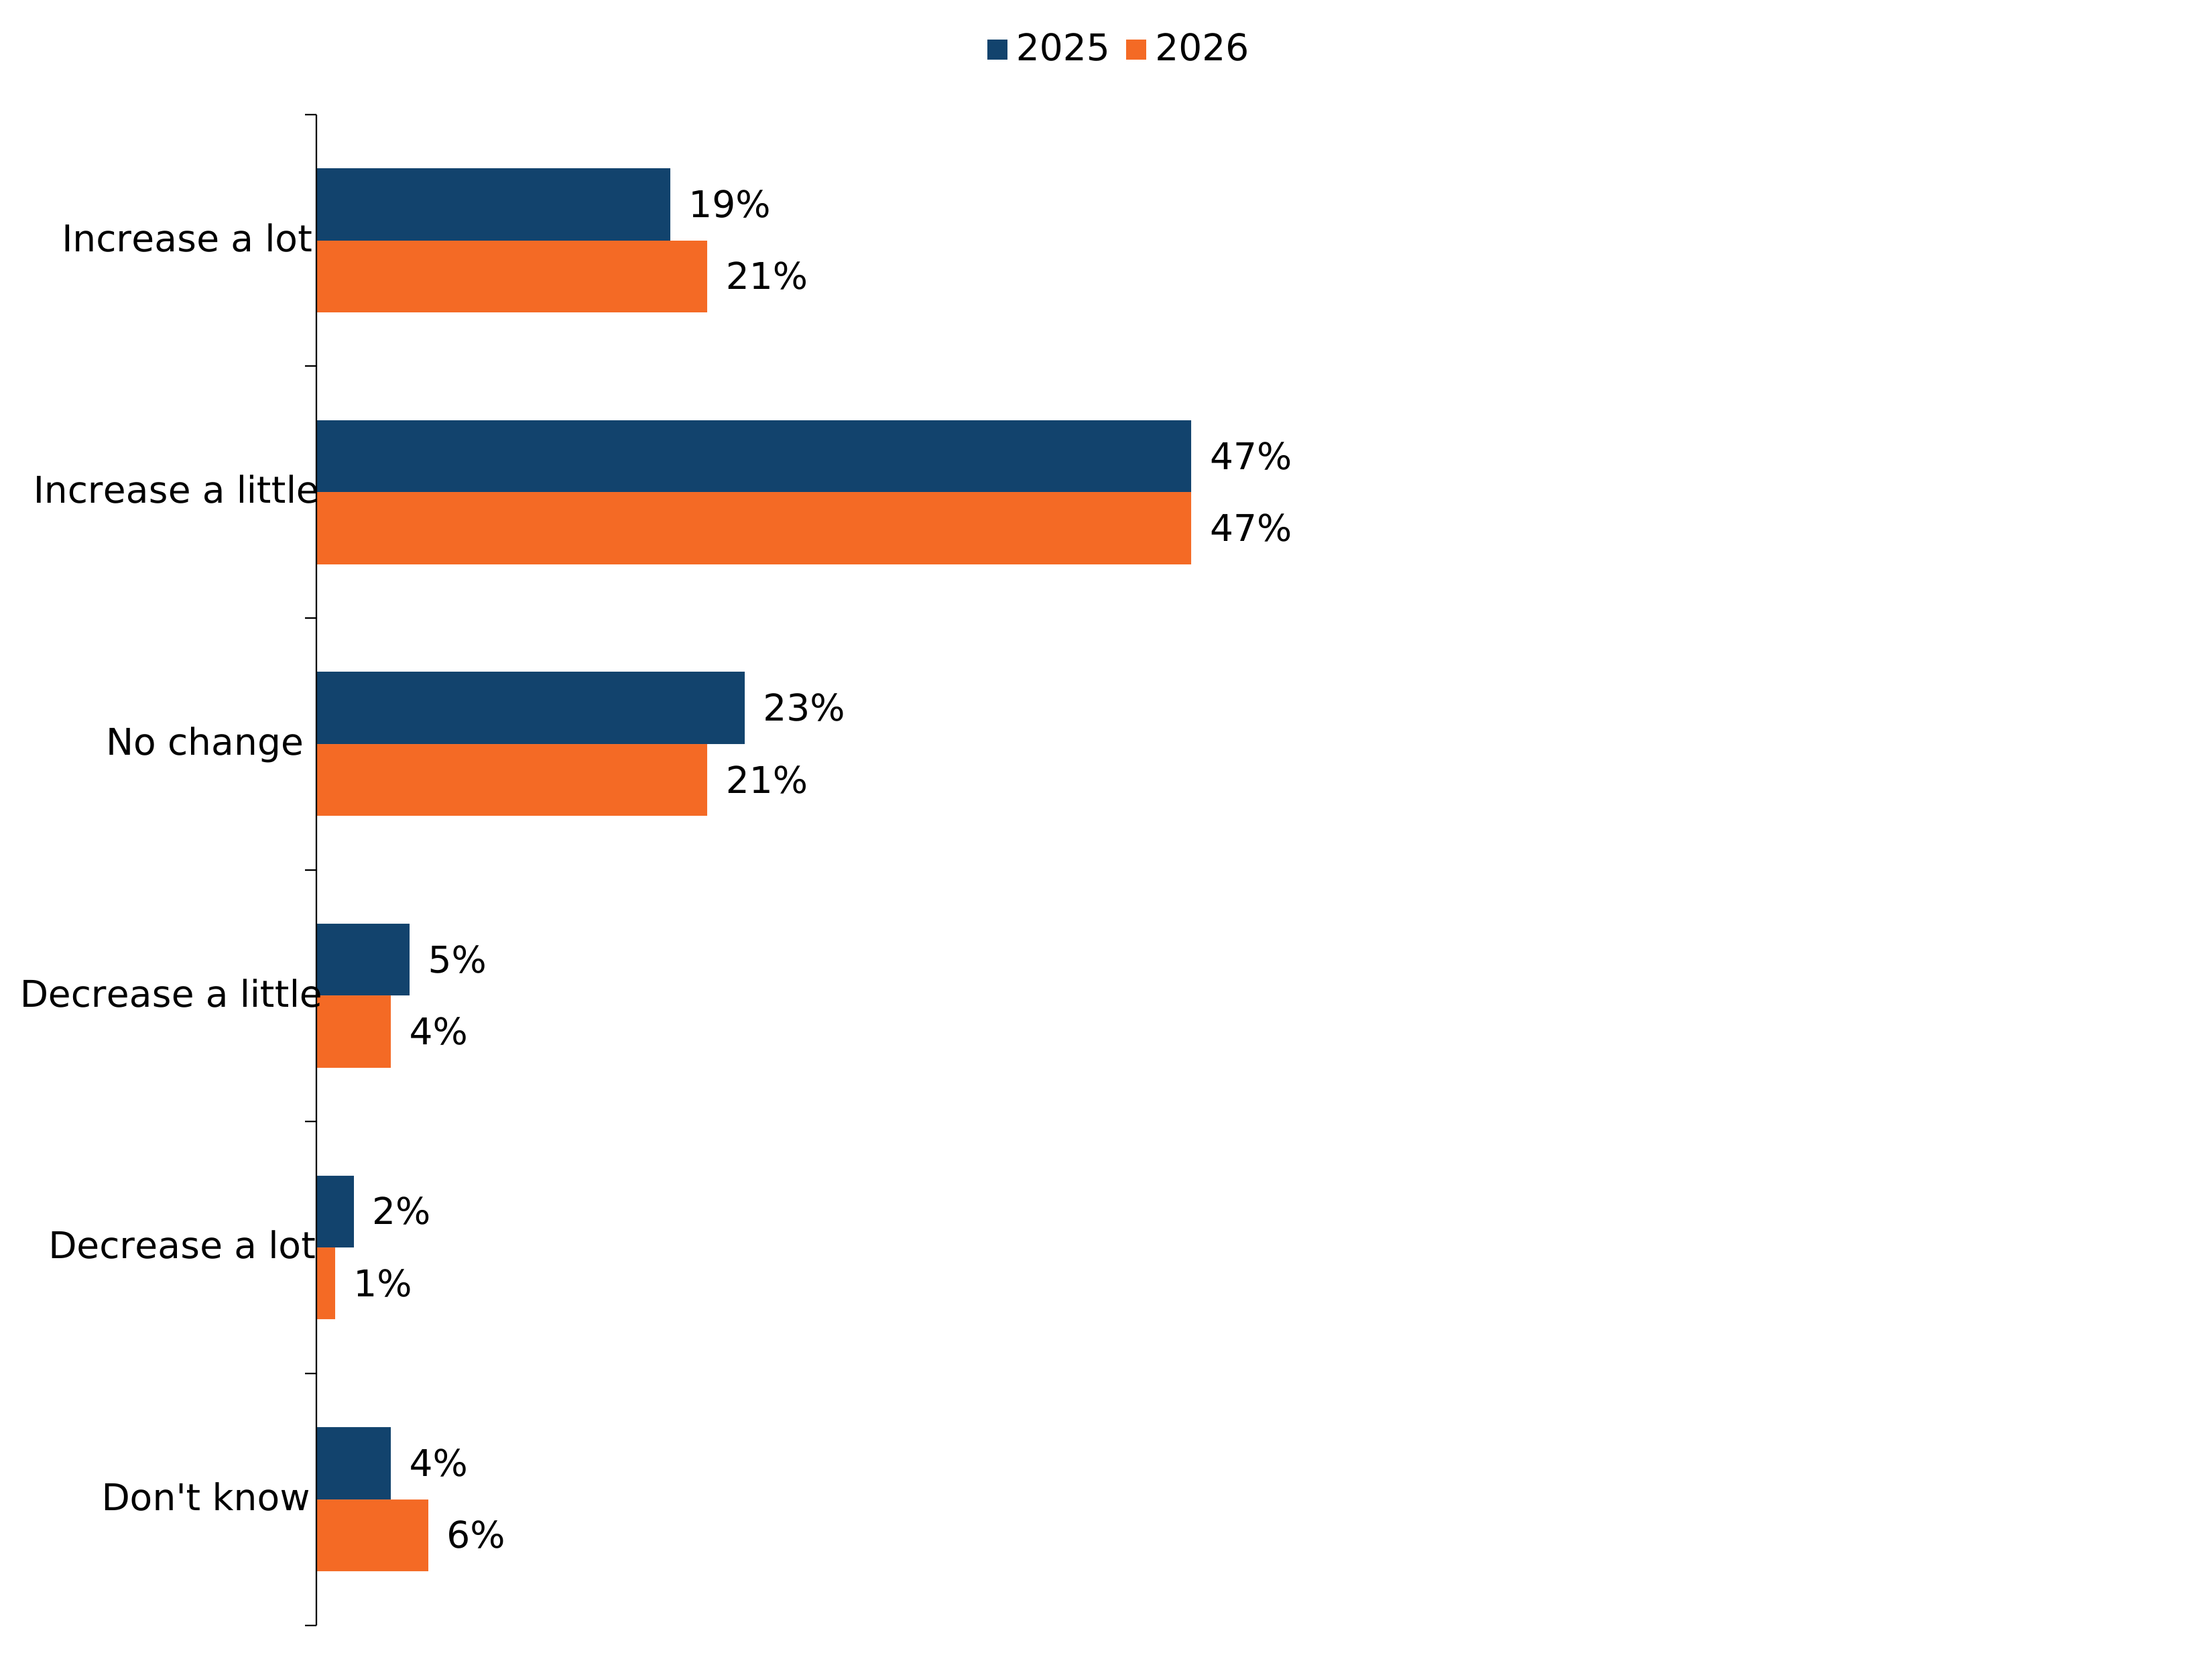
Figure note:
Source: Q1. Do you think the number of emergencies/disasters in the UK will increase or decrease, or stay roughly the same, in the next 10 years?
Data shown are for 2025 (Wave 1) and 2026 (Wave 2).
Base: All respondents in UK sample, 2025 (n=10,536); 2026 (n=10,791).
Perceived likelihood of different types of emergencies/disasters
Approximately half (51%) of survey respondents thought that it was likely or very likely that a storm severe enough to cause disruption to transport or injuries would affect their local area in the next two years. 46% thought their area was likely or very likely to experience extreme cold weather (severe enough to cause health problems / disruption to local transport). This was followed by perceived likelihood of a cyber attack affecting critical infrastructure such as energy, health, transport, finance or communications systems (42%), extreme hot weather (severe enough to cause health problems / disruption to transport) (42%) and disruption to food supply severe enough to cause some empty supermarket shelves (42%). Just over a third (35%) thought it was likely or very likely that a power cut affecting their local area for 3 days or more would happen in the next two years.
Figure 1.3: Perceived likelihood of different types of emergencies/disasters affecting respondents’ local area in the next two years (showing % of respondents) (see UK 2026 table 2 (ODS, 1.15MB))
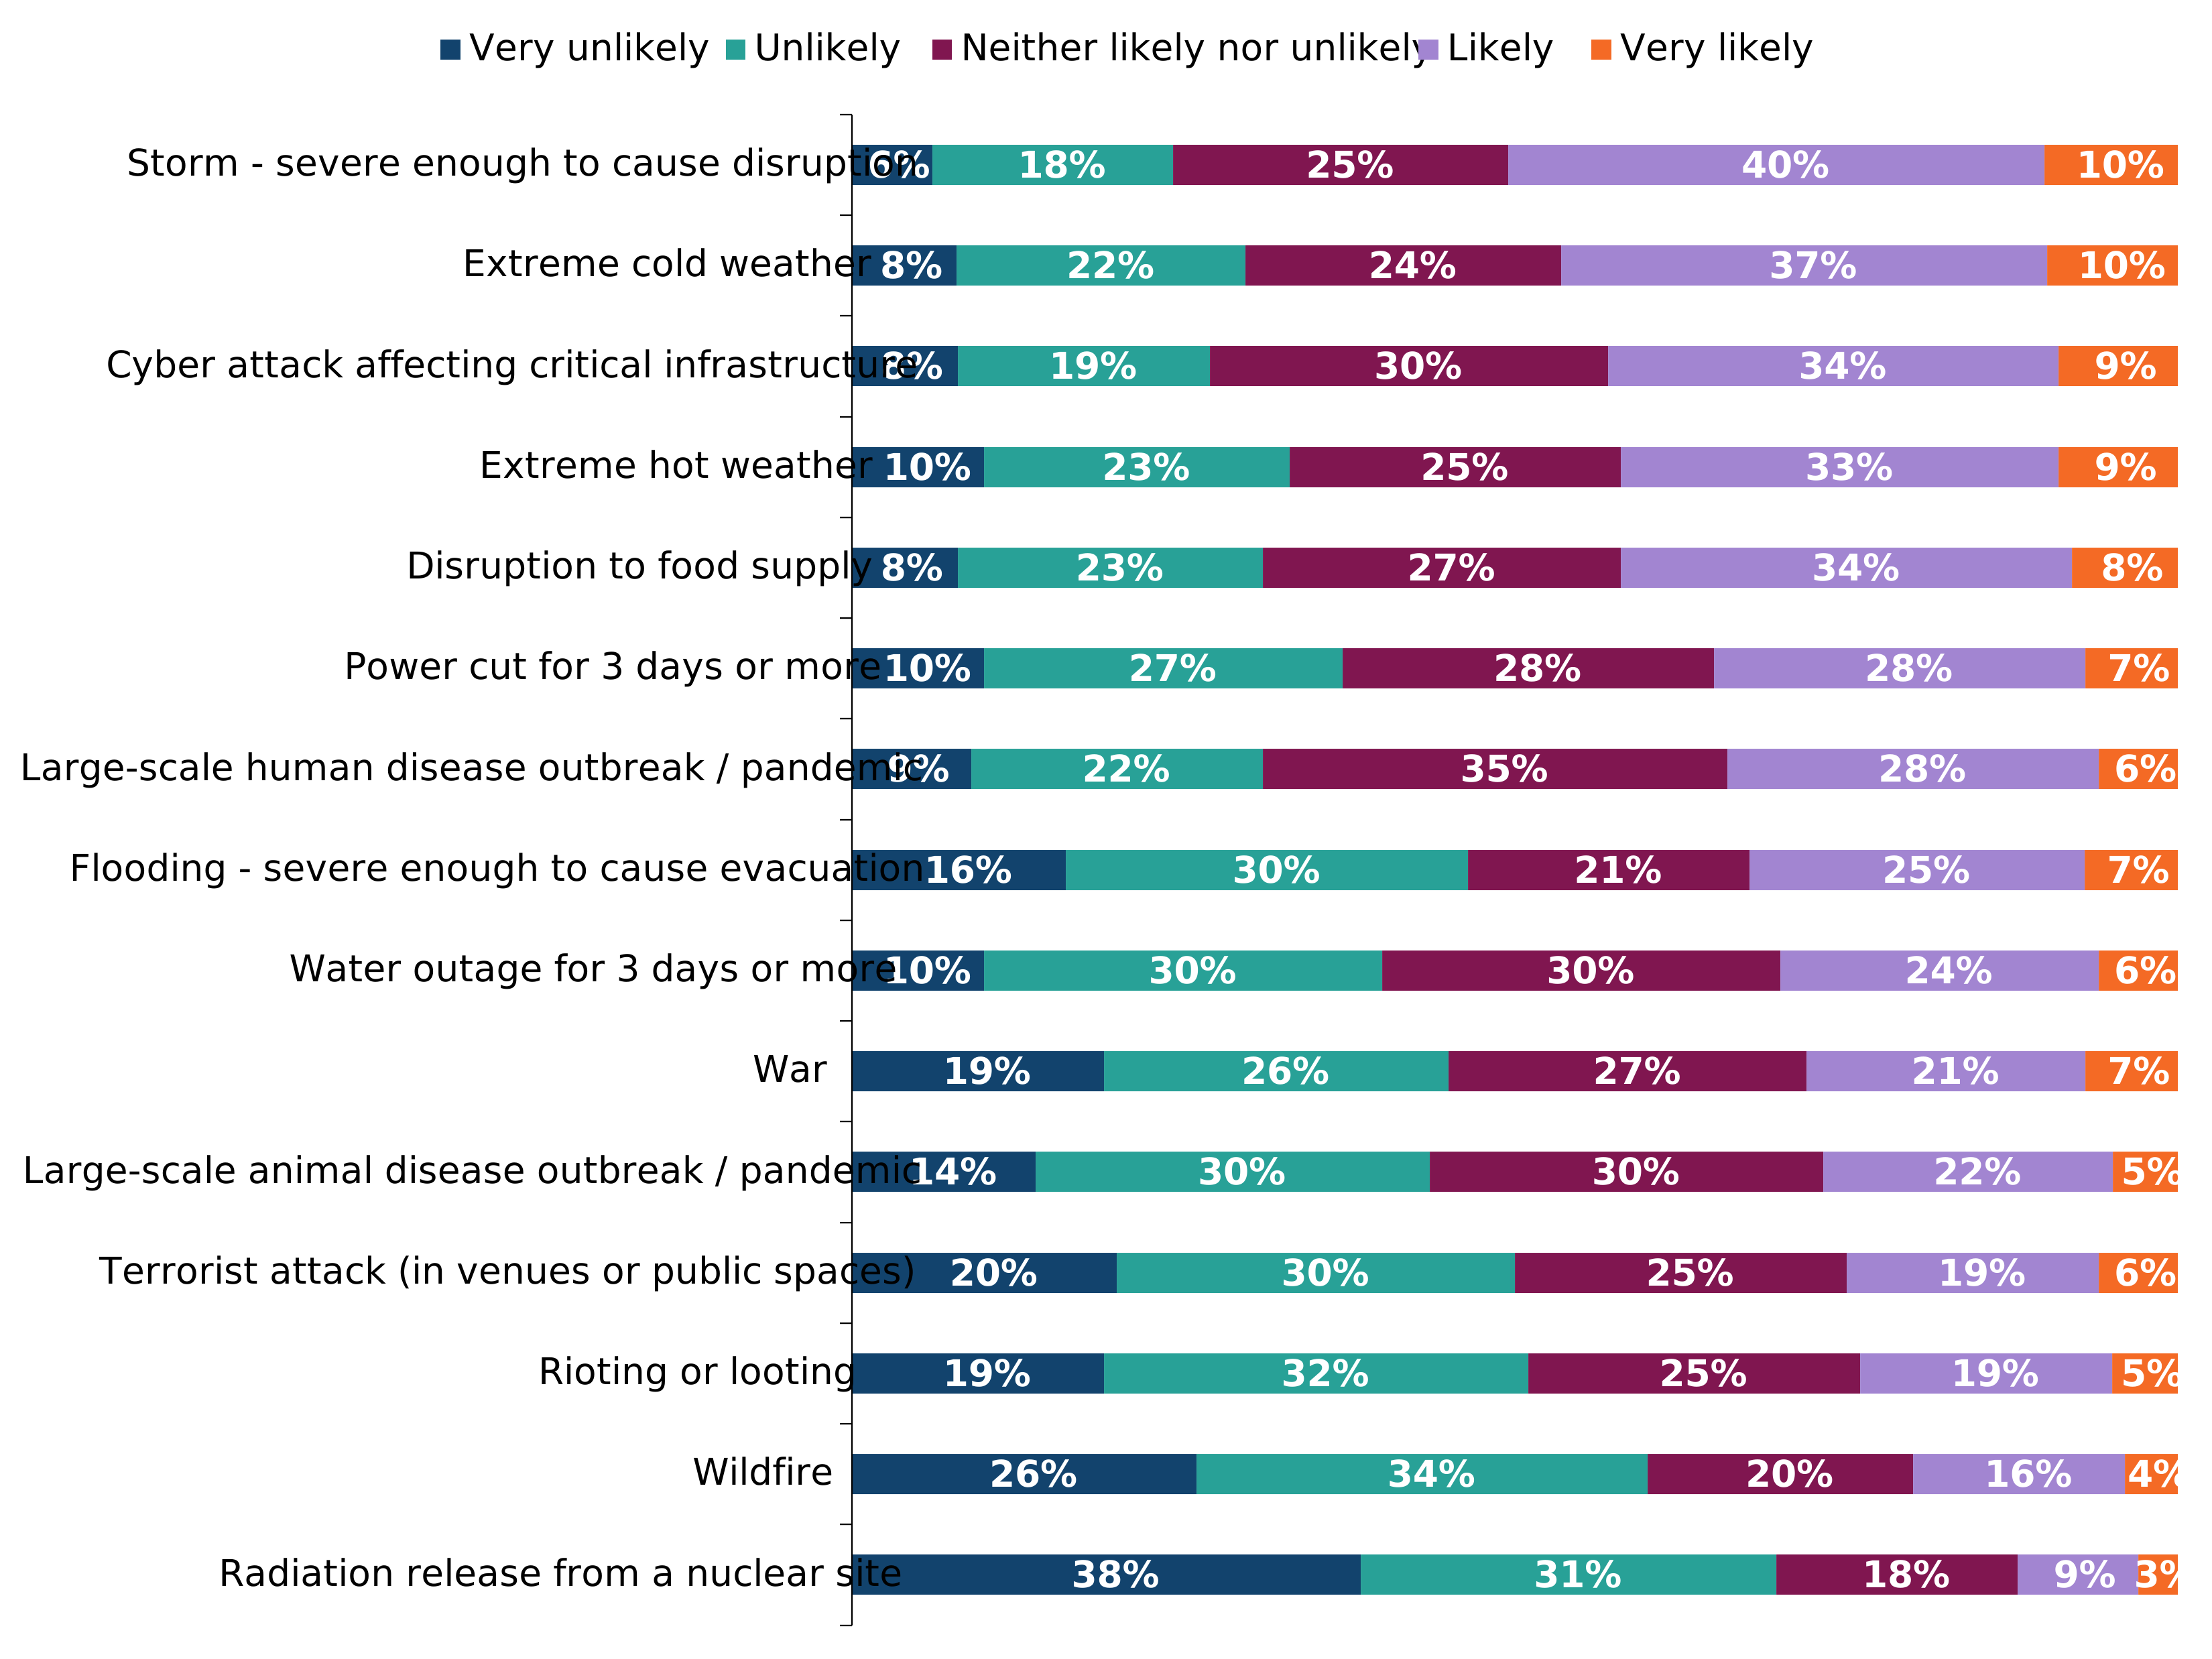
Figure note:
Source: Q2. How likely or unlikely do you think it is that your local area will be affected by the following in the next 2 years?
Statements are ordered from highest to lowest based on the compound figure of likely and very likely.
Base: All respondents in UK sample, 2026 (n=10,791).
Due to rounding, the totals will not always add up to 100%.
Compared to 2025, the perceived likelihood of most emergencies remained broadly stable. The largest increase was seen for war, with more than one in four (28%) respondents in 2026 considering it likely or very likely to affect their local area in the next two years, up from 19% in 2025, a nine percentage point increase. The perceived likelihood of a terrorist attack rose five percentage points (20% to 25%), and a cyber attack affecting critical infrastructure rose by three percentage points (39% to 42%). By contrast, perceived likelihood of a storm severe enough to cause disruption to transport / injuries reduced by four percentage points (55% to 51%), while extreme cold weather severe enough to cause health problems or disruption to transport fell slightly, dropping two percentage points from 48% to 46%. Extreme hot weather and flooding severe enough that people might be asked to evacuate their homes remained unchanged at 42% and 32%, respectively.
Figure 1.4: 2025 to 2026 comparison of perceived likelihood of different types of emergencies/disasters affecting respondents’ local area in the next two years (showing % of respondents who selected likely or very likely) (see UK WoW table 3 (ODS, 1.47MB))
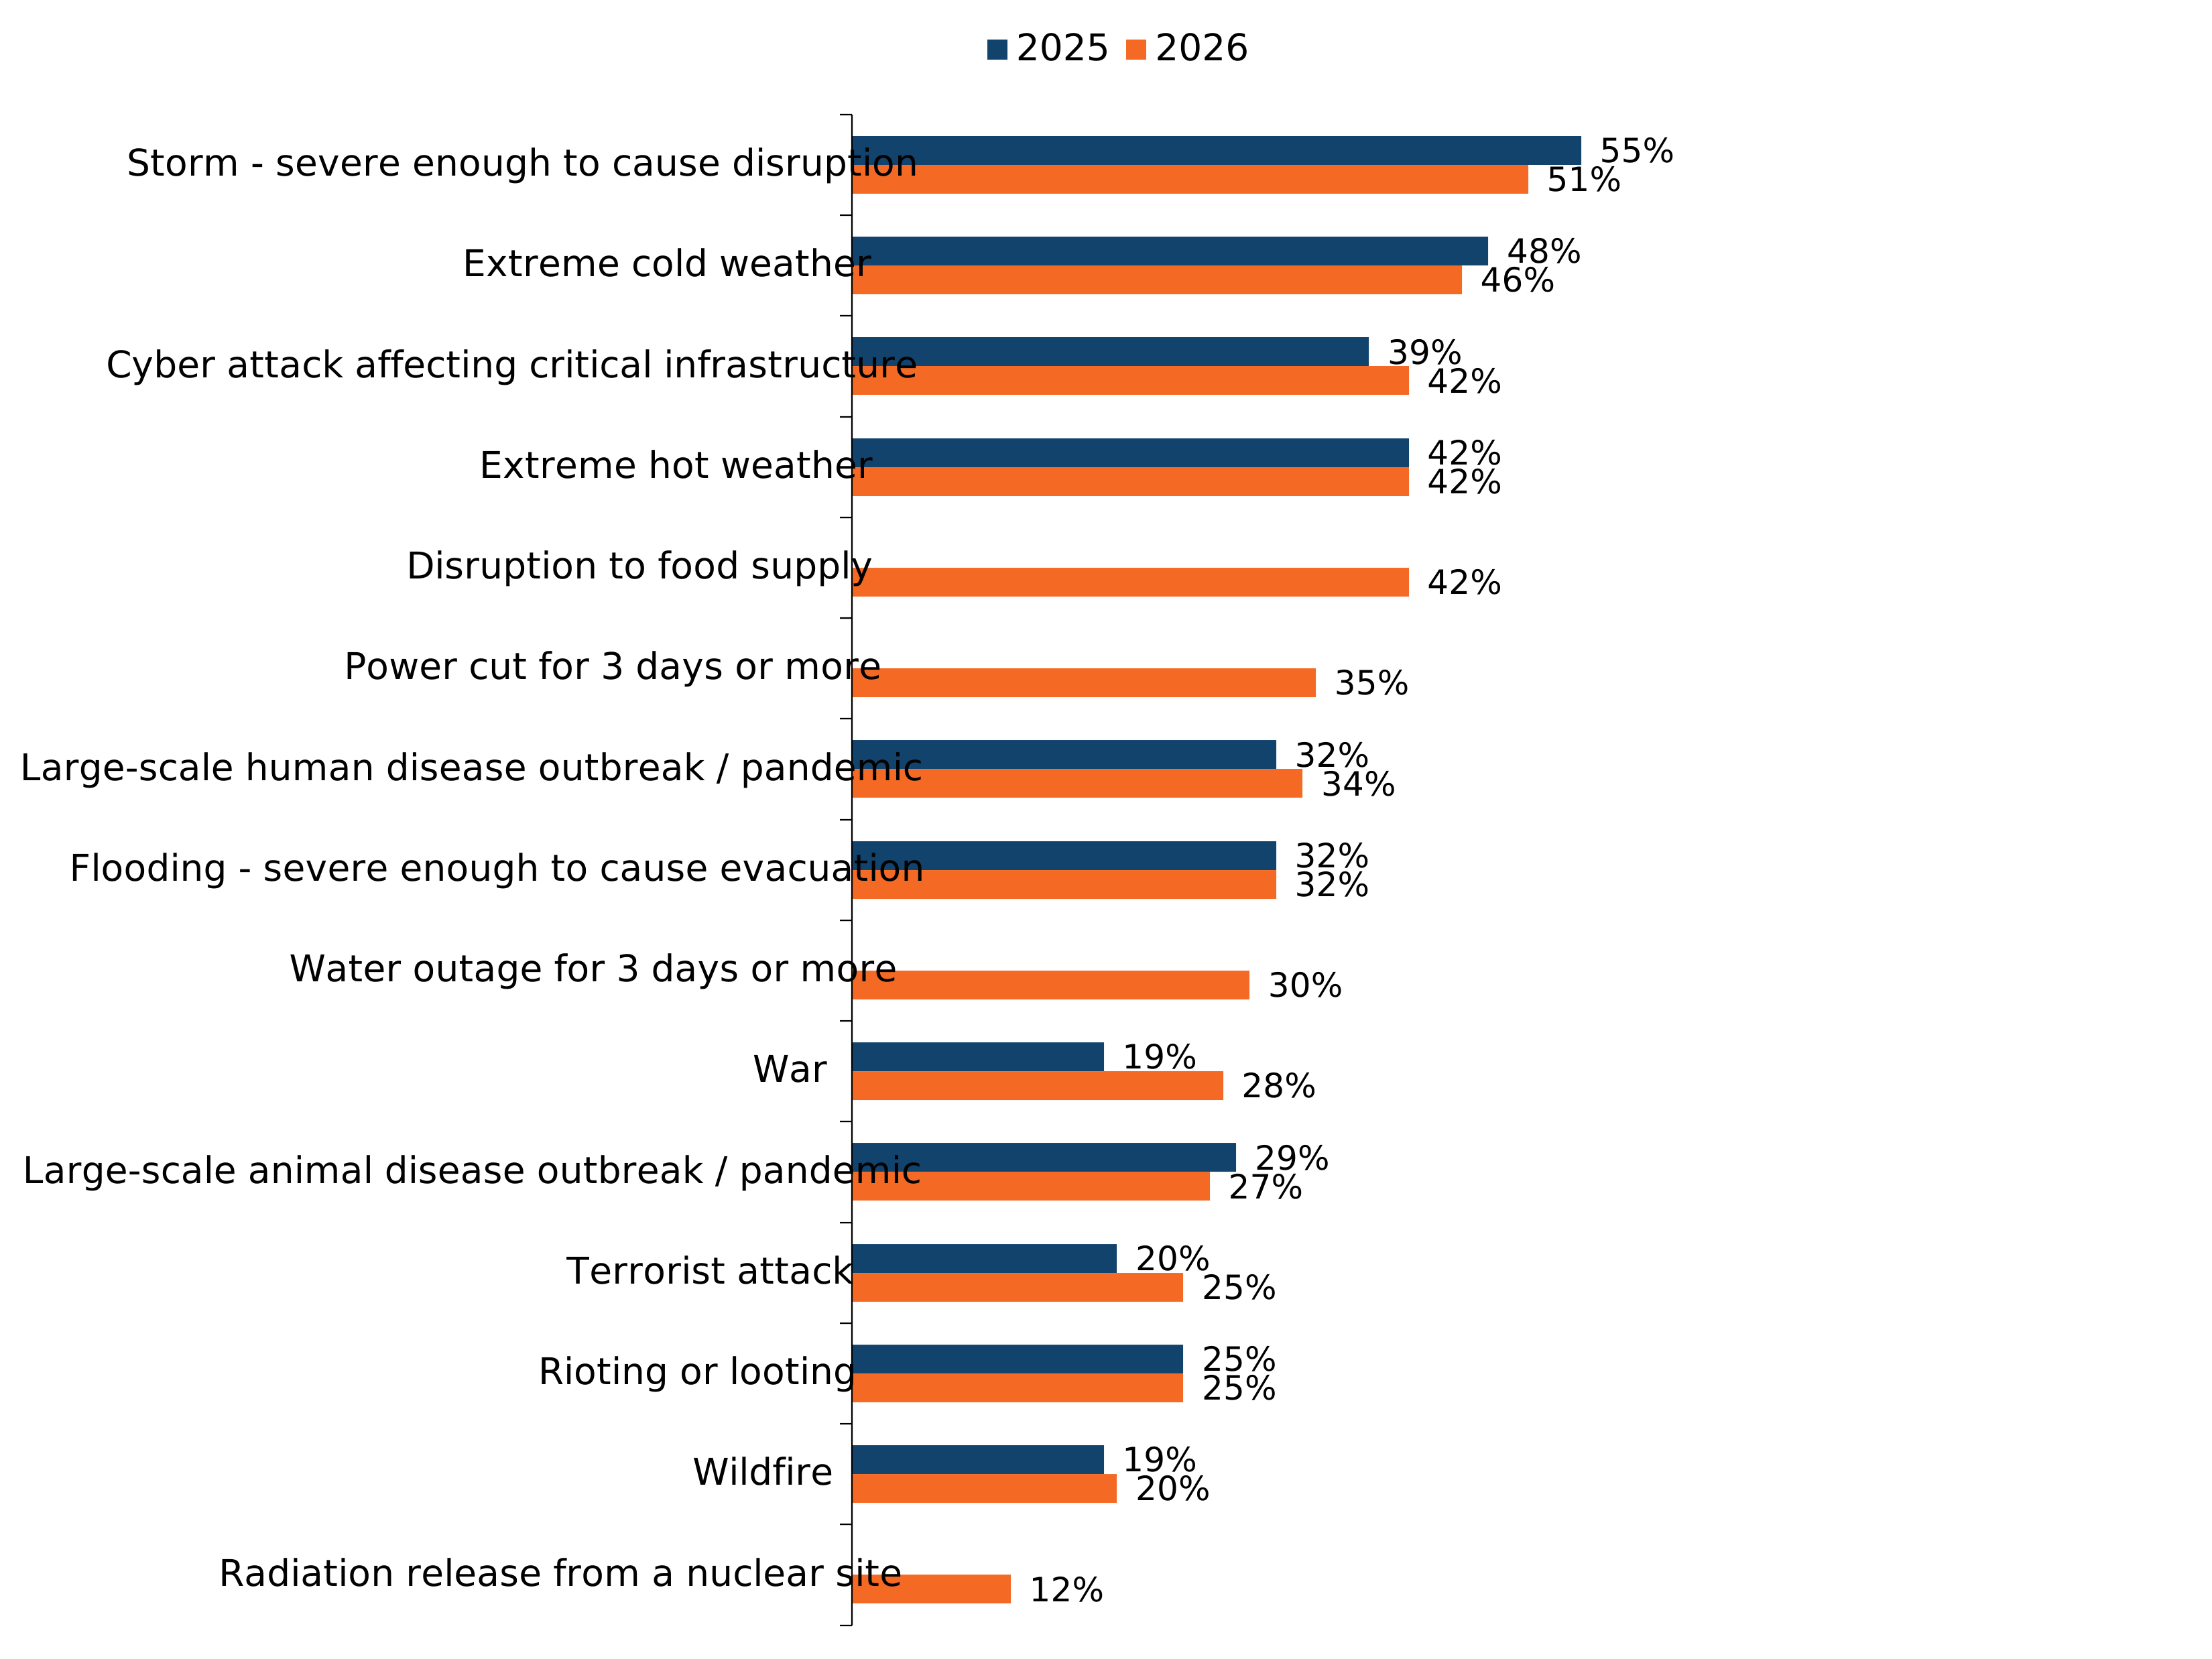
Figure note:
Source: Q2. How likely or unlikely do you think it is that your local area will be affected by the following in the next 2 years?
Statements are ordered from highest to lowest based on the compound figure of likely and very likely.
The following statements were not assessed in 2025: Disruption to food supply, power cut for 3 days or more, water outage for 3 days or more, radiation from a nuclear site
Data shown are for 2025 (Wave 1) and 2026 (Wave 2).
Base: All respondents in UK sample, 2025 (n=10,536); 2026 (n=10,791)
Perceived impact of different types of emergencies/disasters
The majority (68%) of survey respondents believed that war would have a large or very large impact on them personally if it were to affect their local area. 60% believed that a large-scale human disease outbreak/pandemic would have a large or very large impact on them, and 55% believed a terrorist attack would have a large or very large impact on them.
Perceived impact of different emergencies/disasters increased between 2025 and 2026. The largest increases were seen for flooding (43% to 50%) and a large-scale animal disease outbreak /pandemic (32% to 38%). This was followed by large-scale human disease outbreak/pandemic (55% to 60%), extreme cold weather (40% to 45%) and extreme hot weather (38% to 43%) all increasing by 5 percentage points. Perceived impact of war increased between 2025 and 2026 by three percentage points (65% to 68%).
Figure 1.5: Perceived personal impact of different types of emergencies/disasters if they did affect respondents’ local area (showing % of respondents) (see UK 2026 table 20 (ODS, 1.15MB))
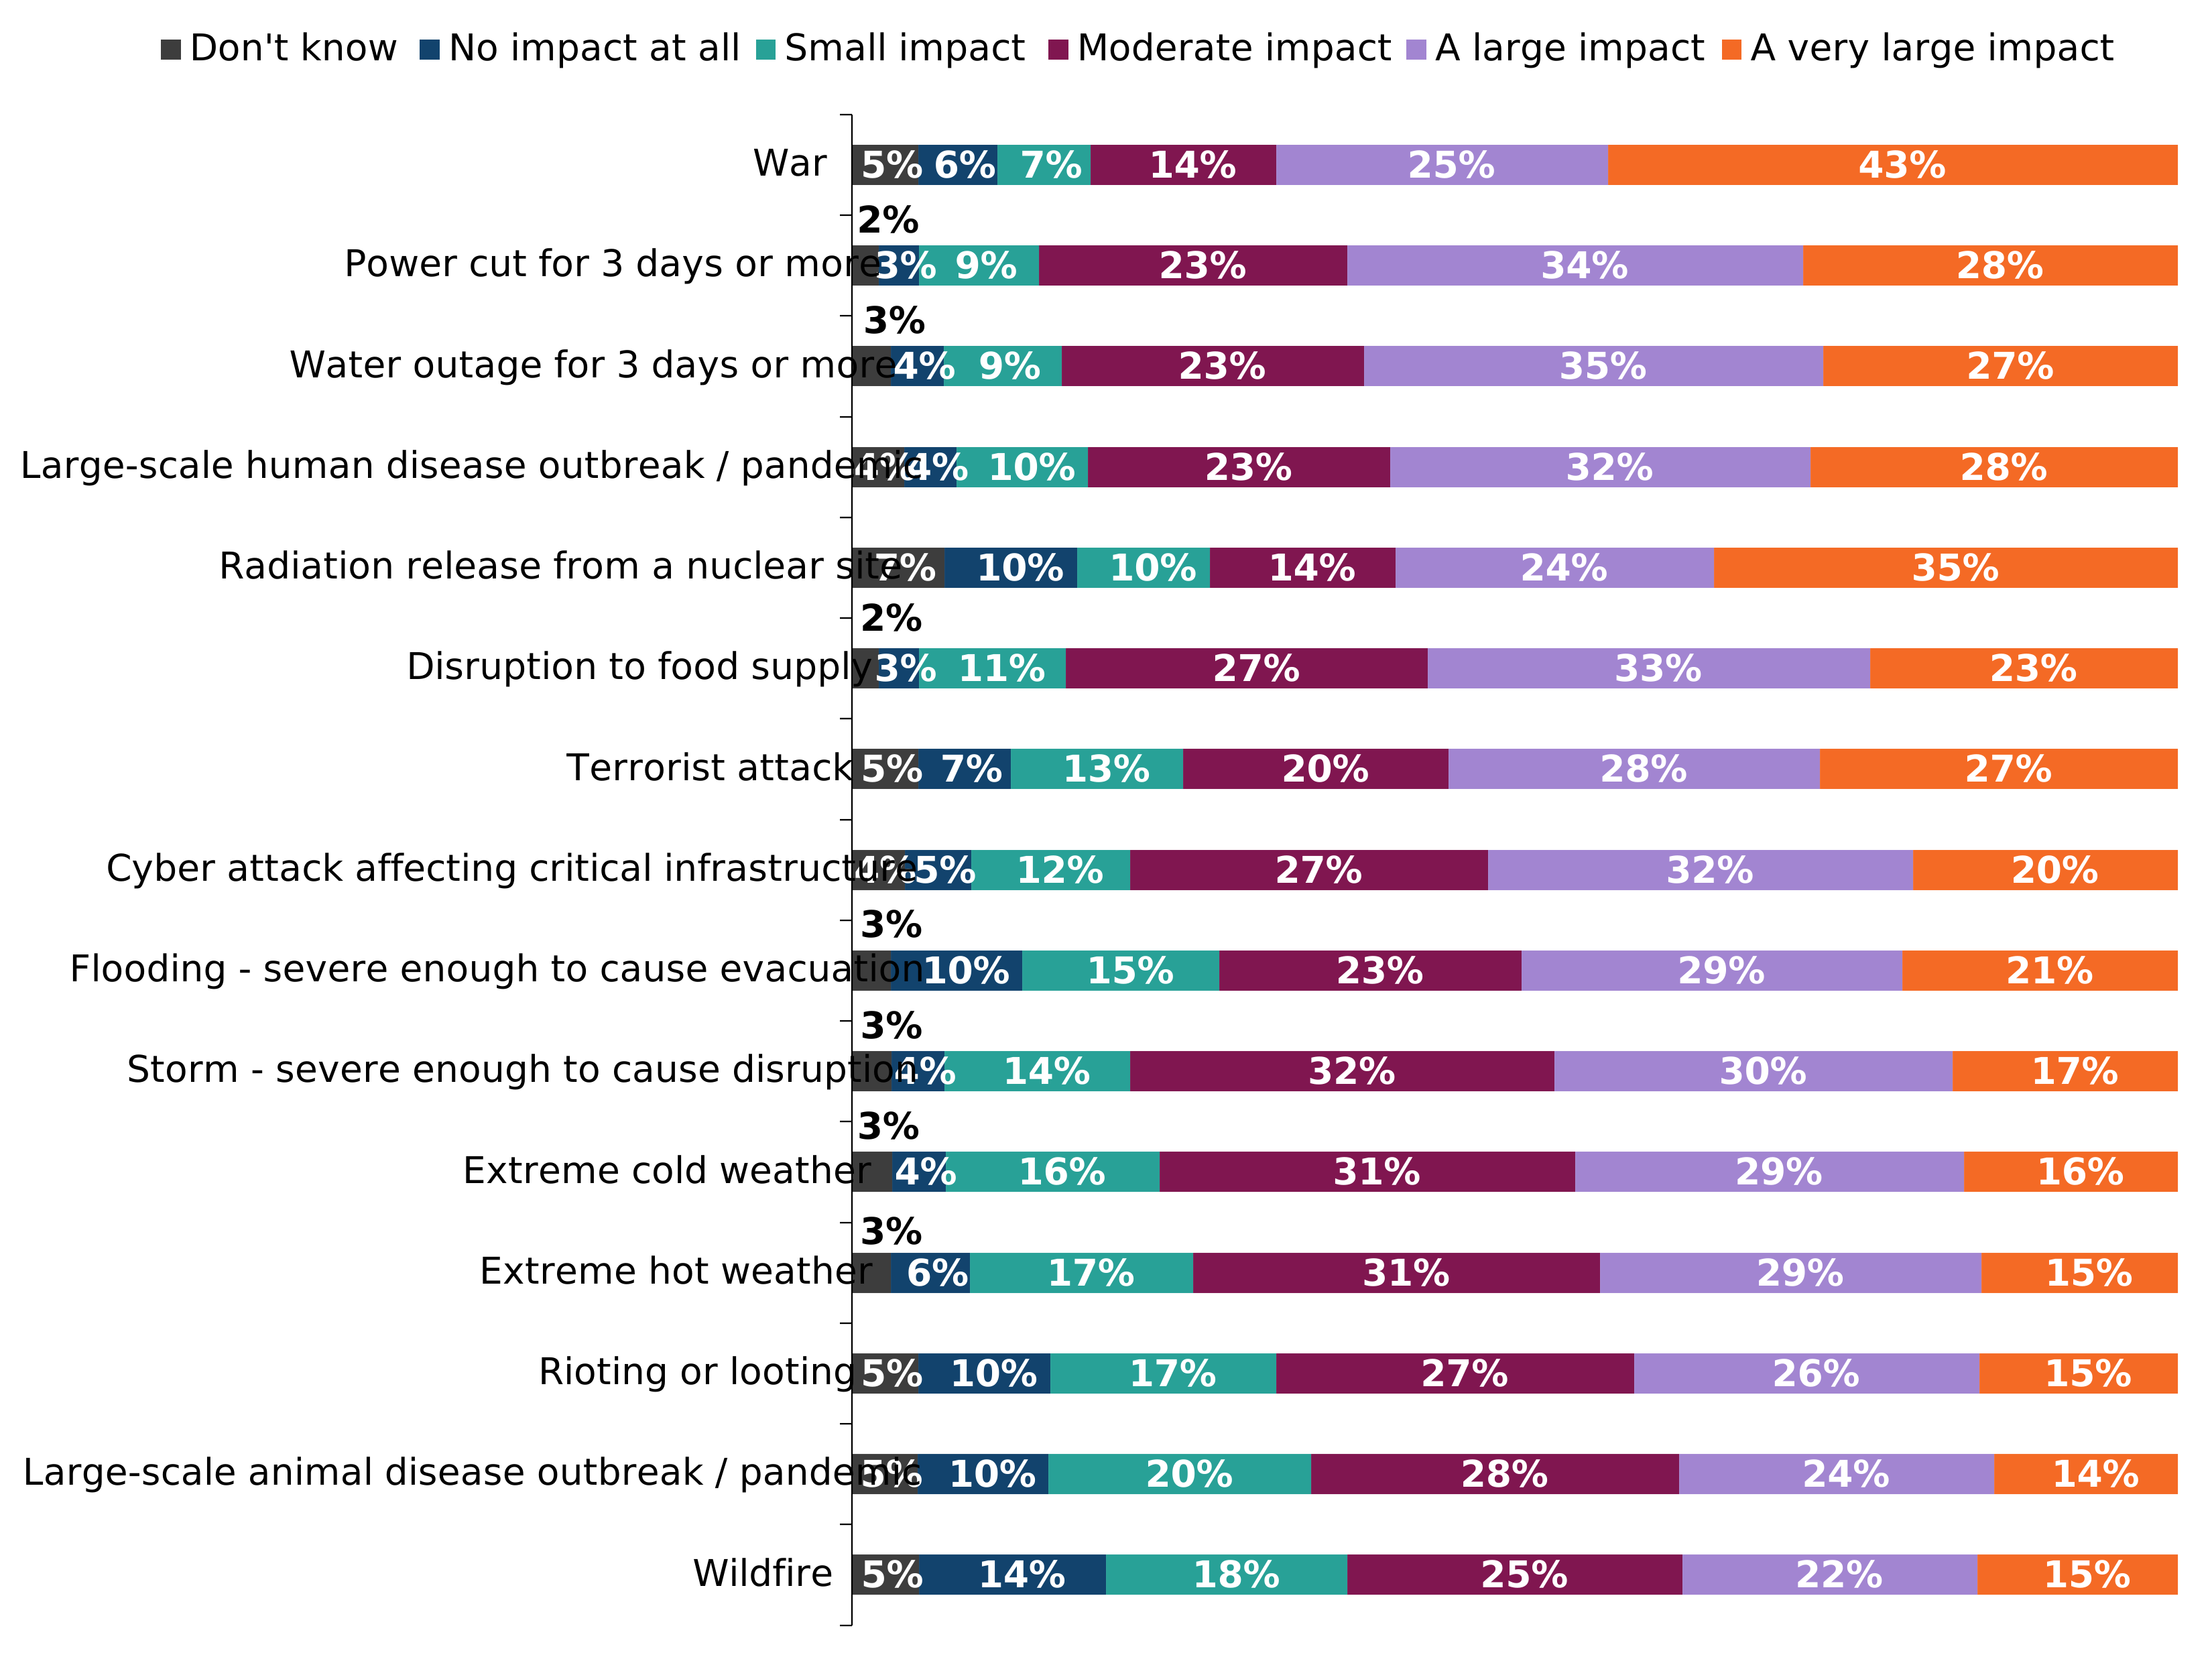
Figure note:
Source: Q3. If the following were to affect your local area, how much of an impact, if any, do you think this would have on you? These could be impacts to your health or impacts to your ability to conduct your normal activities.
Statements are ordered from highest to lowest based on the compound figure of large impact and very large impact.
Base: All respondents in UK sample 2026 (n=10,791).
Due to rounding, the totals will not always add up to 100%.
Figure 1.6: 2025 to 2026 comparison of perceived personal impact of different types of emergencies/disasters if they did affect respondents’ local area (showing % of respondents who selected large or very large impact) (see UK WoW table 21 (ODS, 1.47MB))
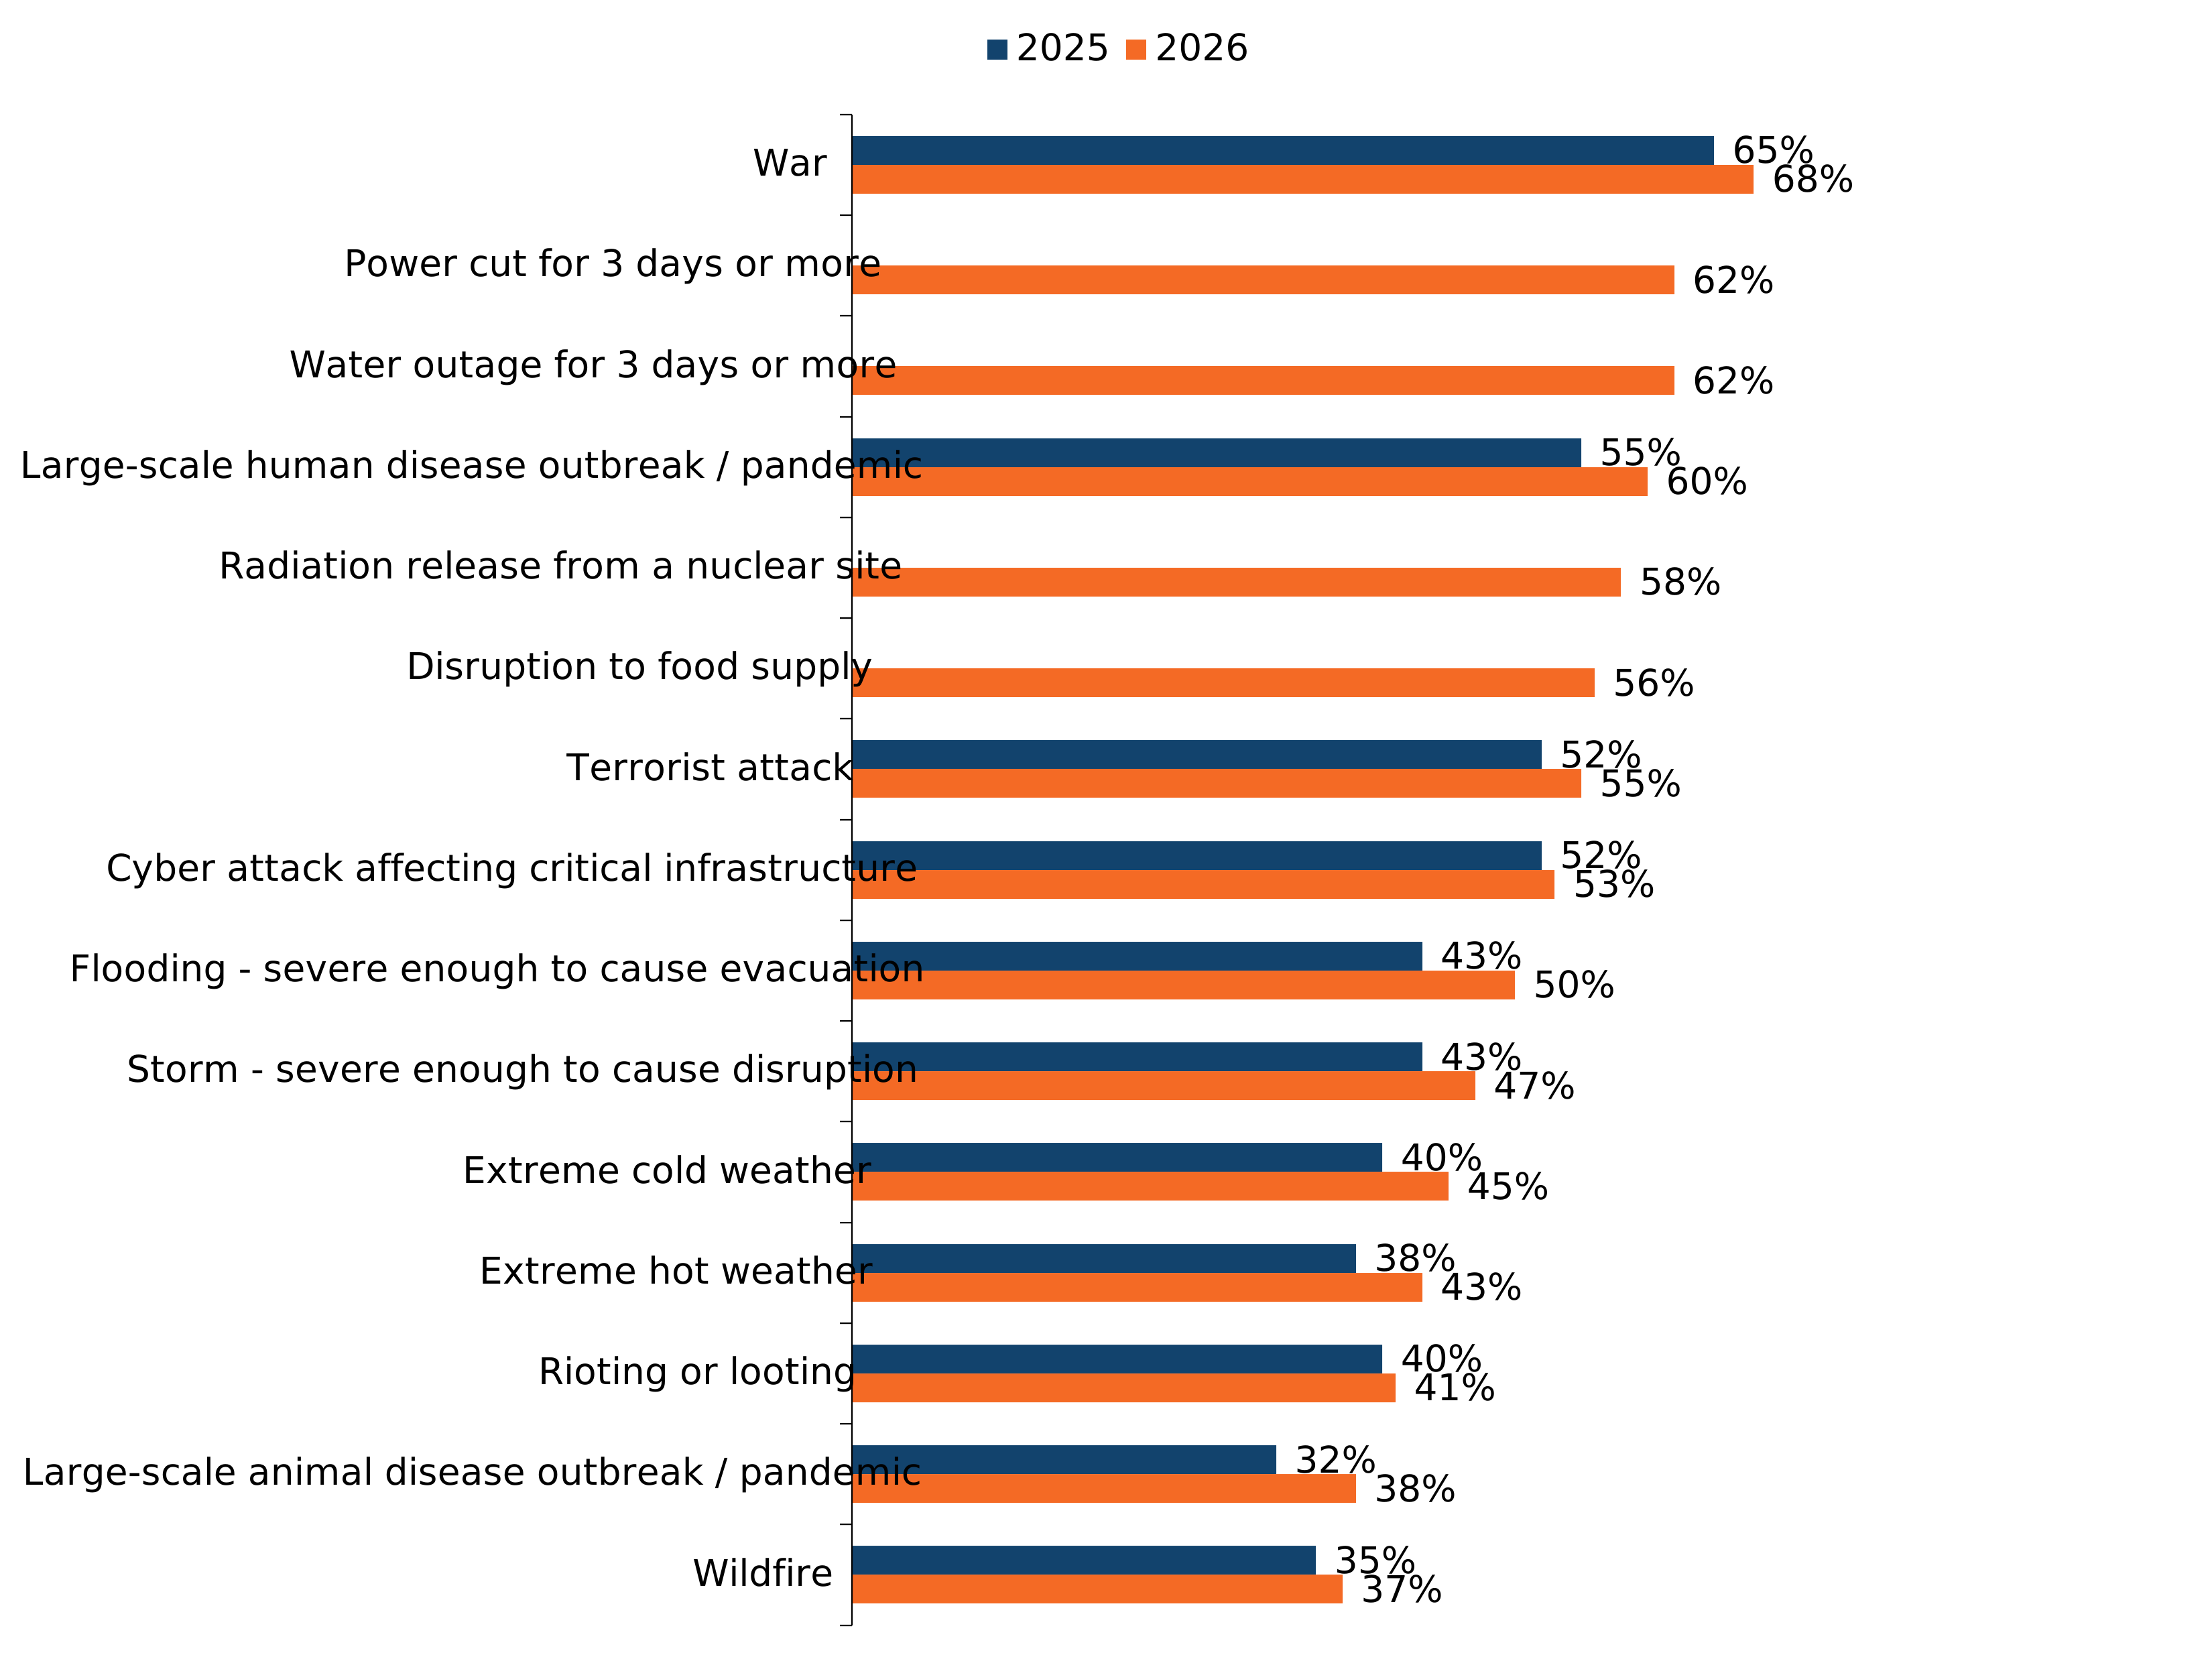
Figure note:
Source: Q3. If the following were to affect your local area, how much of an impact, if any, do you think this would have on you? These could be impacts to your health or impacts to your ability to conduct your normal activities.
Statements are ordered from highest to lowest based on the compound figure of large impact and very large impact.
The following statements were not assessed in 2025: Power cut for 3 days or more, water outage for 3 days or more, radiation from a nuclear site, disruption to food supply
Data shown are for 2025 (Wave 1) and 2026 (Wave 2).
Base: All respondents in UK sample 2025 (n=10,536); 2026 (n=10,791).
Perceptions of preparedness and resilience
Perceptions related to preparedness actions
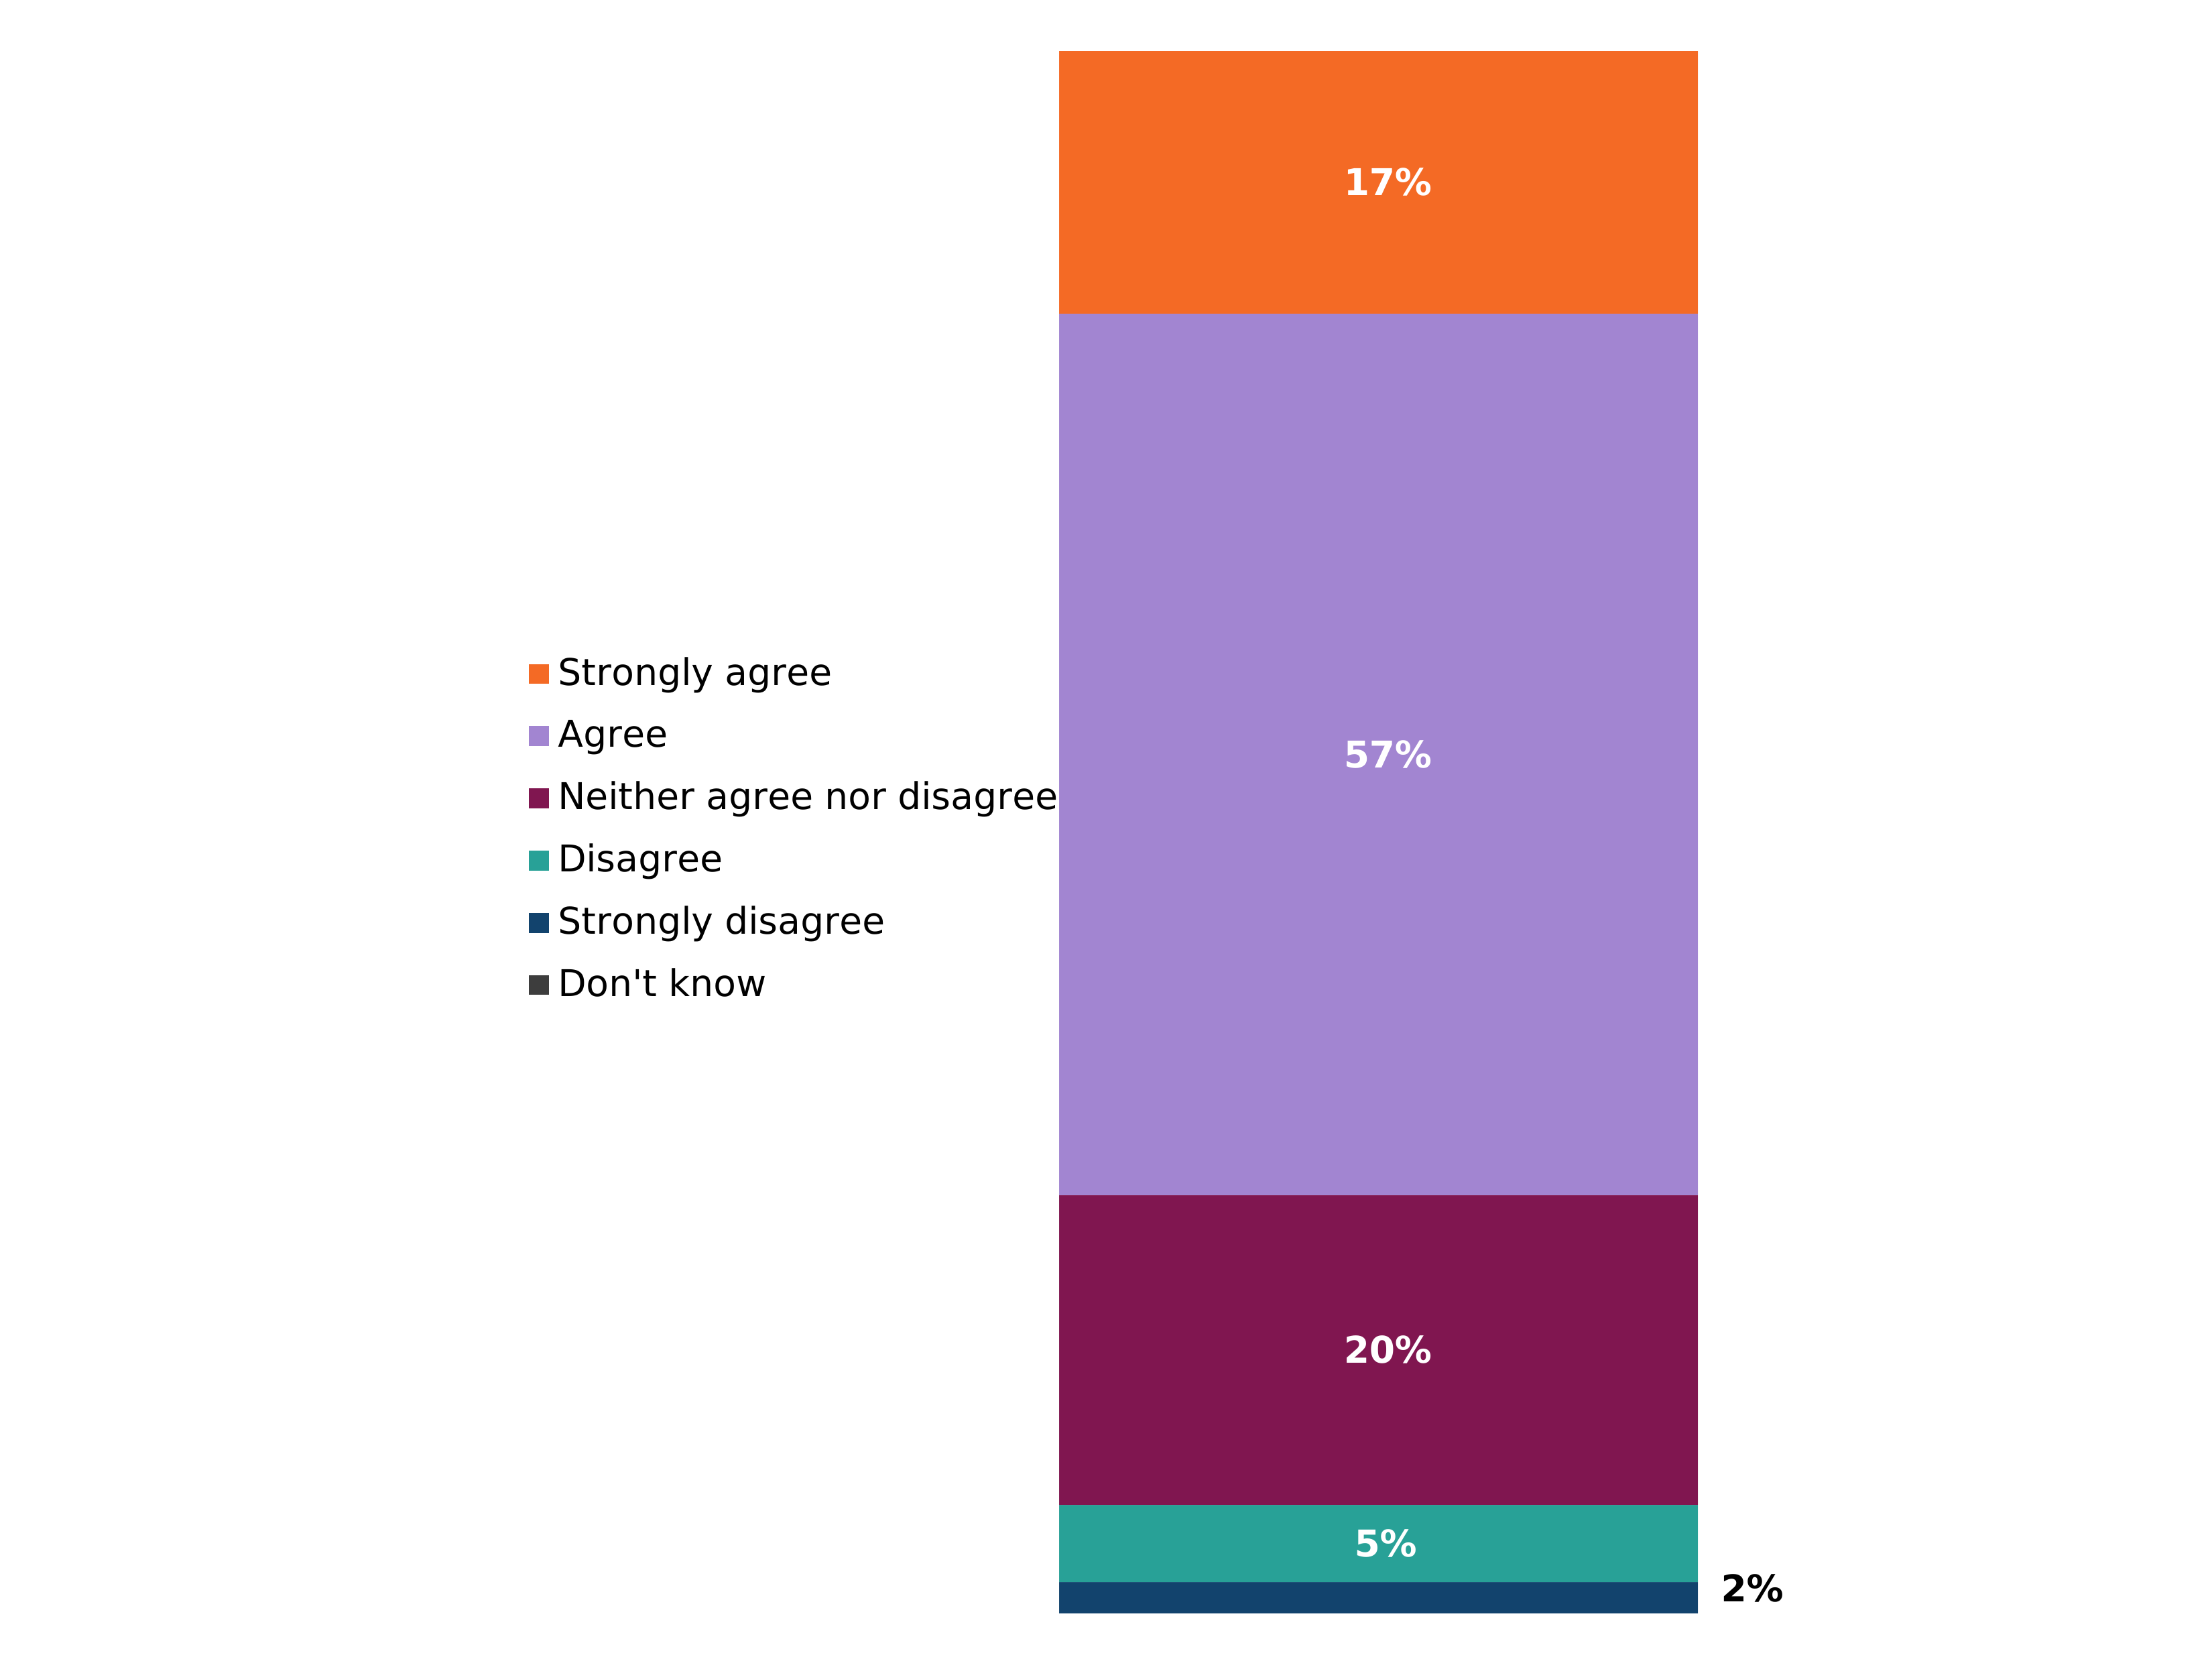
The majority (74%) of respondents agreed or strongly agreed that there were effective actions that people can take to prepare for emergencies/disasters, whereas 6% of respondents disagreed or strongly disagreed with this statement. This was broadly consistent with 2025, where 73% agreed and 7% disagreed.
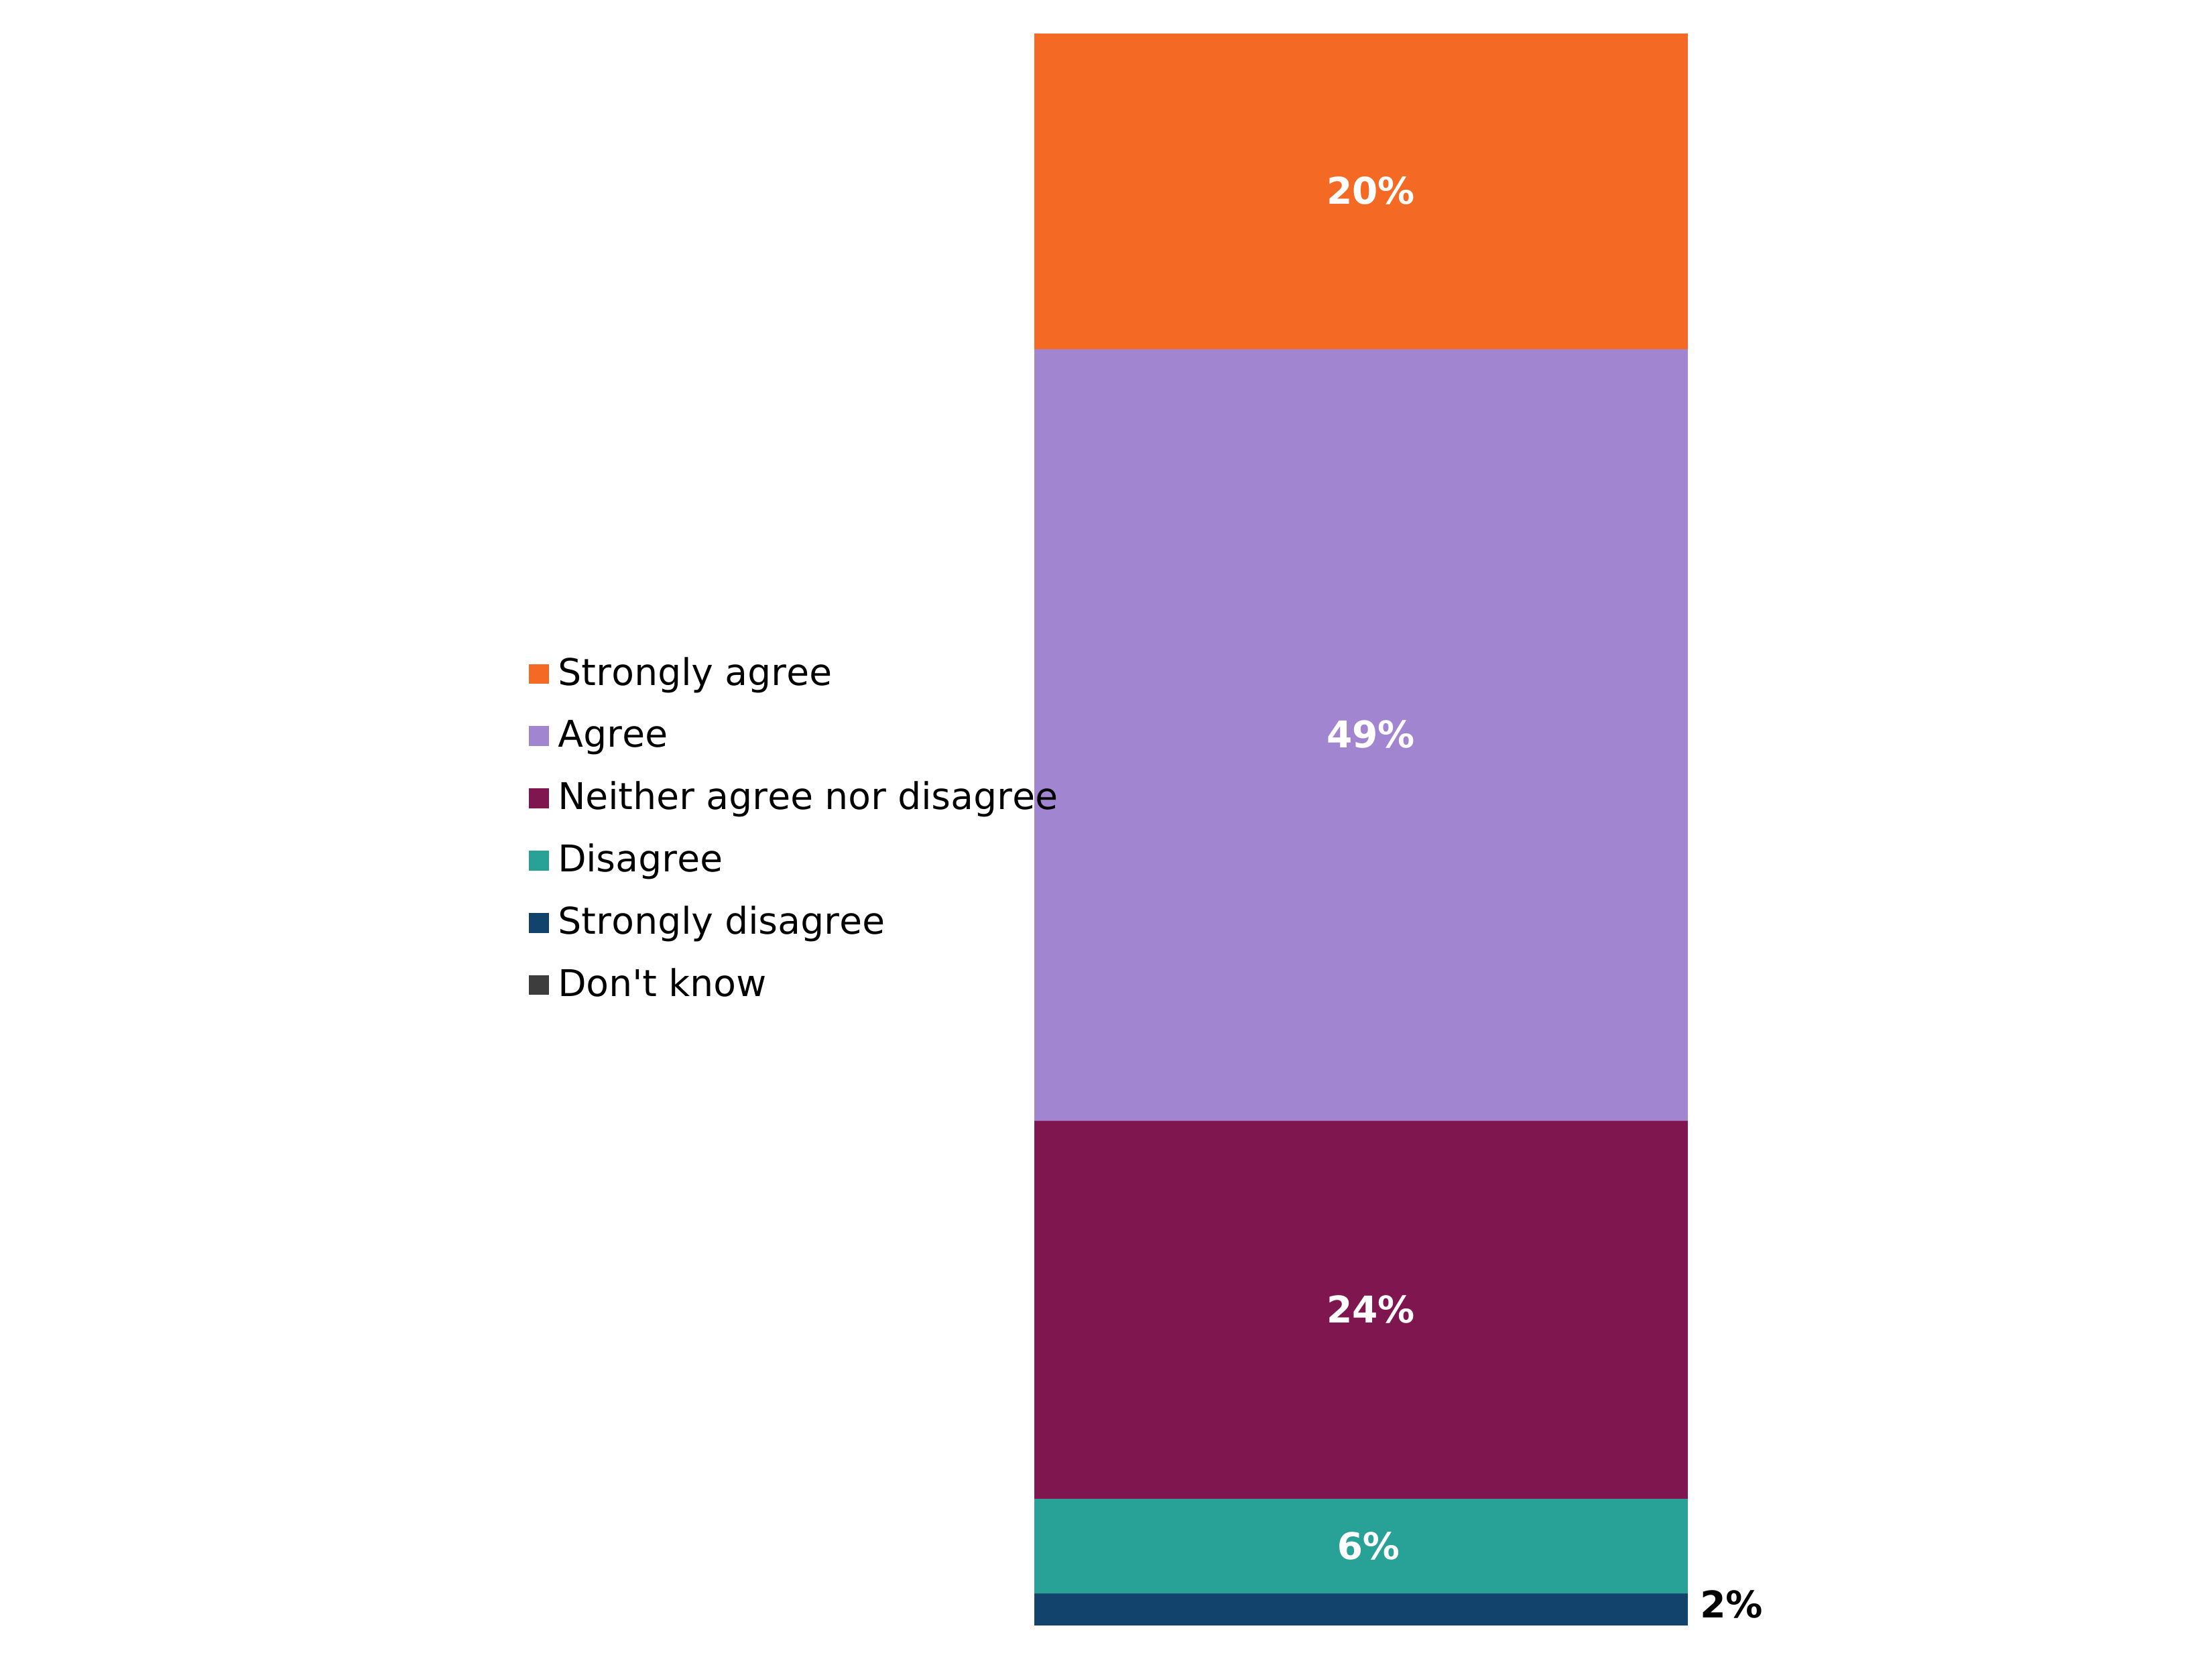
The majority (69%) of respondents agreed or strongly agreed that it was important to be prepared for emergencies/disasters that are unlikely to happen, whereas 7% disagreed or strongly disagreed with this statement. This was broadly consistent with 2025, where 69% agreed and 8% disagreed.
The majority (61%) of respondents agreed or strongly agreed that they were capable of taking action to prepare for emergencies/disasters that might affect their local area, whereas 11% disagreed or strongly disagreed with this statement. This was largely unchanged from 2025, where 62% agreed and 12% disagreed.
Figure 2.1: Level of agreement with each of the following statements (showing % of respondents) (see UK 2026 table 38 (ODS, 1.15MB))
“There are effective actions that people can take to prepare for emergencies/disasters”
“It is important to be prepared for emergencies/disasters that are unlikely to happen”
“I am capable of taking action to prepare for emergencies/disasters that might affect my local area”
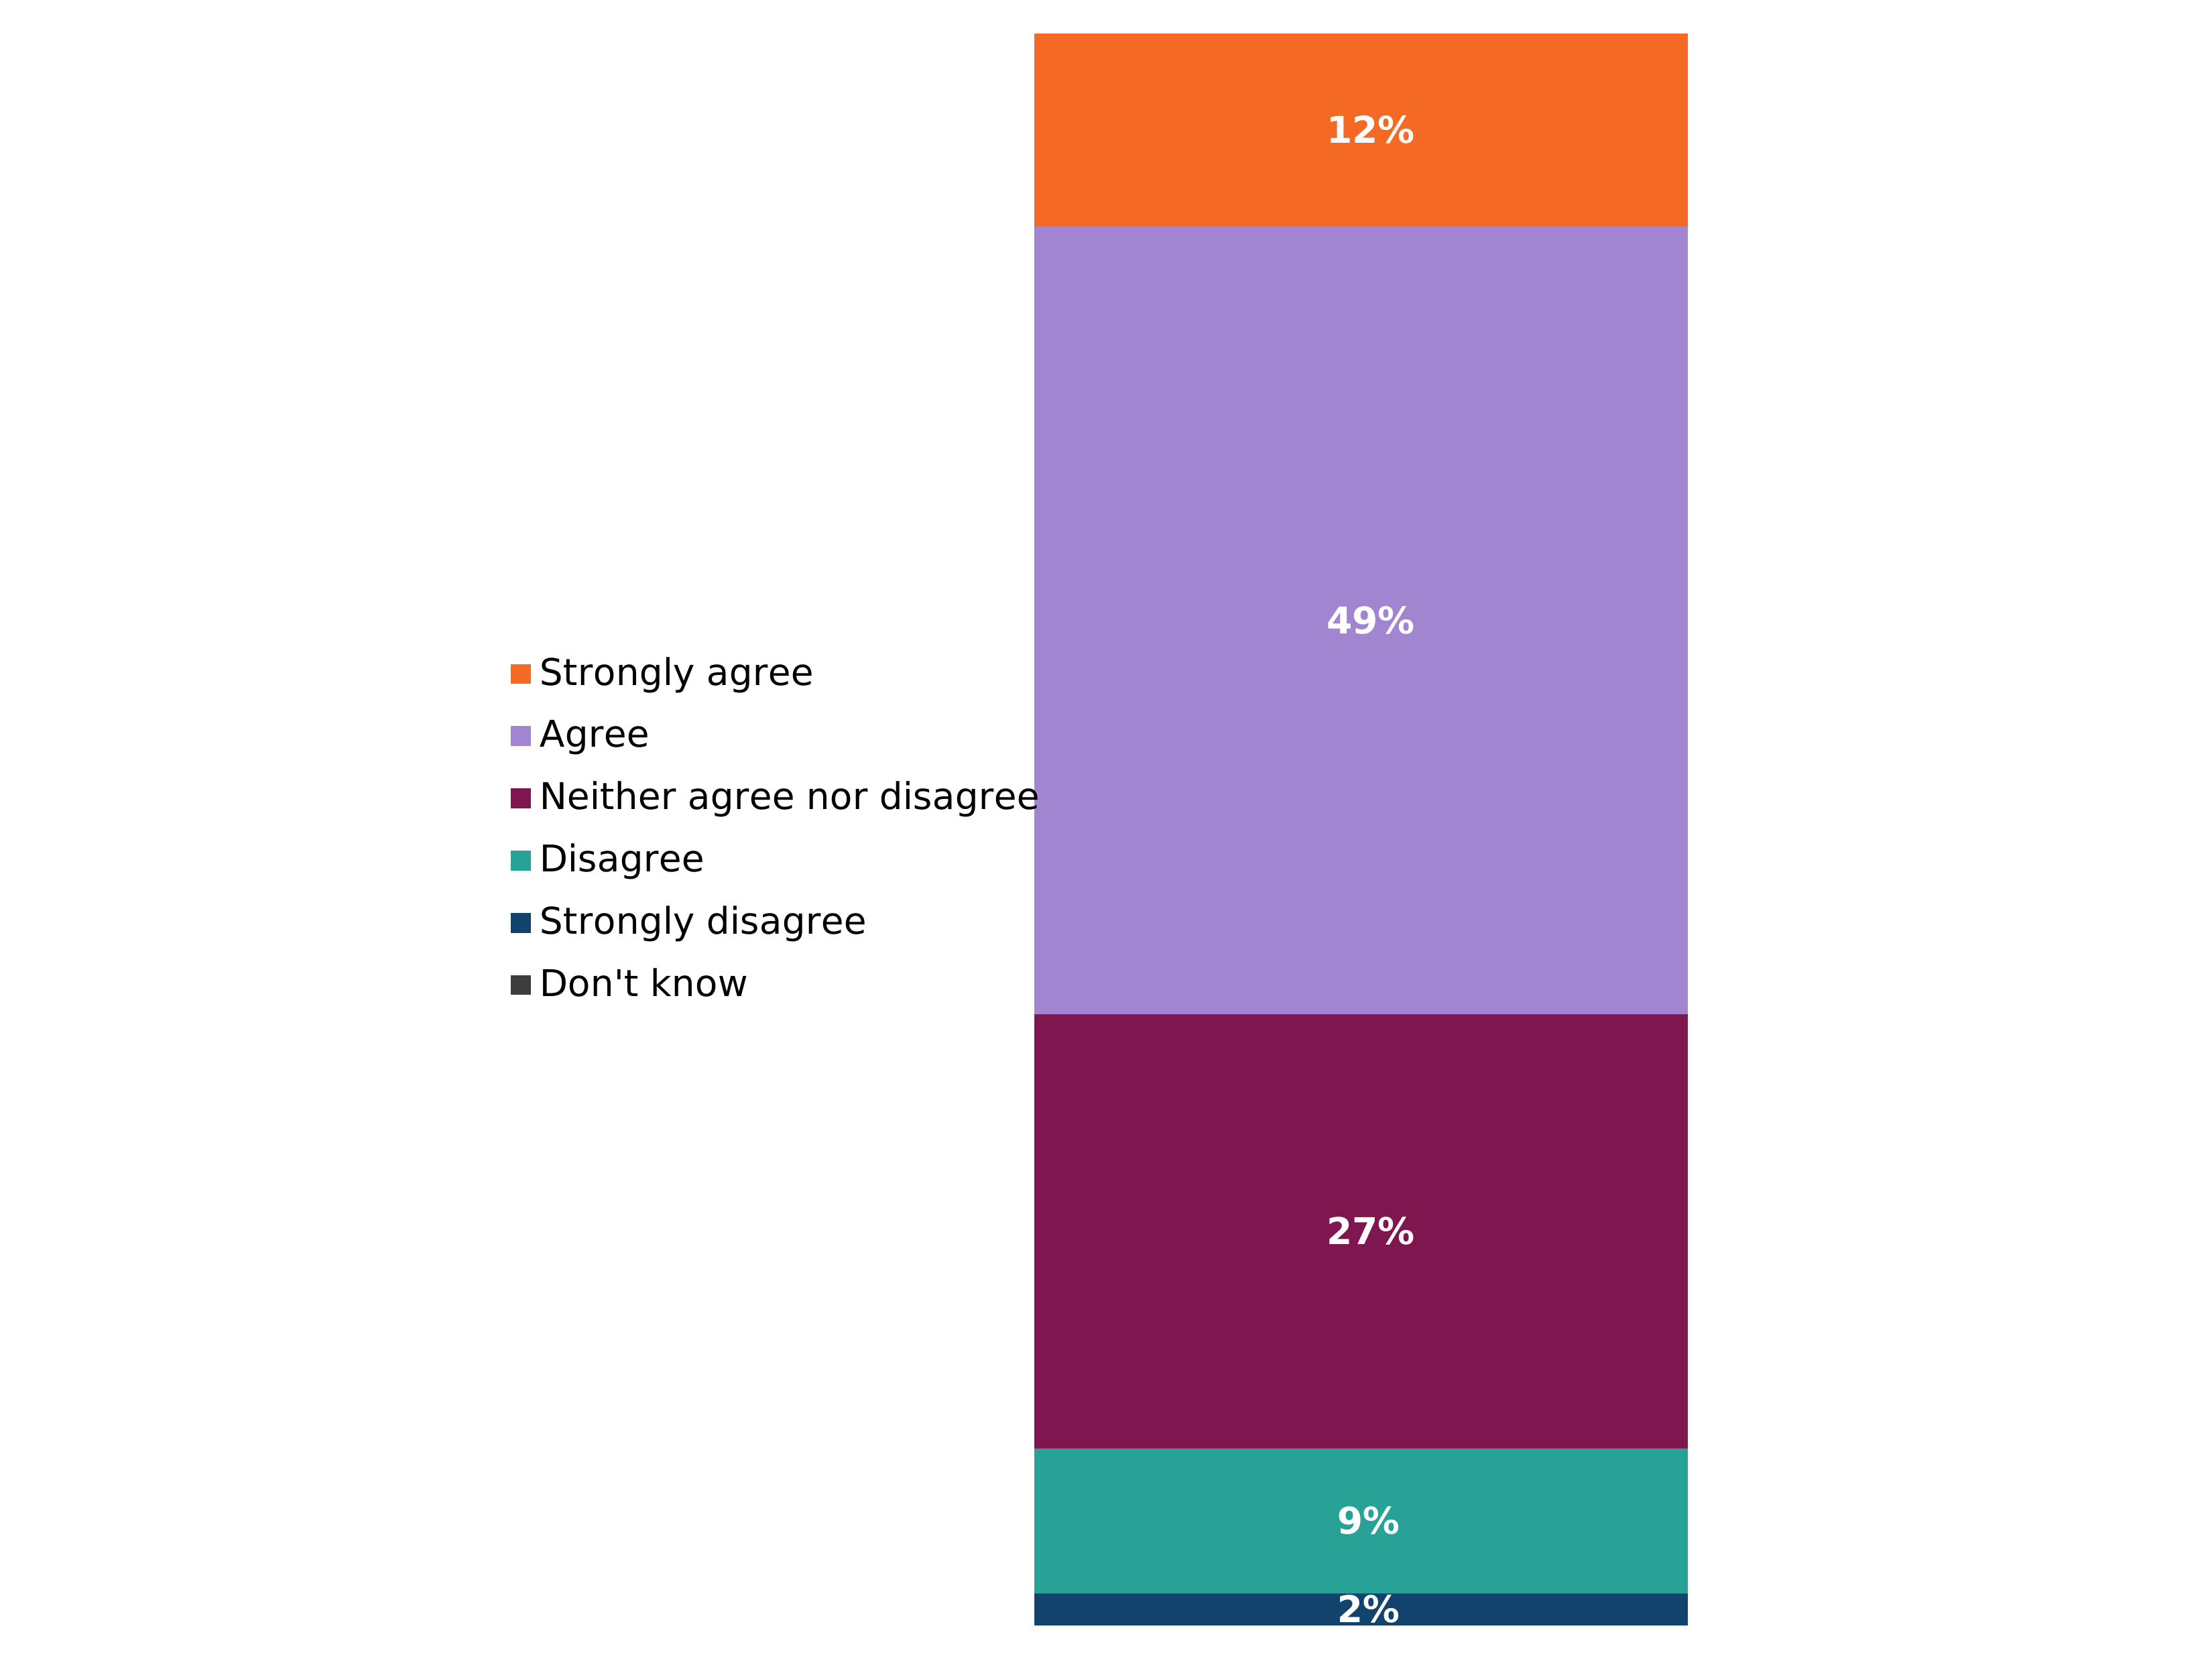
Figure note:
Source: Q4. How strongly do you agree or disagree with the following statements?
Base: All respondents in UK sample, 2026 (n=10,791).
Due to rounding, the totals will not always add up to 100%.
Figure 2.2: 2025 to 2026 comparison of level of agreement with each of the following statements (showing % of respondents who selected either agree or strongly agree) (see UK WoW table 39 (ODS, 1.47MB))
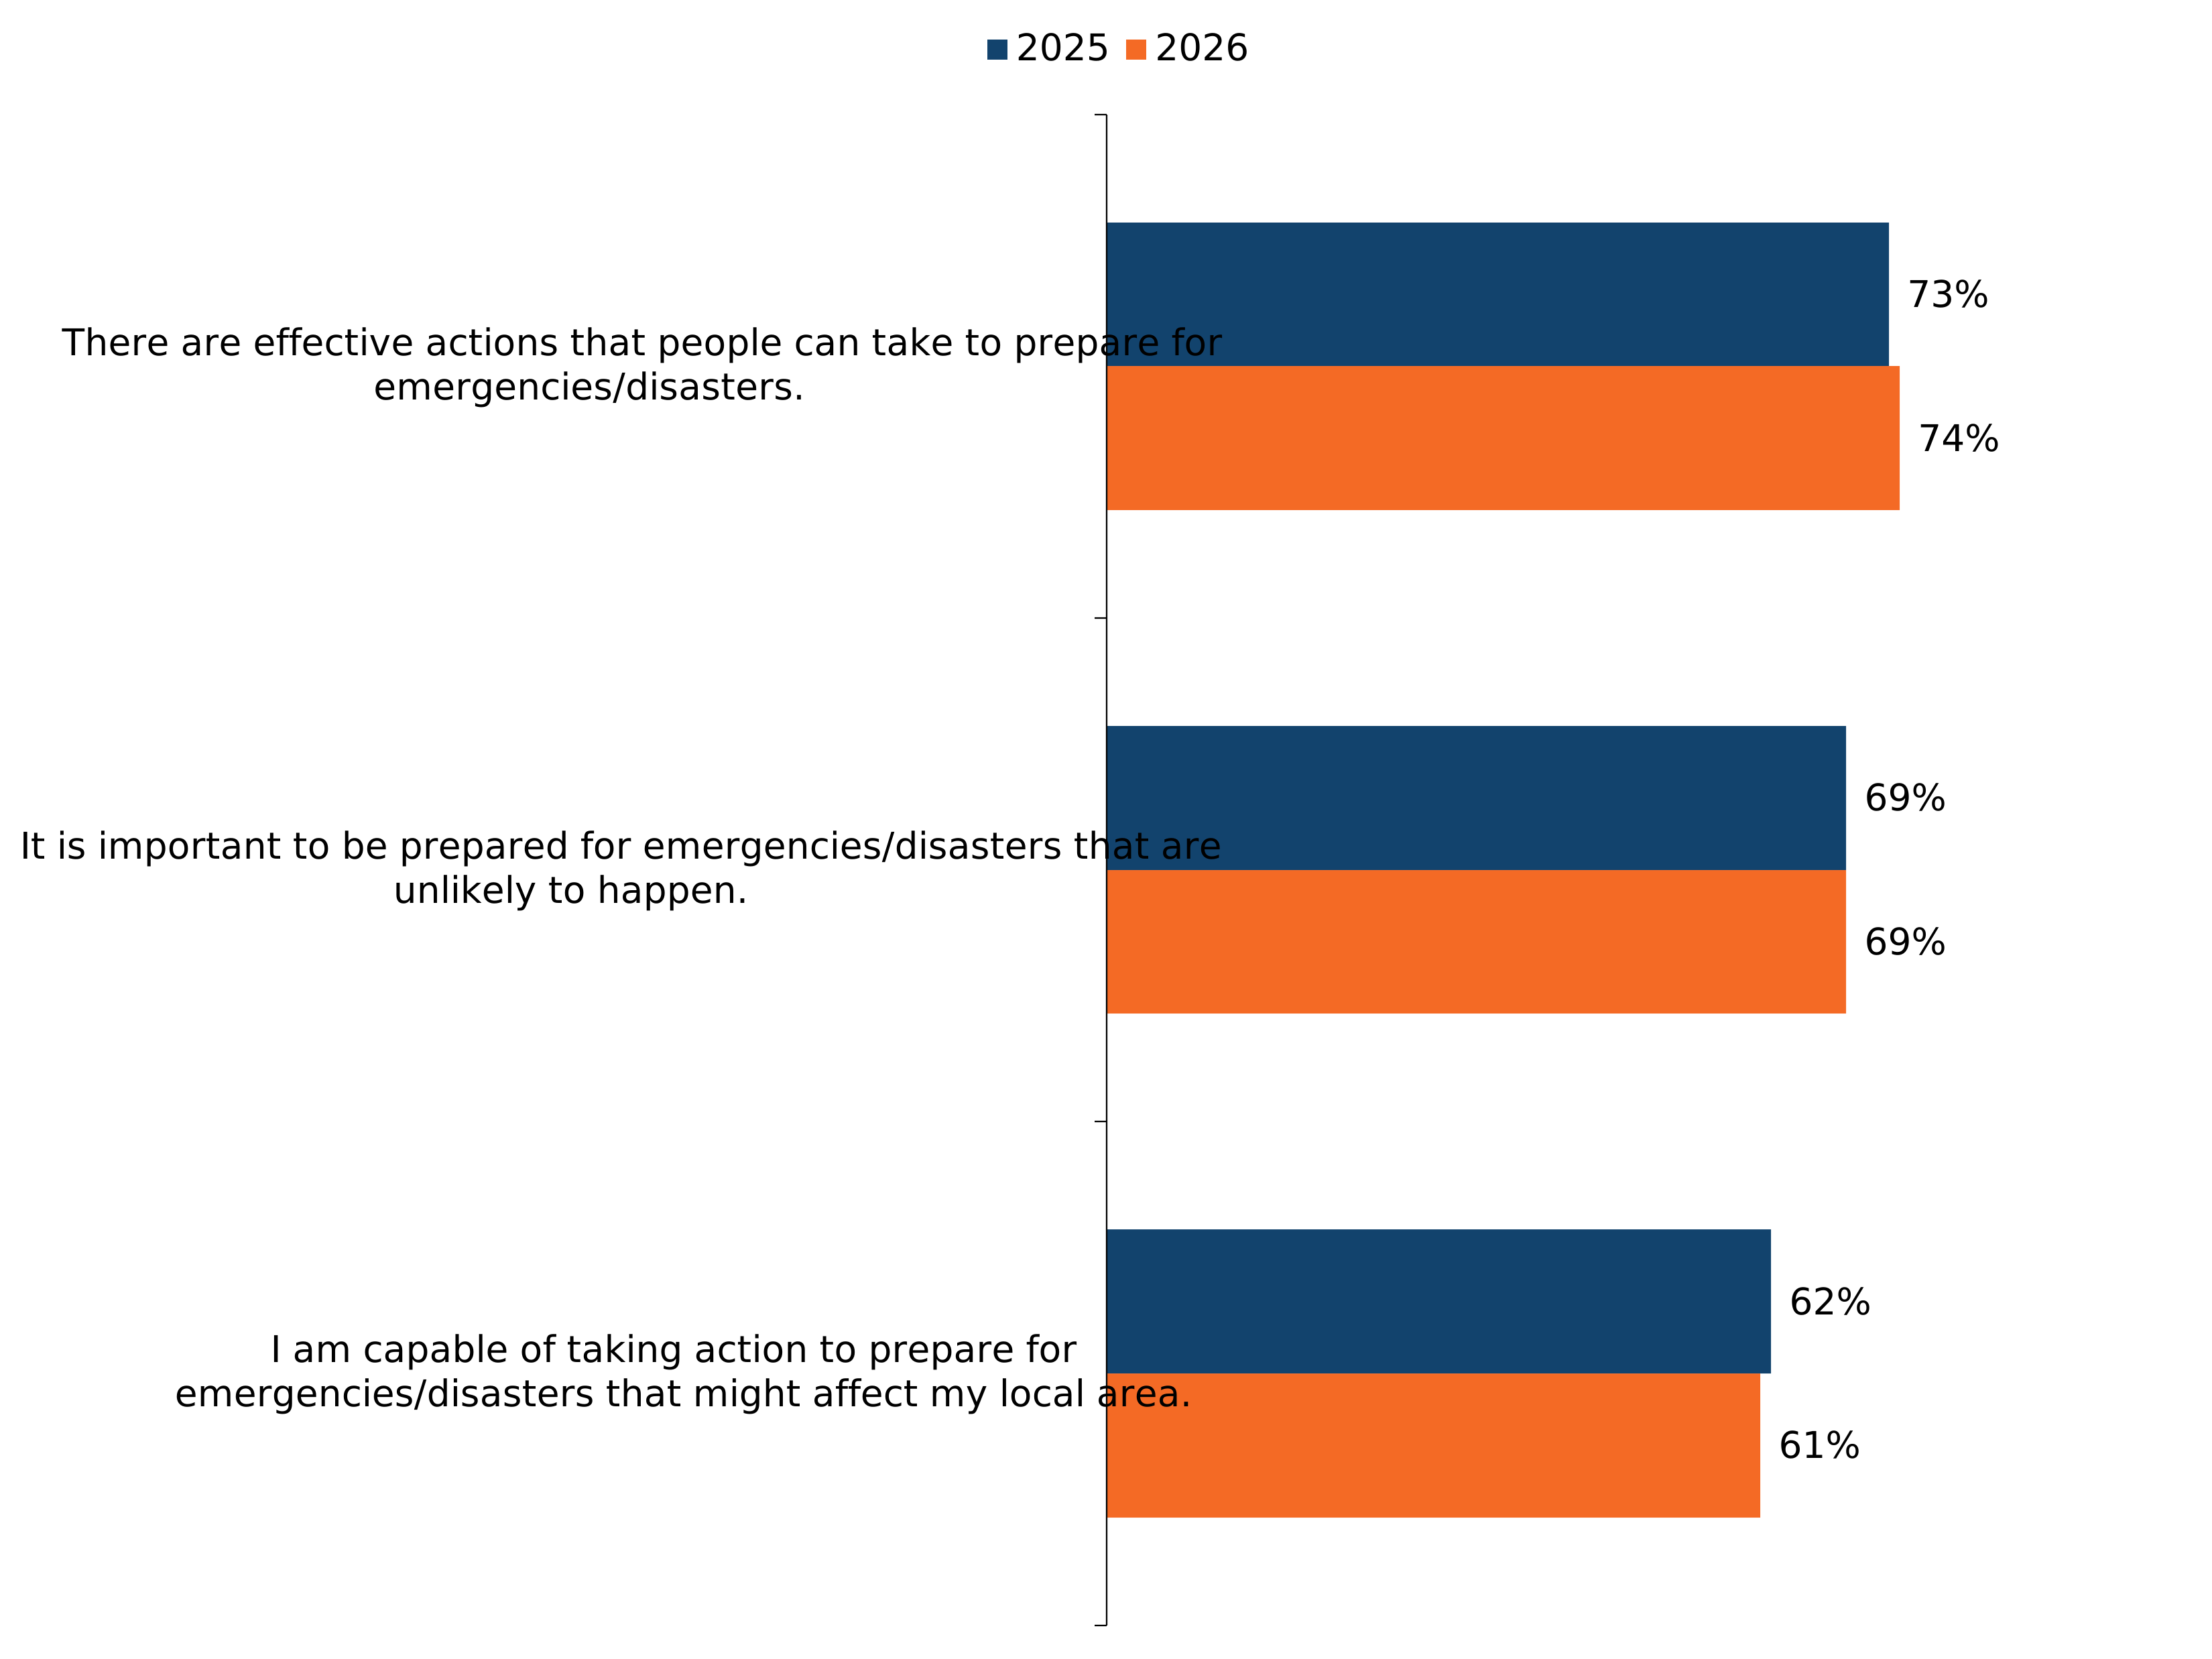
Figure note:
Source: Q4. How strongly do you agree or disagree with the following statements?
Statements are ordered from highest to lowest based on the compound figure of Agree and Strongly agree.
Data shown are for 2025 (Wave 1) and 2026 (Wave 2).
Base: All respondents in UK sample 2025 (n=10,536); 2026 (n=10,791).
Perceptions related to preparedness at different levels of society
13% of survey respondents felt that their household was largely or totally prepared for an emergency/disaster and 33% reported feeling moderately prepared, while 50% felt they were slightly or not at all prepared for an emergency/disaster and 3% said they did not know.
Levels of household preparedness were largely unchanged compared to 2025, with the proportion feeling largely or totally prepared (13%) stable between waves, while those saying they were moderately prepared increased by one percentage point, from 32% in 2025 to 33% in 2026 and those saying they were slightly or not at all prepared declined by one percentage point (from 51% to 50%).
Figure 2.3: How prepared respondents felt their households were for an emergency/disaster (showing % of respondents) (see UK 2026 table 44 (ODS, 1.15MB))
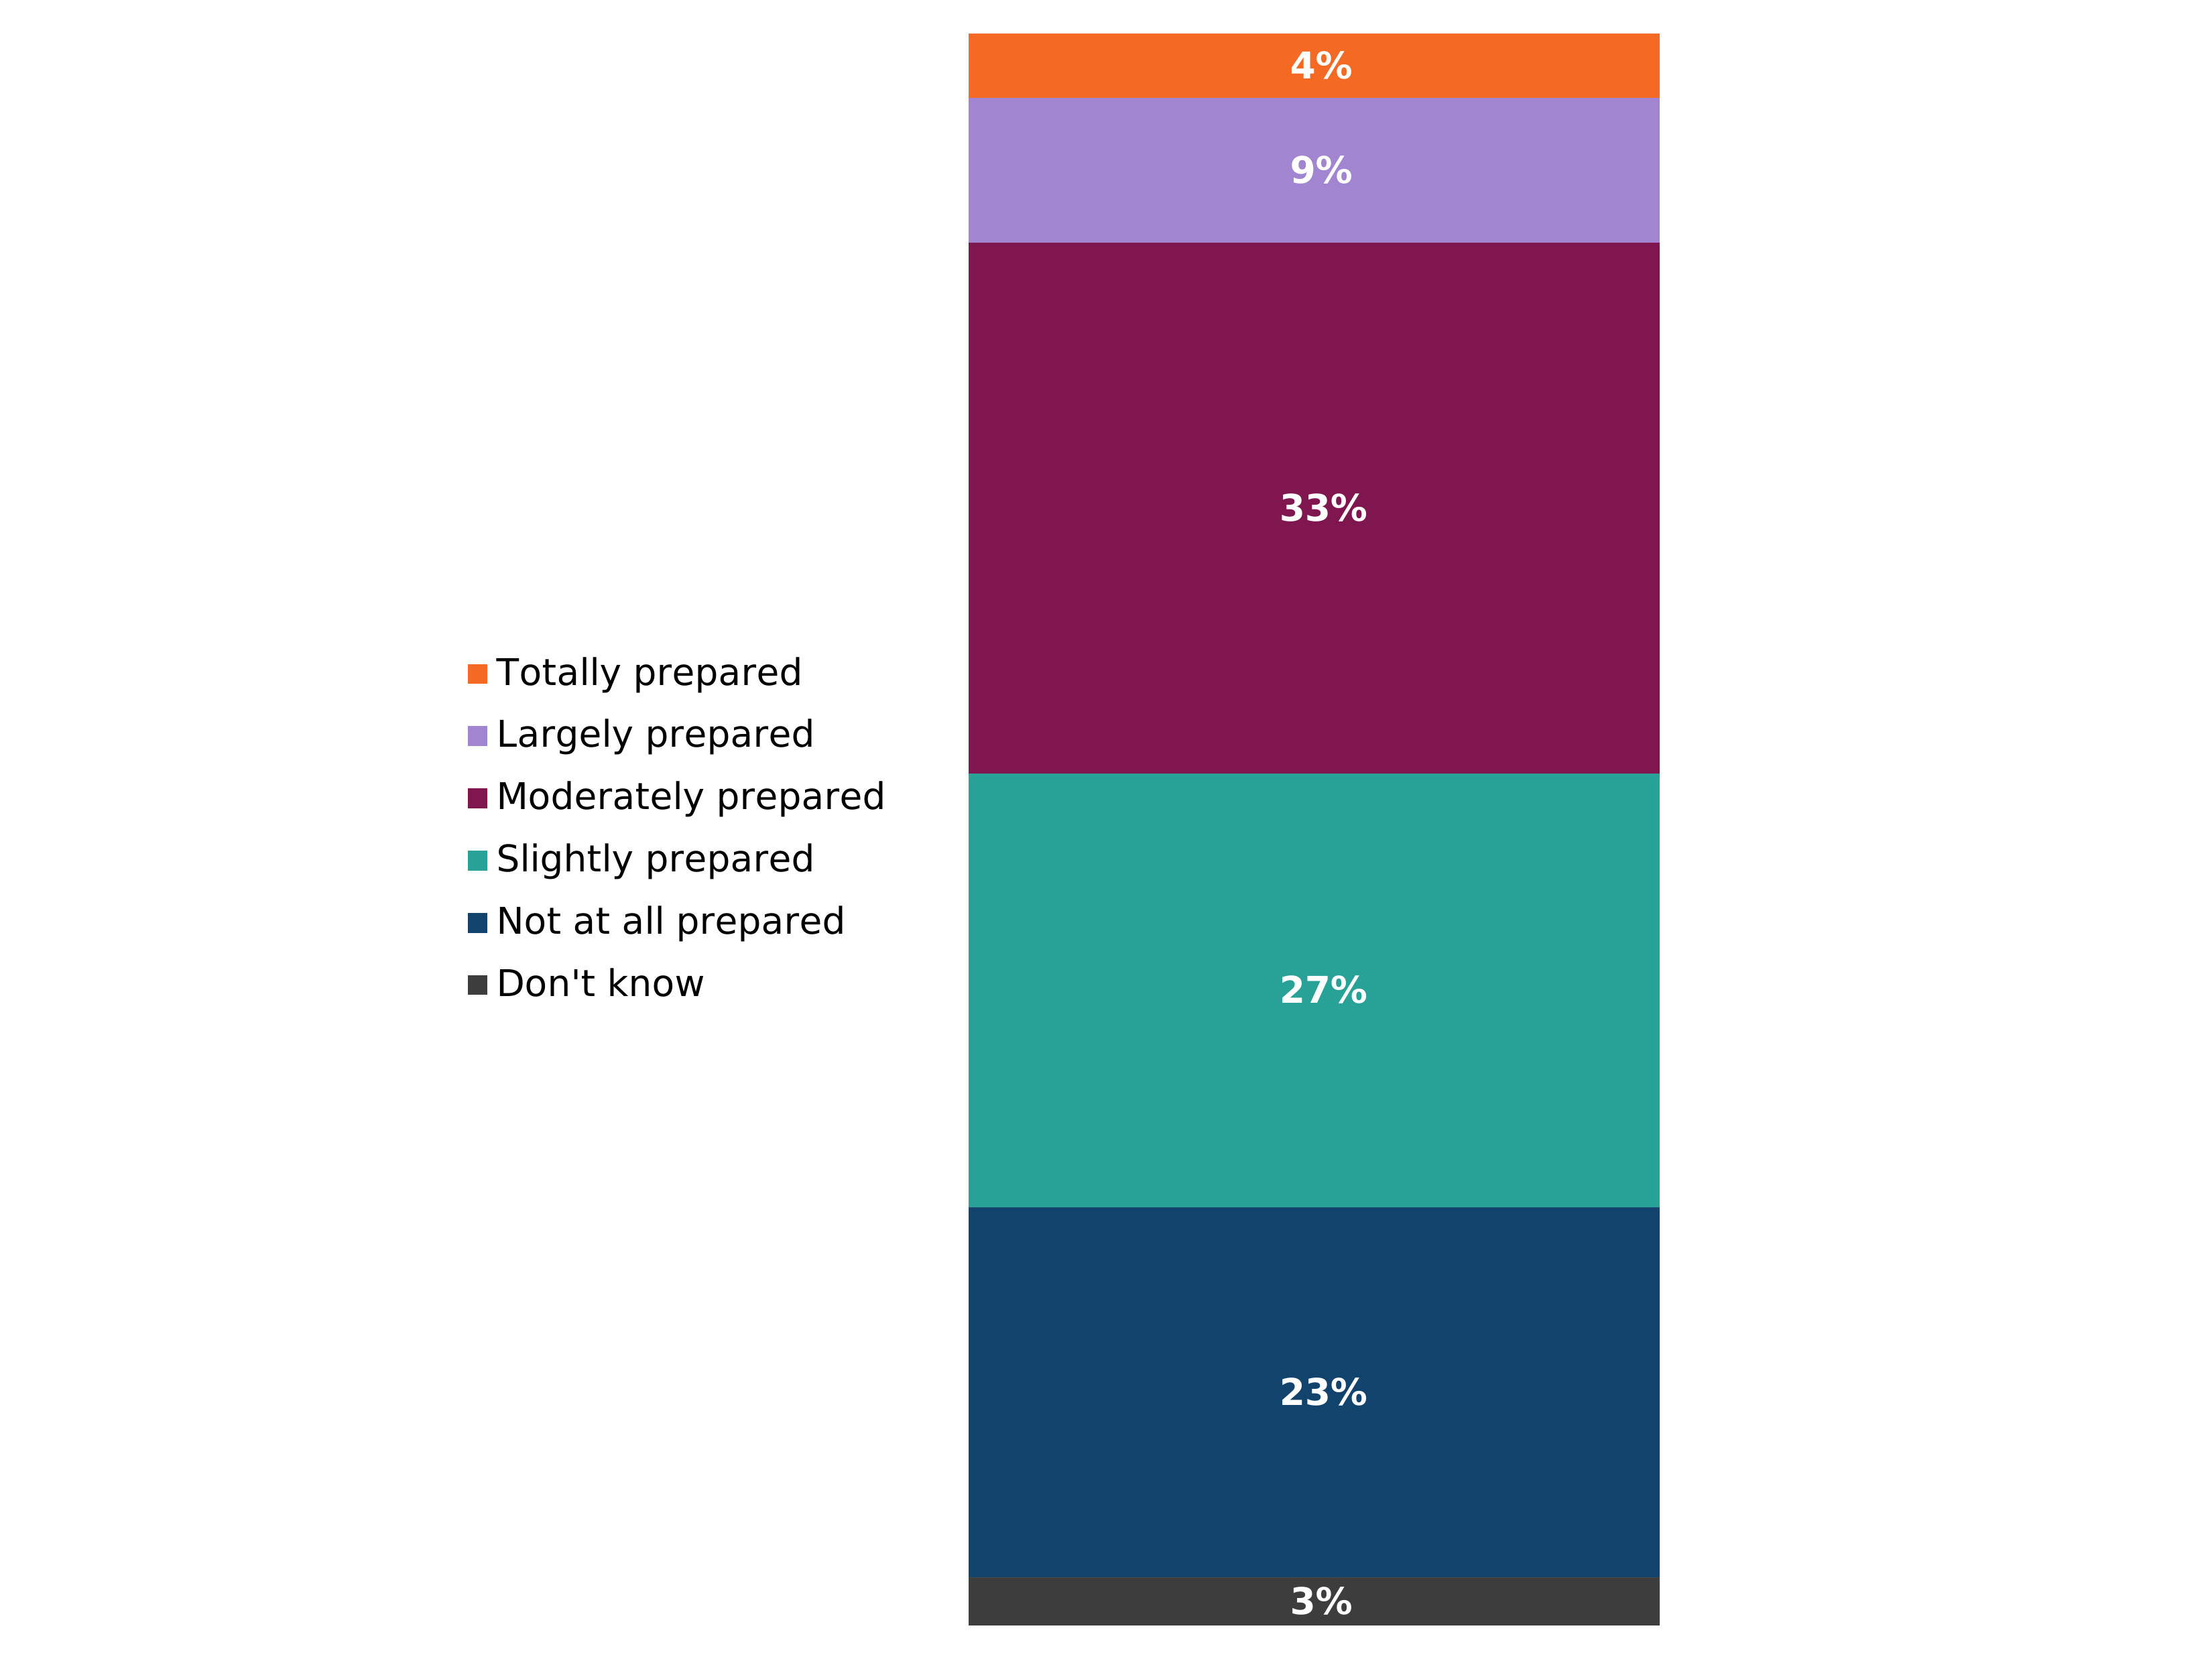
Figure note:
Source: Q5. How prepared, if it all, do you feel your household is for an emergency/disaster? By ‘your household’ we mean one person living alone or a group of people (not necessarily related) living at your address who share cooking facilities with you and also share a living room or sitting room or dining area.
Base: All respondents in UK sample, 2026 (n=10,791).
Due to rounding, the percentages for Q5 add up to 99%.
Figure 2.4: 2025 to 2026 comparison of how prepared respondents felt their households were for an emergency/disaster (showing % of respondents) (see UK WoW table 44 (ODS, 1.47MB))
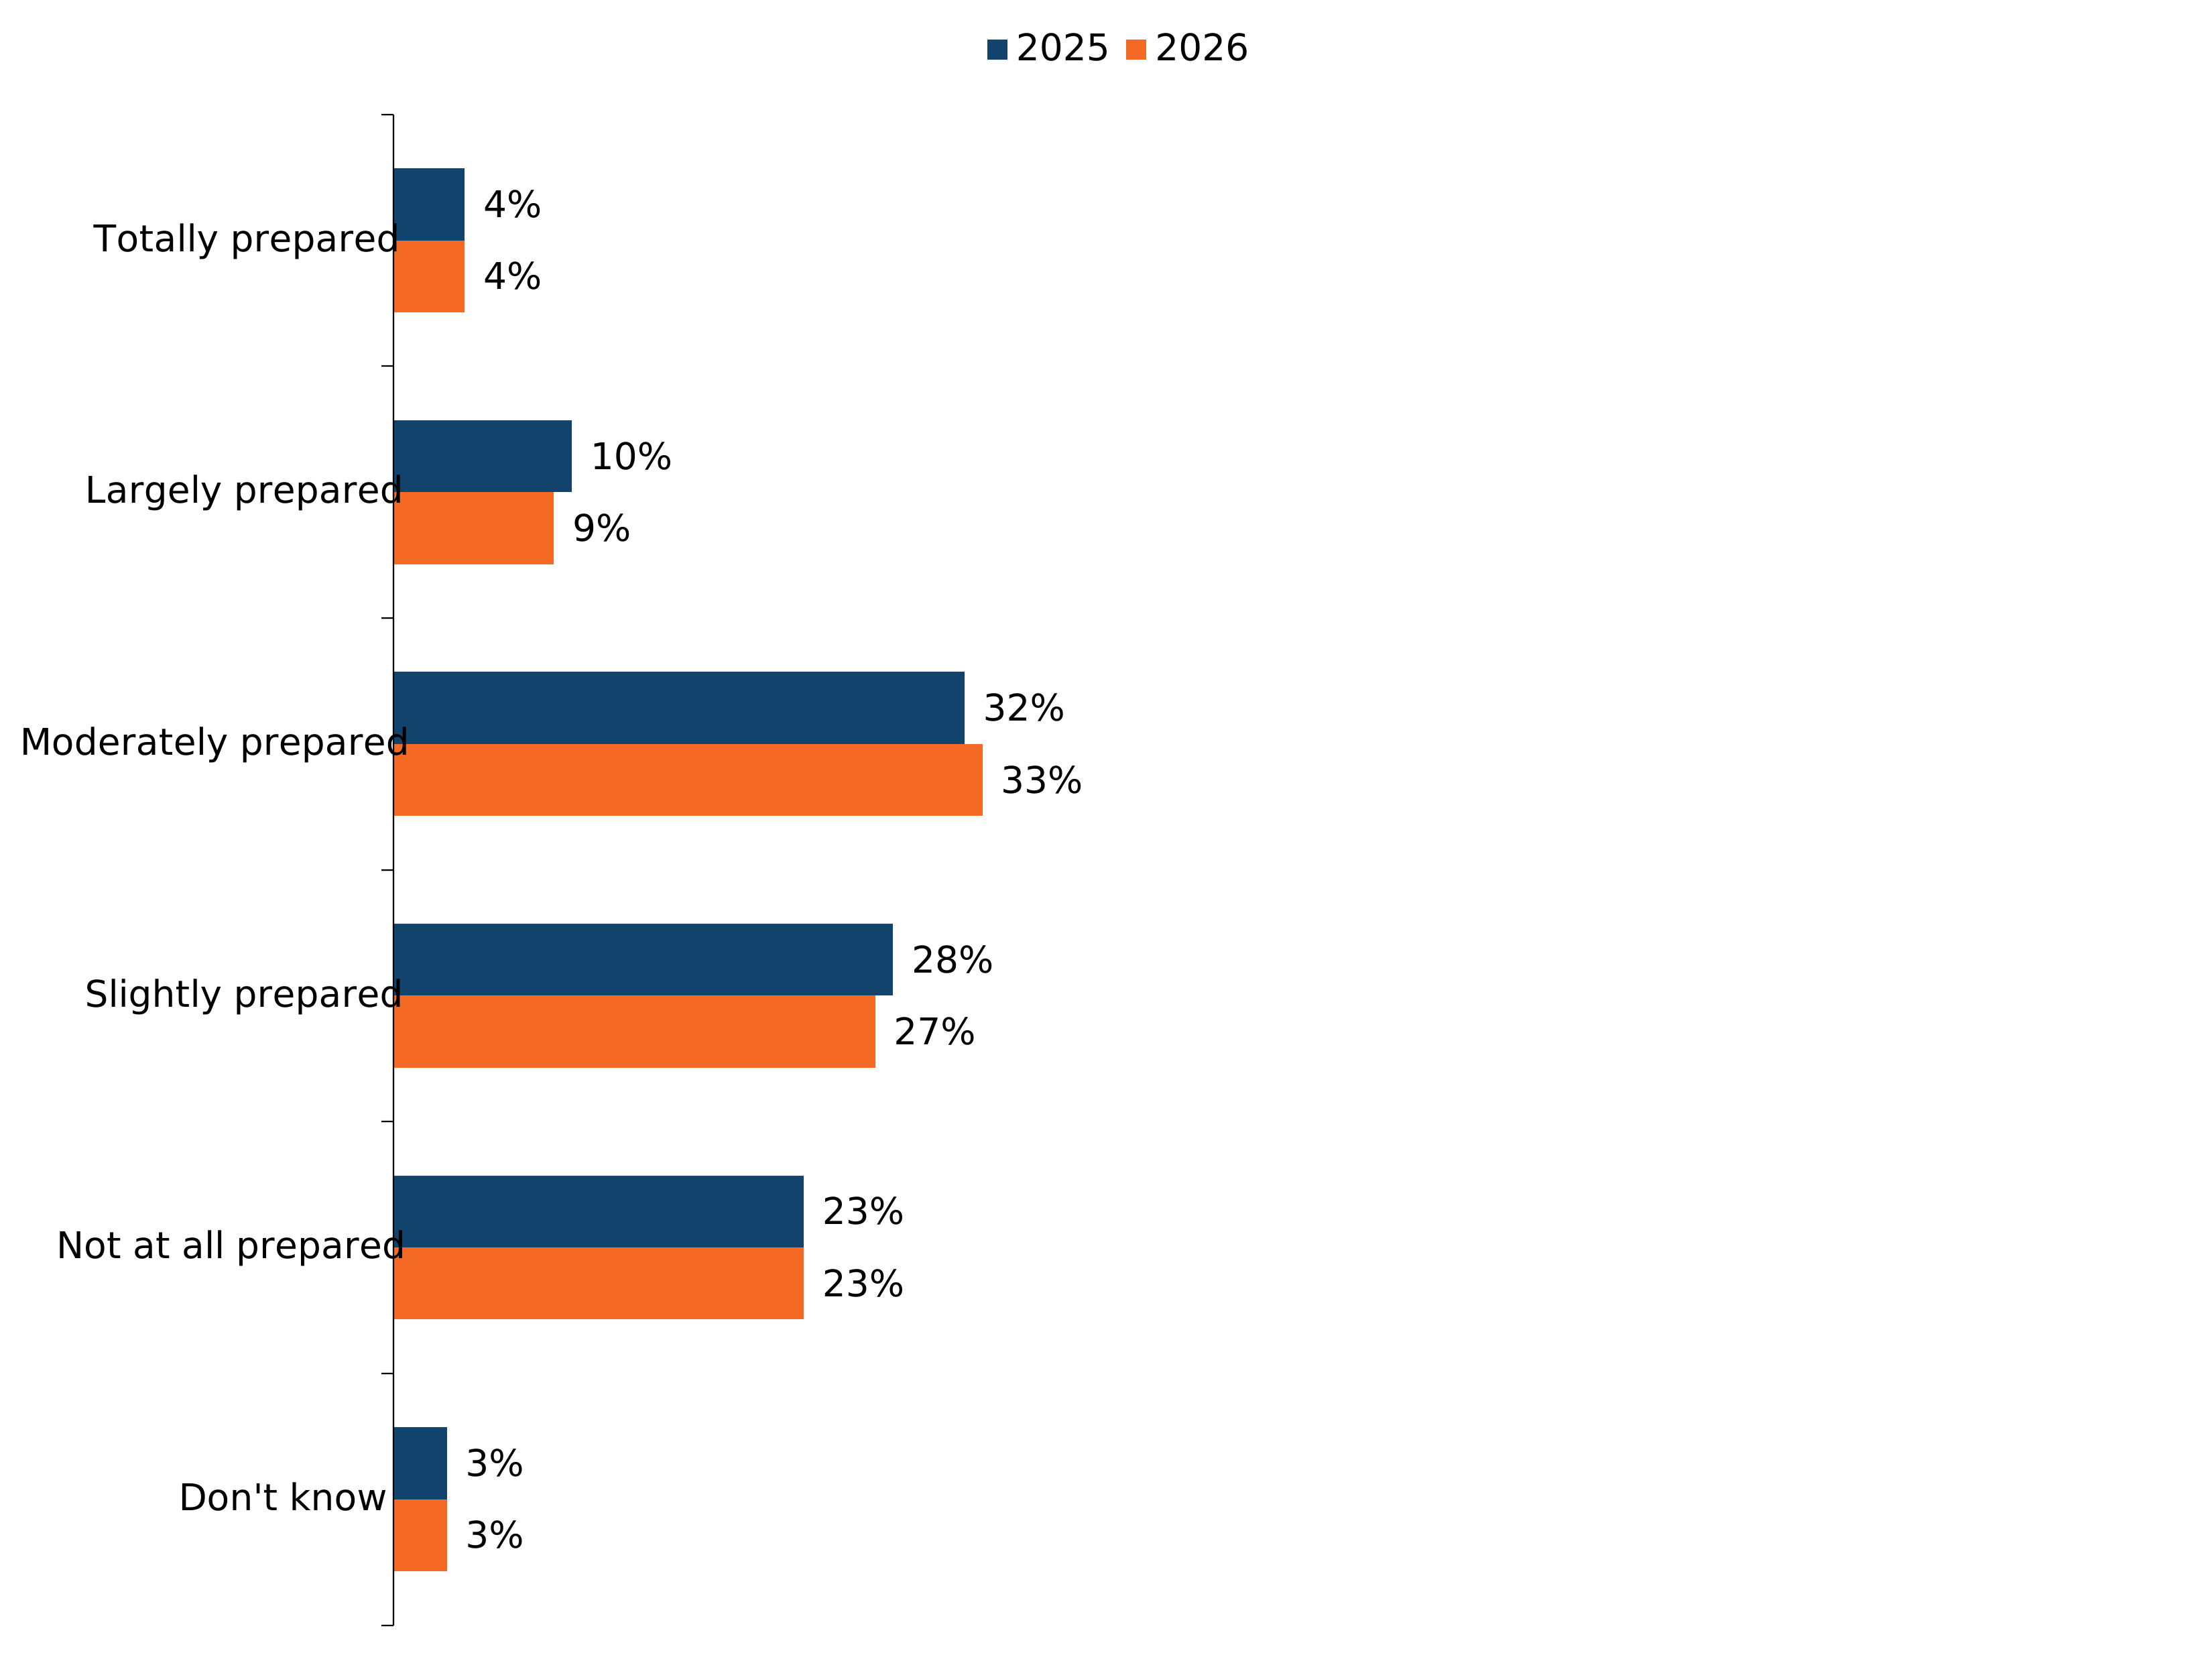
Figure note:
Source: Q5. How prepared, if it all, do you feel your household is for an emergency/disaster? By ‘your household’ we mean one person living alone or a group of people (not necessarily related) living at your address who share cooking facilities with you and also share a living room or sitting room or dining area.
Data shown are for 2025 (Wave 1) and 2026 (Wave 2).
Base: All respondents in UK sample 2025 (n=10,536); 2026 (n=10,791).
Due to rounding, the percentages for Q5 add up to 99% in 2026.
14% of survey respondents felt that the authorities that operate in their local area were largely or totally prepared for an emergency/disaster, and 30% felt authorities were moderately prepared, while 45% believed that the authorities were slightly or not at all prepared for an emergency/disaster and 11% said they did not know.
Perceptions of local authority preparedness were broadly unchanged compared to 2025, with the proportion feeling authorities were largely or totally prepared (14%) and moderately prepared (30%) remaining stable since 2025. There was a slight decrease in those feeling authorities were at least slightly prepared (70% to 68%), driven by a small increase in those feeling authorities were not at all prepared from 20% in 2025 to 22% in 2026.
Figure 2.5: How prepared survey respondents felt the authorities that operate in their local area were for an emergency/disaster (showing % of respondents) (see UK 2026 table 45 (ODS, 1.15MB))
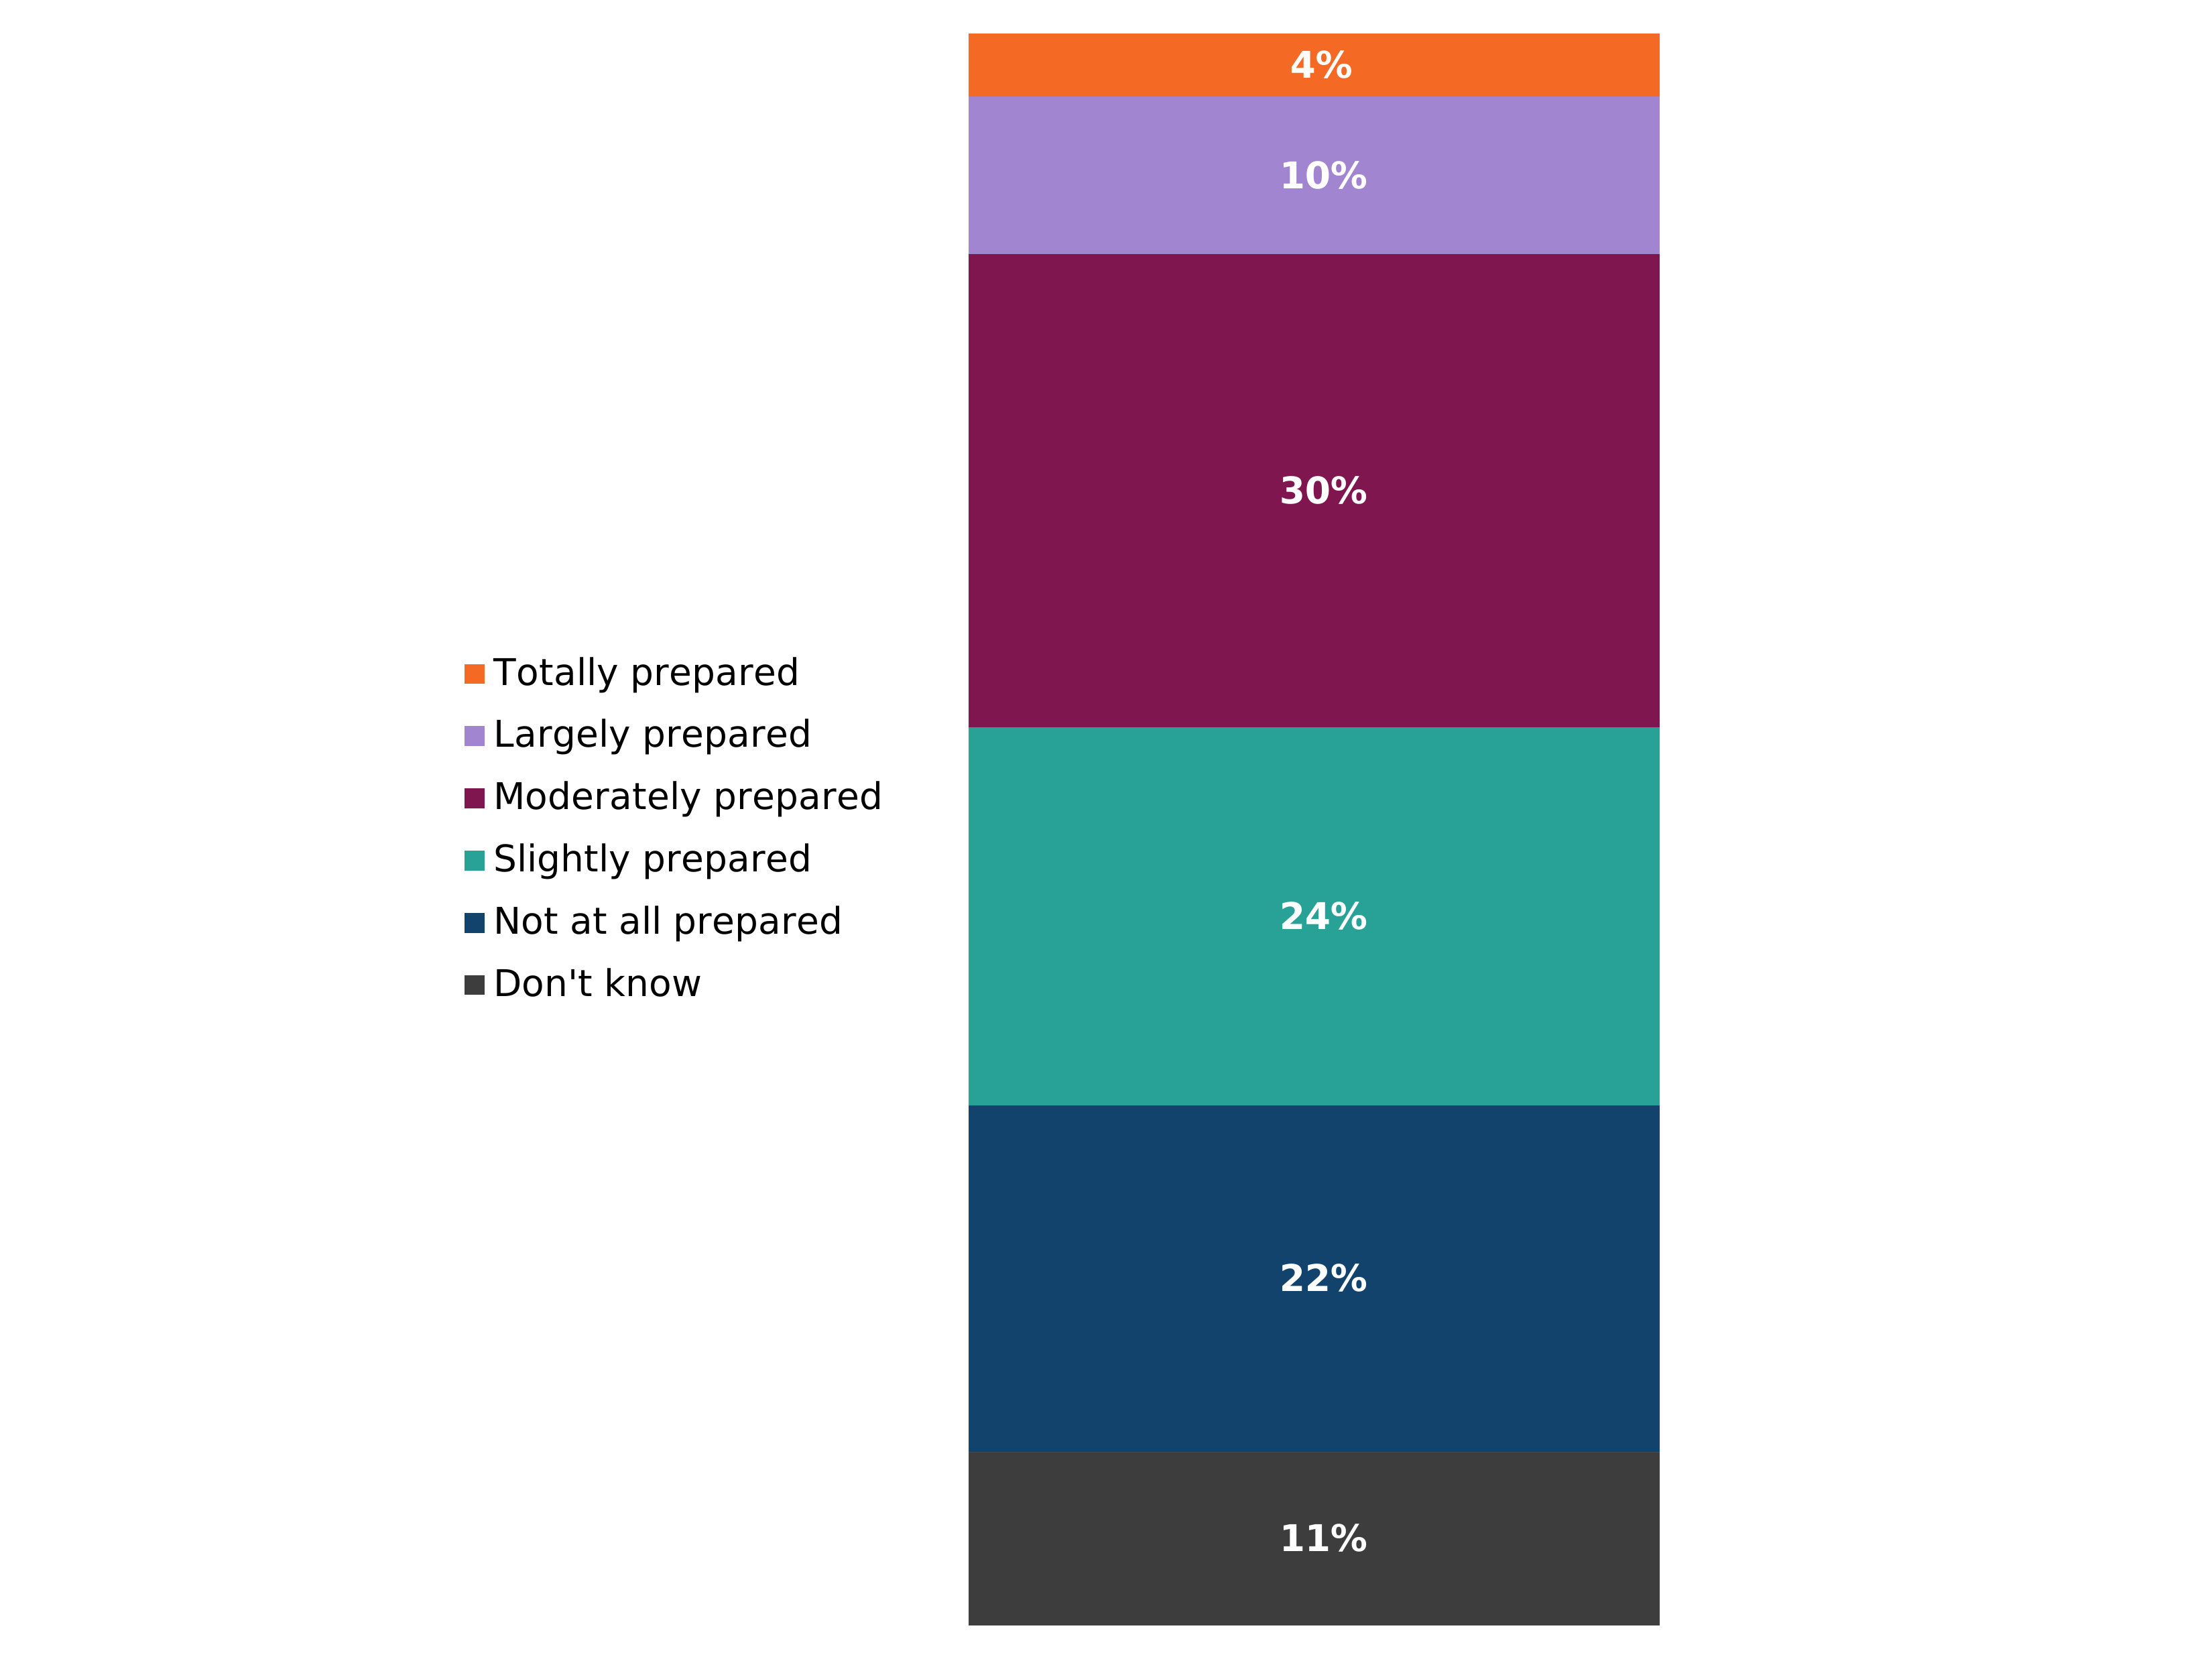
Figure note:
Source: Q6. How prepared, if at all, do you feel the authorities that operate in your local area are for an emergency/disaster? By authorities we mean your local council, emergency services and utility providers (water/gas/electric companies).
Base: All respondents in UK sample, 2026 (n=10,791).
Due to rounding, the percentages for Q6 add up to 101%.
Figure 2.6: 2025 to 2026 comparison of how prepared survey respondents felt the authorities that operate in their local area were for an emergency/disaster (showing % of respondents) (see UK WoW table 45 (ODS, 1.47MB))
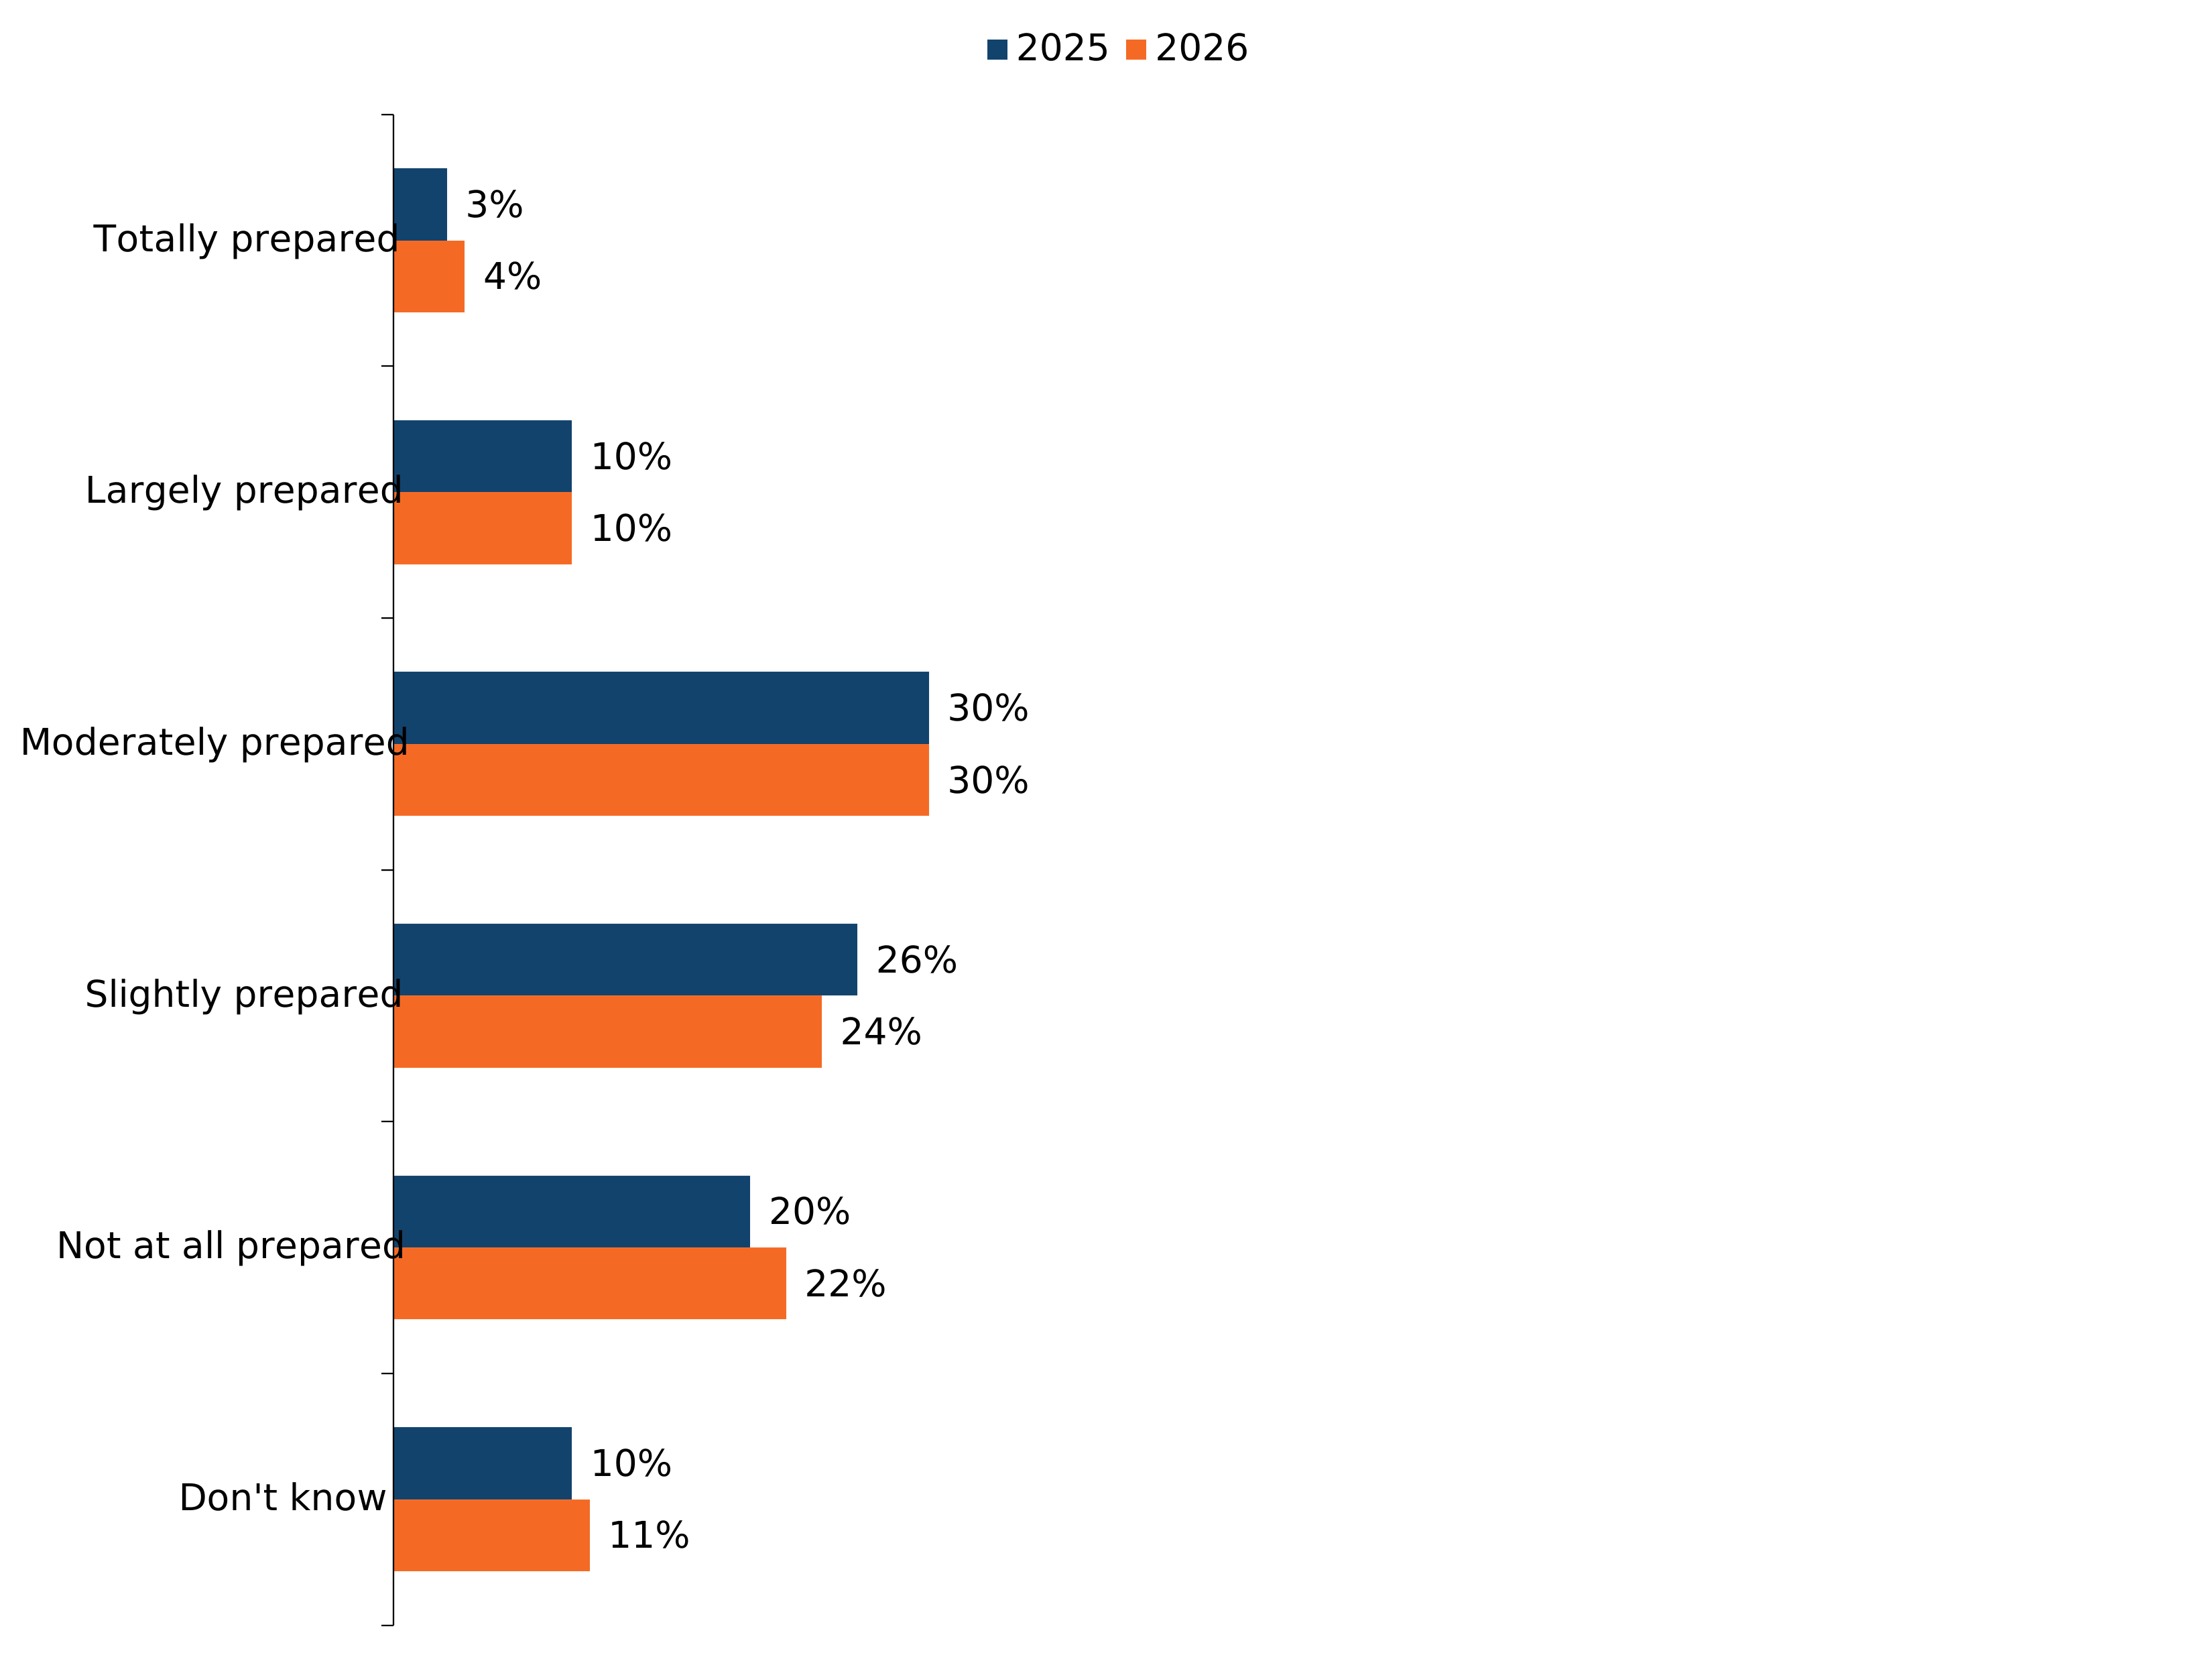
Figure note:
Source: Q6. How prepared, if at all, do you feel the authorities that operate in your local area are for an emergency/disaster? By authorities we mean your local council, emergency services and utility providers (water/gas/electric companies).
Data shown are for 2025 (Wave 1) and 2026 (Wave 2).
Base: All respondents in UK sample, 2025 (n=10,536); 2026 (n=10,791).
Due to rounding, the percentages for Q6 add up to 99% in 2025 and 101% in 2026.
10% of respondents felt that their local community, defined as ‘people who live 15-20mins walk away from their house’, was largely or totally prepared for an emergency/disaster and 26% felt their community was moderately prepared. This compared to 52% who believed their local community was slightly or not at all prepared and 12% who said they did not know.
Perceptions of community preparedness were broadly stable compared to 2025, with the proportion feeling their local community was largely or totally prepared (10%) and moderately prepared (26%) remaining unchanged. There was a slight decrease in those saying their local community was slightly or not at all prepared (54% to 52%).
Figure 2.7: How prepared respondents felt that their local community was for an emergency/disaster (showing % of respondents) (see table 46 (ODS, 1.15MB))
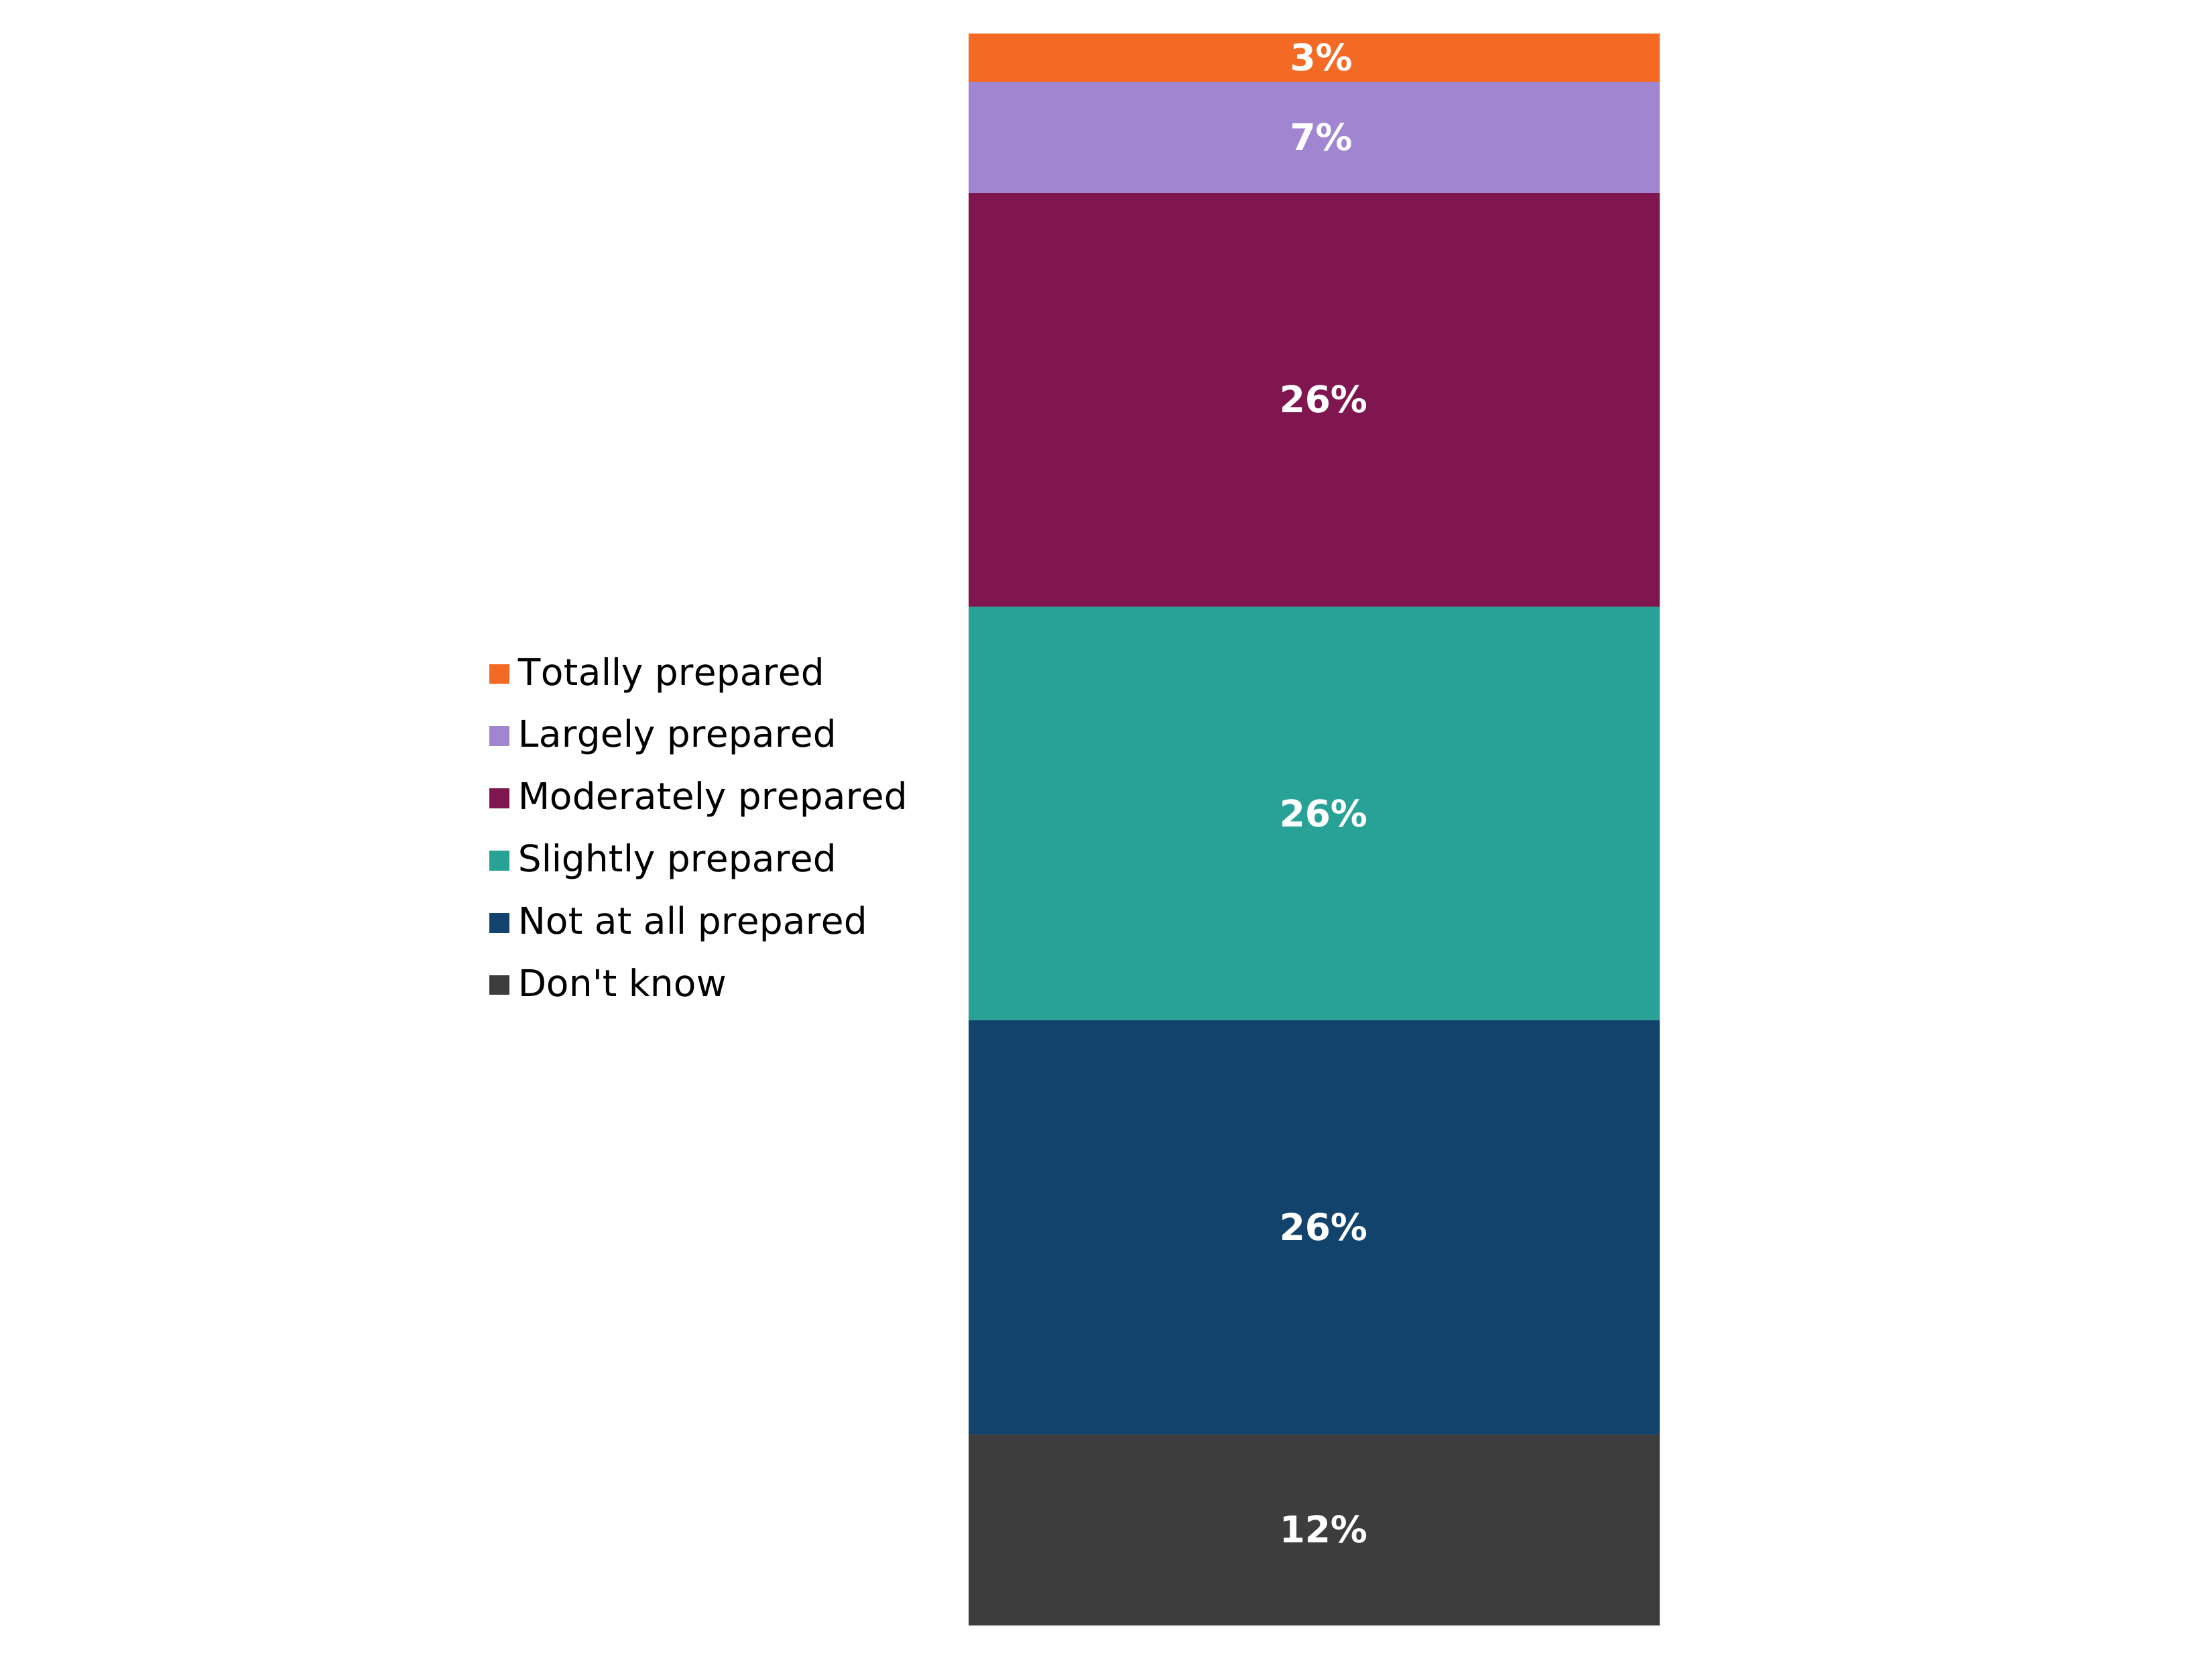
Figure note:
Source: Q7. How prepared, if at all, do you feel your local community is for an emergency/disaster? By local community we mean the people who live within a 15-20 minute walk of your house.
Base: All respondents in UK sample, 2026 (n=10,791).
Base: All respondents in UK sample, 2026 (n=10,791).
Figure 2.8: 2025 to 2026 comparison of how prepared respondents felt that their local community was for an emergency/disaster (showing % of respondents) (see UK WoW table 46 (ODS, 1.47MB))
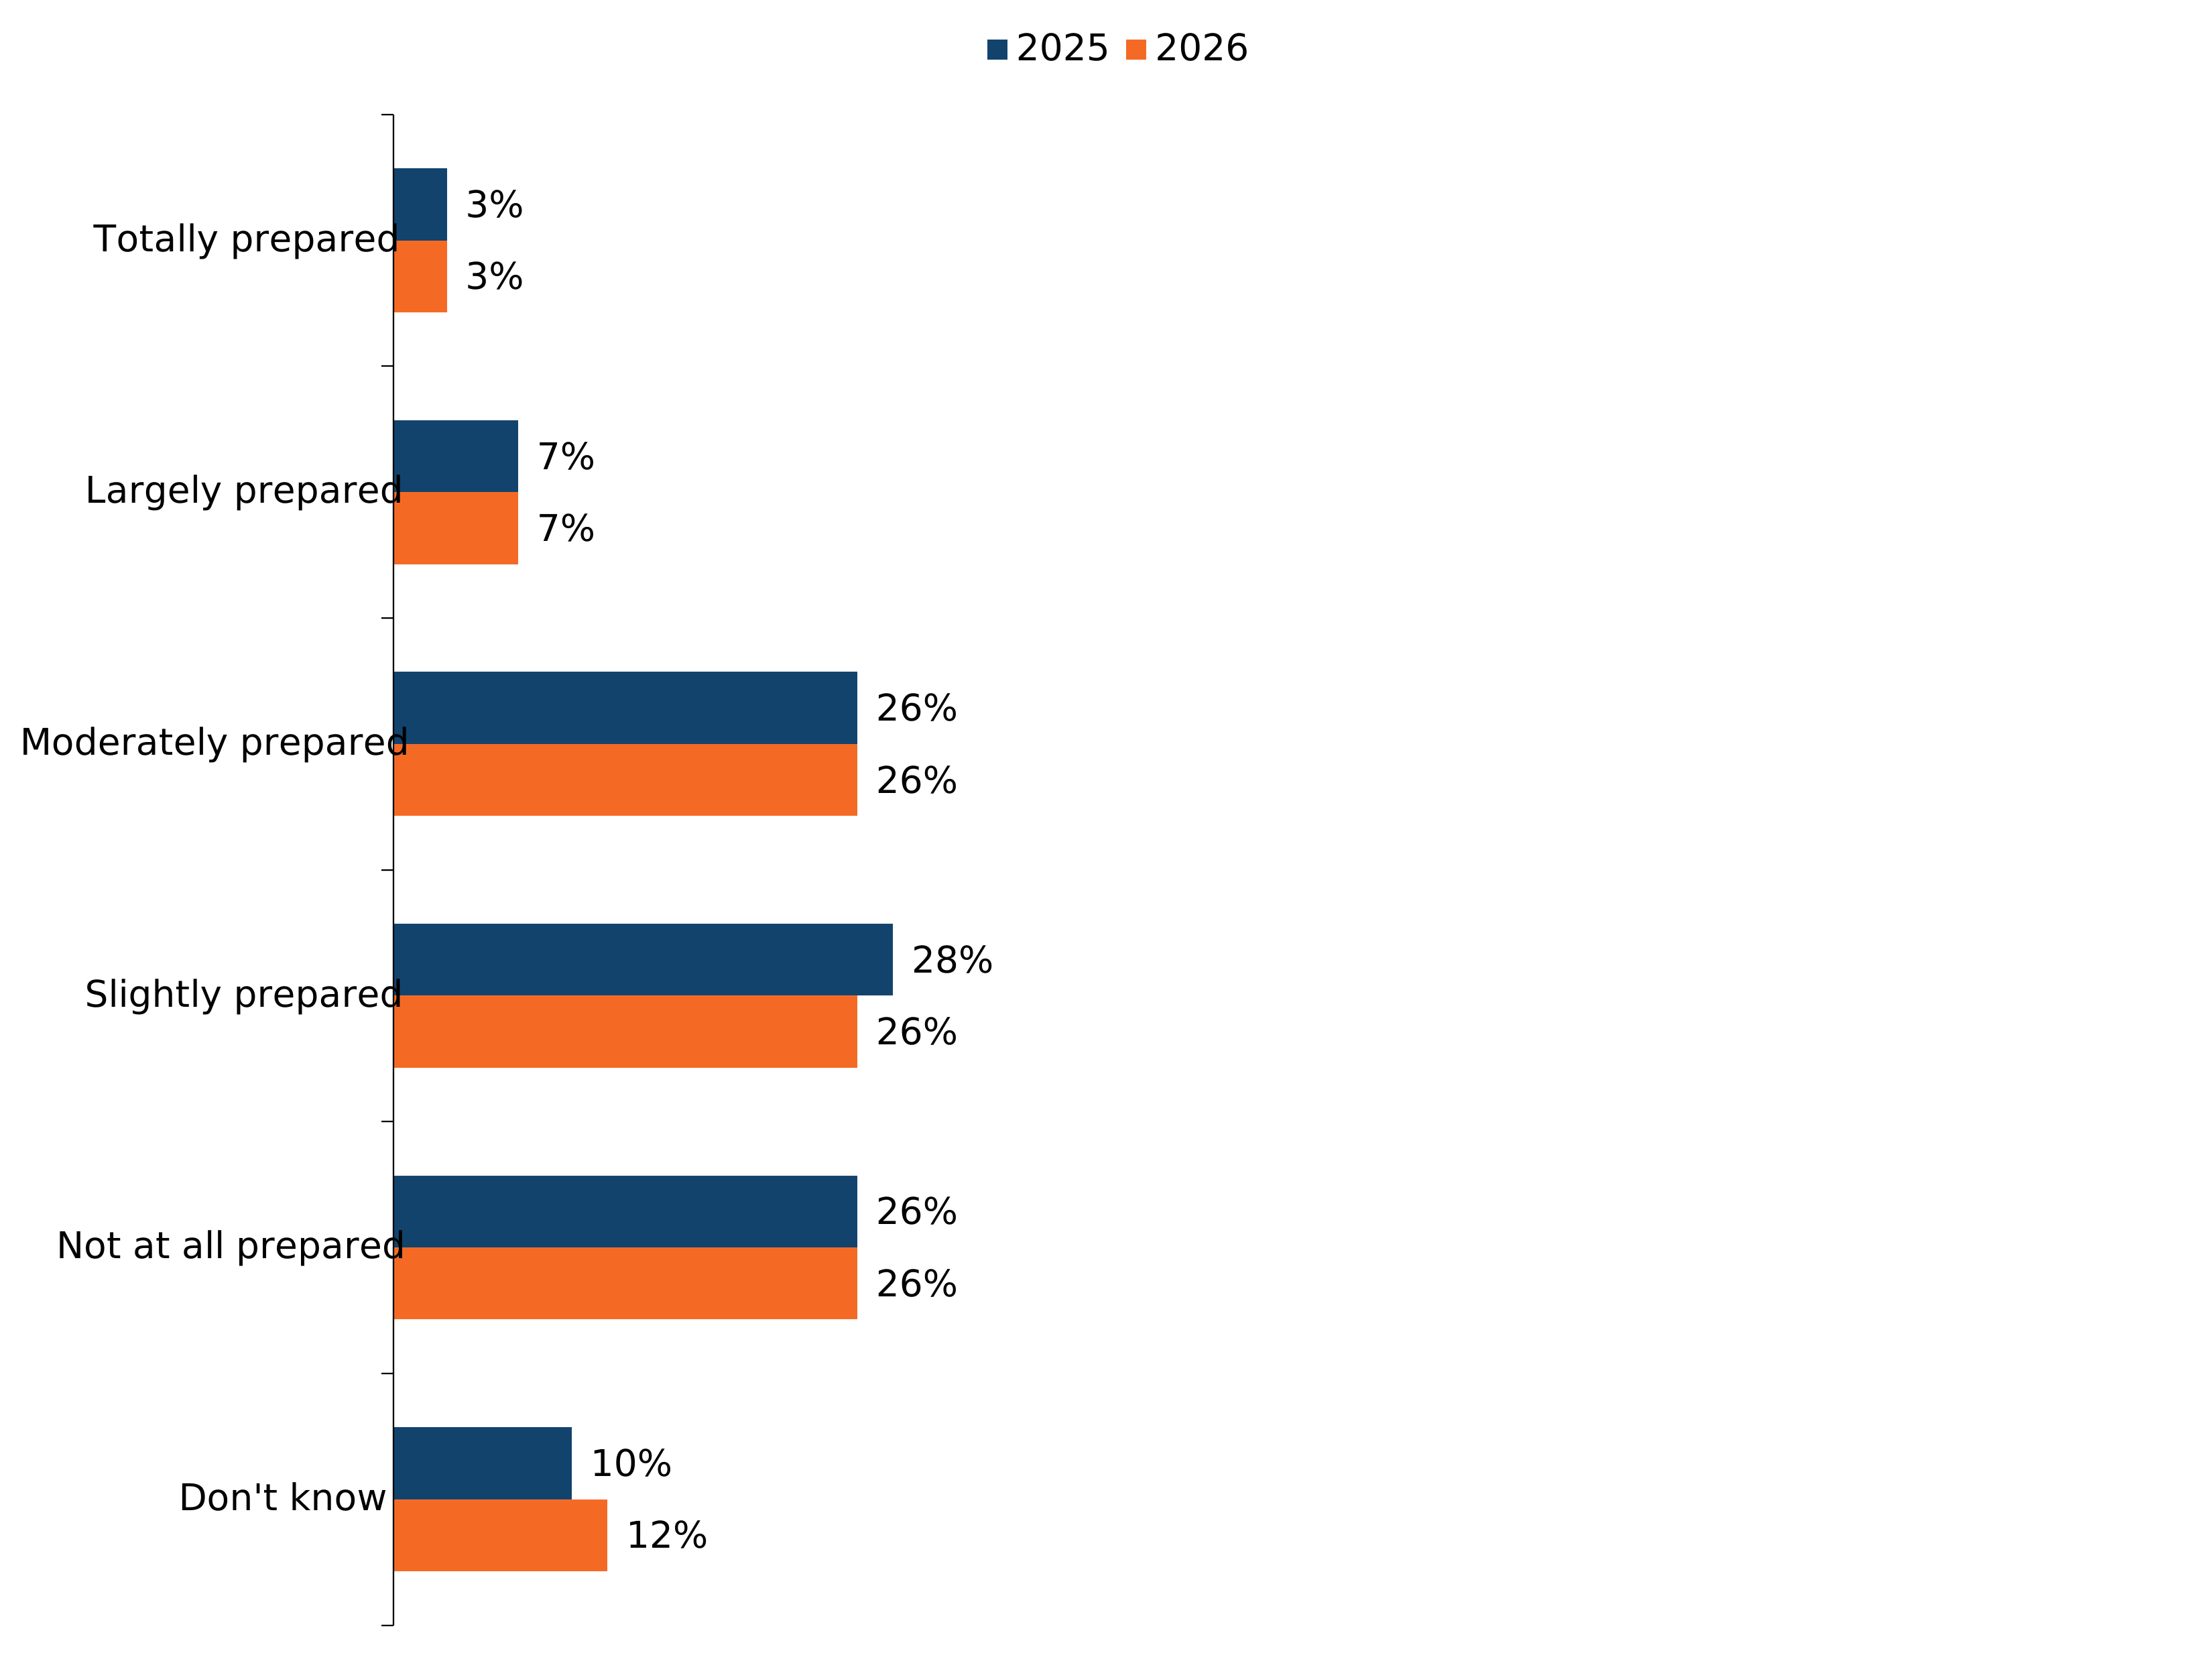
Figure note:
Source: Q7. How prepared, if at all, do you feel your local community is for an emergency/disaster? By local community we mean the people who live within a 15-20 minute walk of your house.
Data shown are for 2025 (Wave 1) and 2026 (Wave 2).
Base: All respondents in UK sample, 2025 (n=10,536); 2026 (n=10,791).
14% of respondents felt that the UK as a whole was largely or totally prepared for an emergency, and 28% felt the UK was moderately prepared. This compared to 51% who felt the UK as a whole was slightly or not at all prepared for an emergency/disaster and 6% who said they did not know.
Compared to 2025, perceptions of UK-wide preparedness showed a modest decline. The proportion feeling the UK was largely or totally prepared fell marginally from 15% to 14%, while those feeling the UK was not at all prepared increased from 20% to 24%. This contributed to a five percentage point drop in those feeling the UK was at least slightly prepared (75% to 70%).
Figure 2.9: How prepared respondents felt that the UK as a whole was for an emergency/disaster (showing % of respondents) (see UK 2026 table 47 (ODS, 1.15MB))
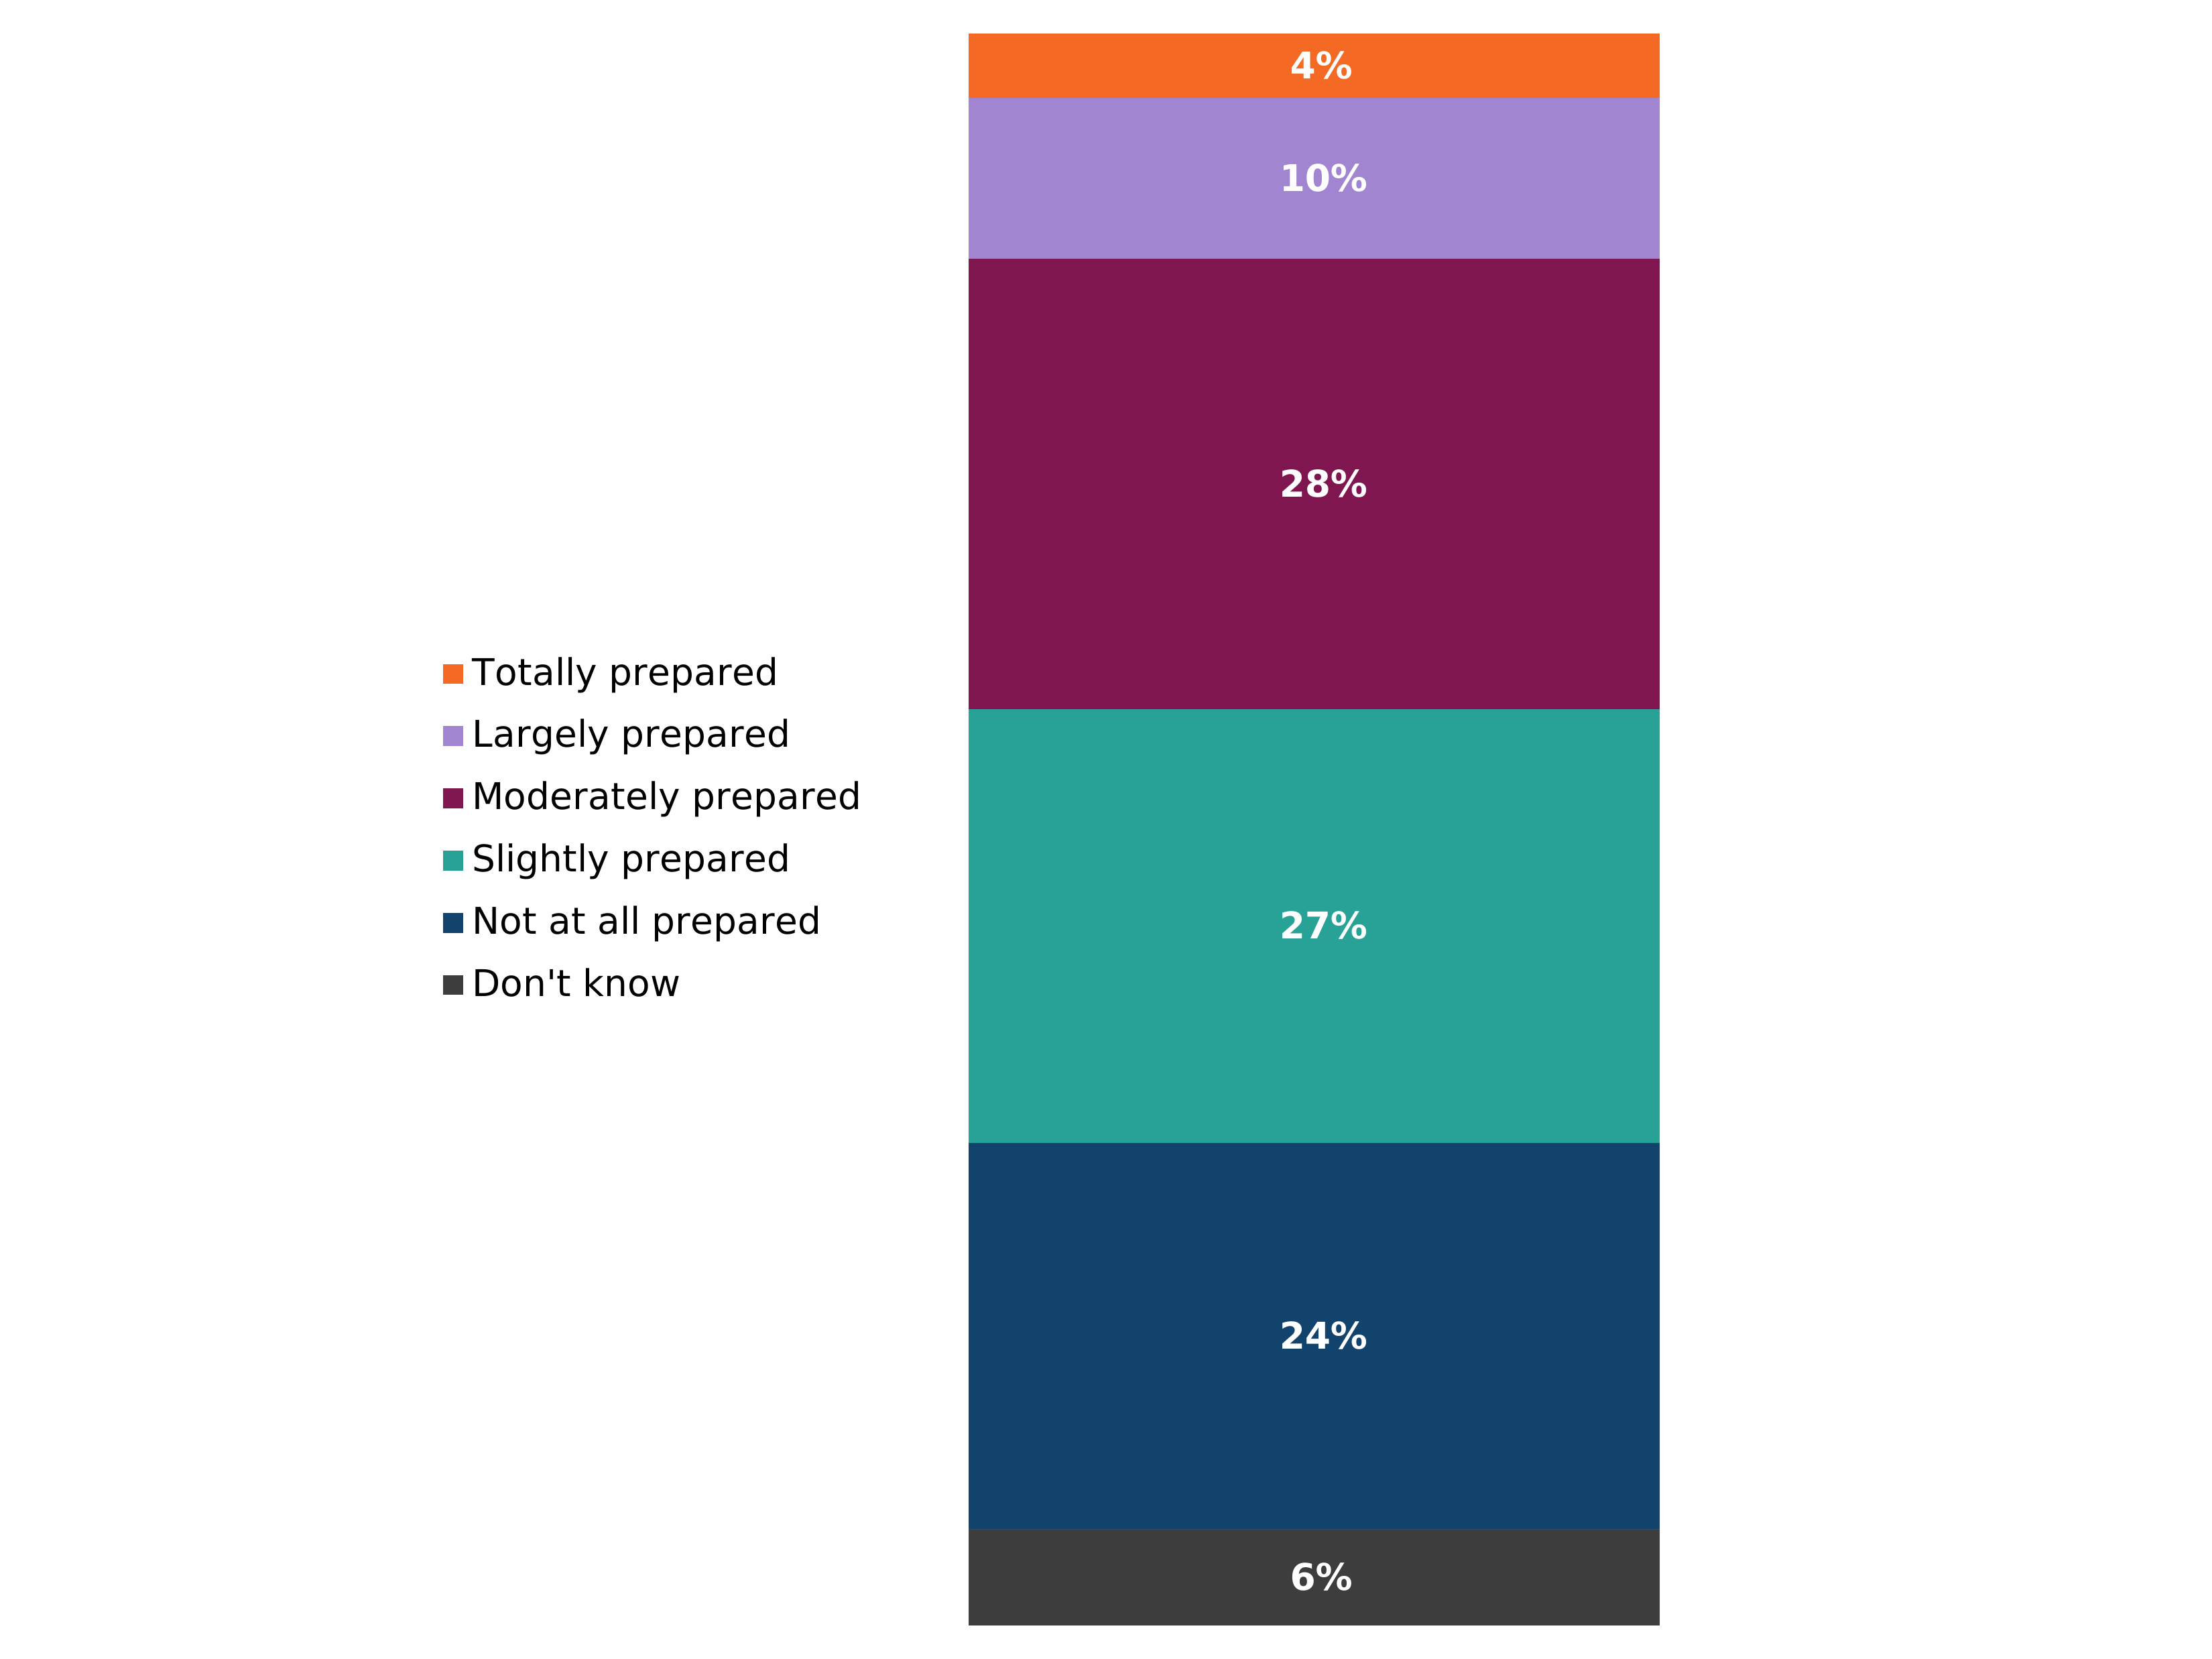
Figure note:
Source: Q8. How prepared, if at all, do you feel the UK as a whole is for an emergency/disaster?
Base: All respondents in UK sample (n=10,791).
Due to rounding, the percentages for Q8 add up to 99%.
Figure 2.10: 2025 to 2026 comparison of how prepared respondents felt that the UK as a whole was for an emergency/disaster (showing % of respondents) (see table 47 (ODS, 1.15MB))
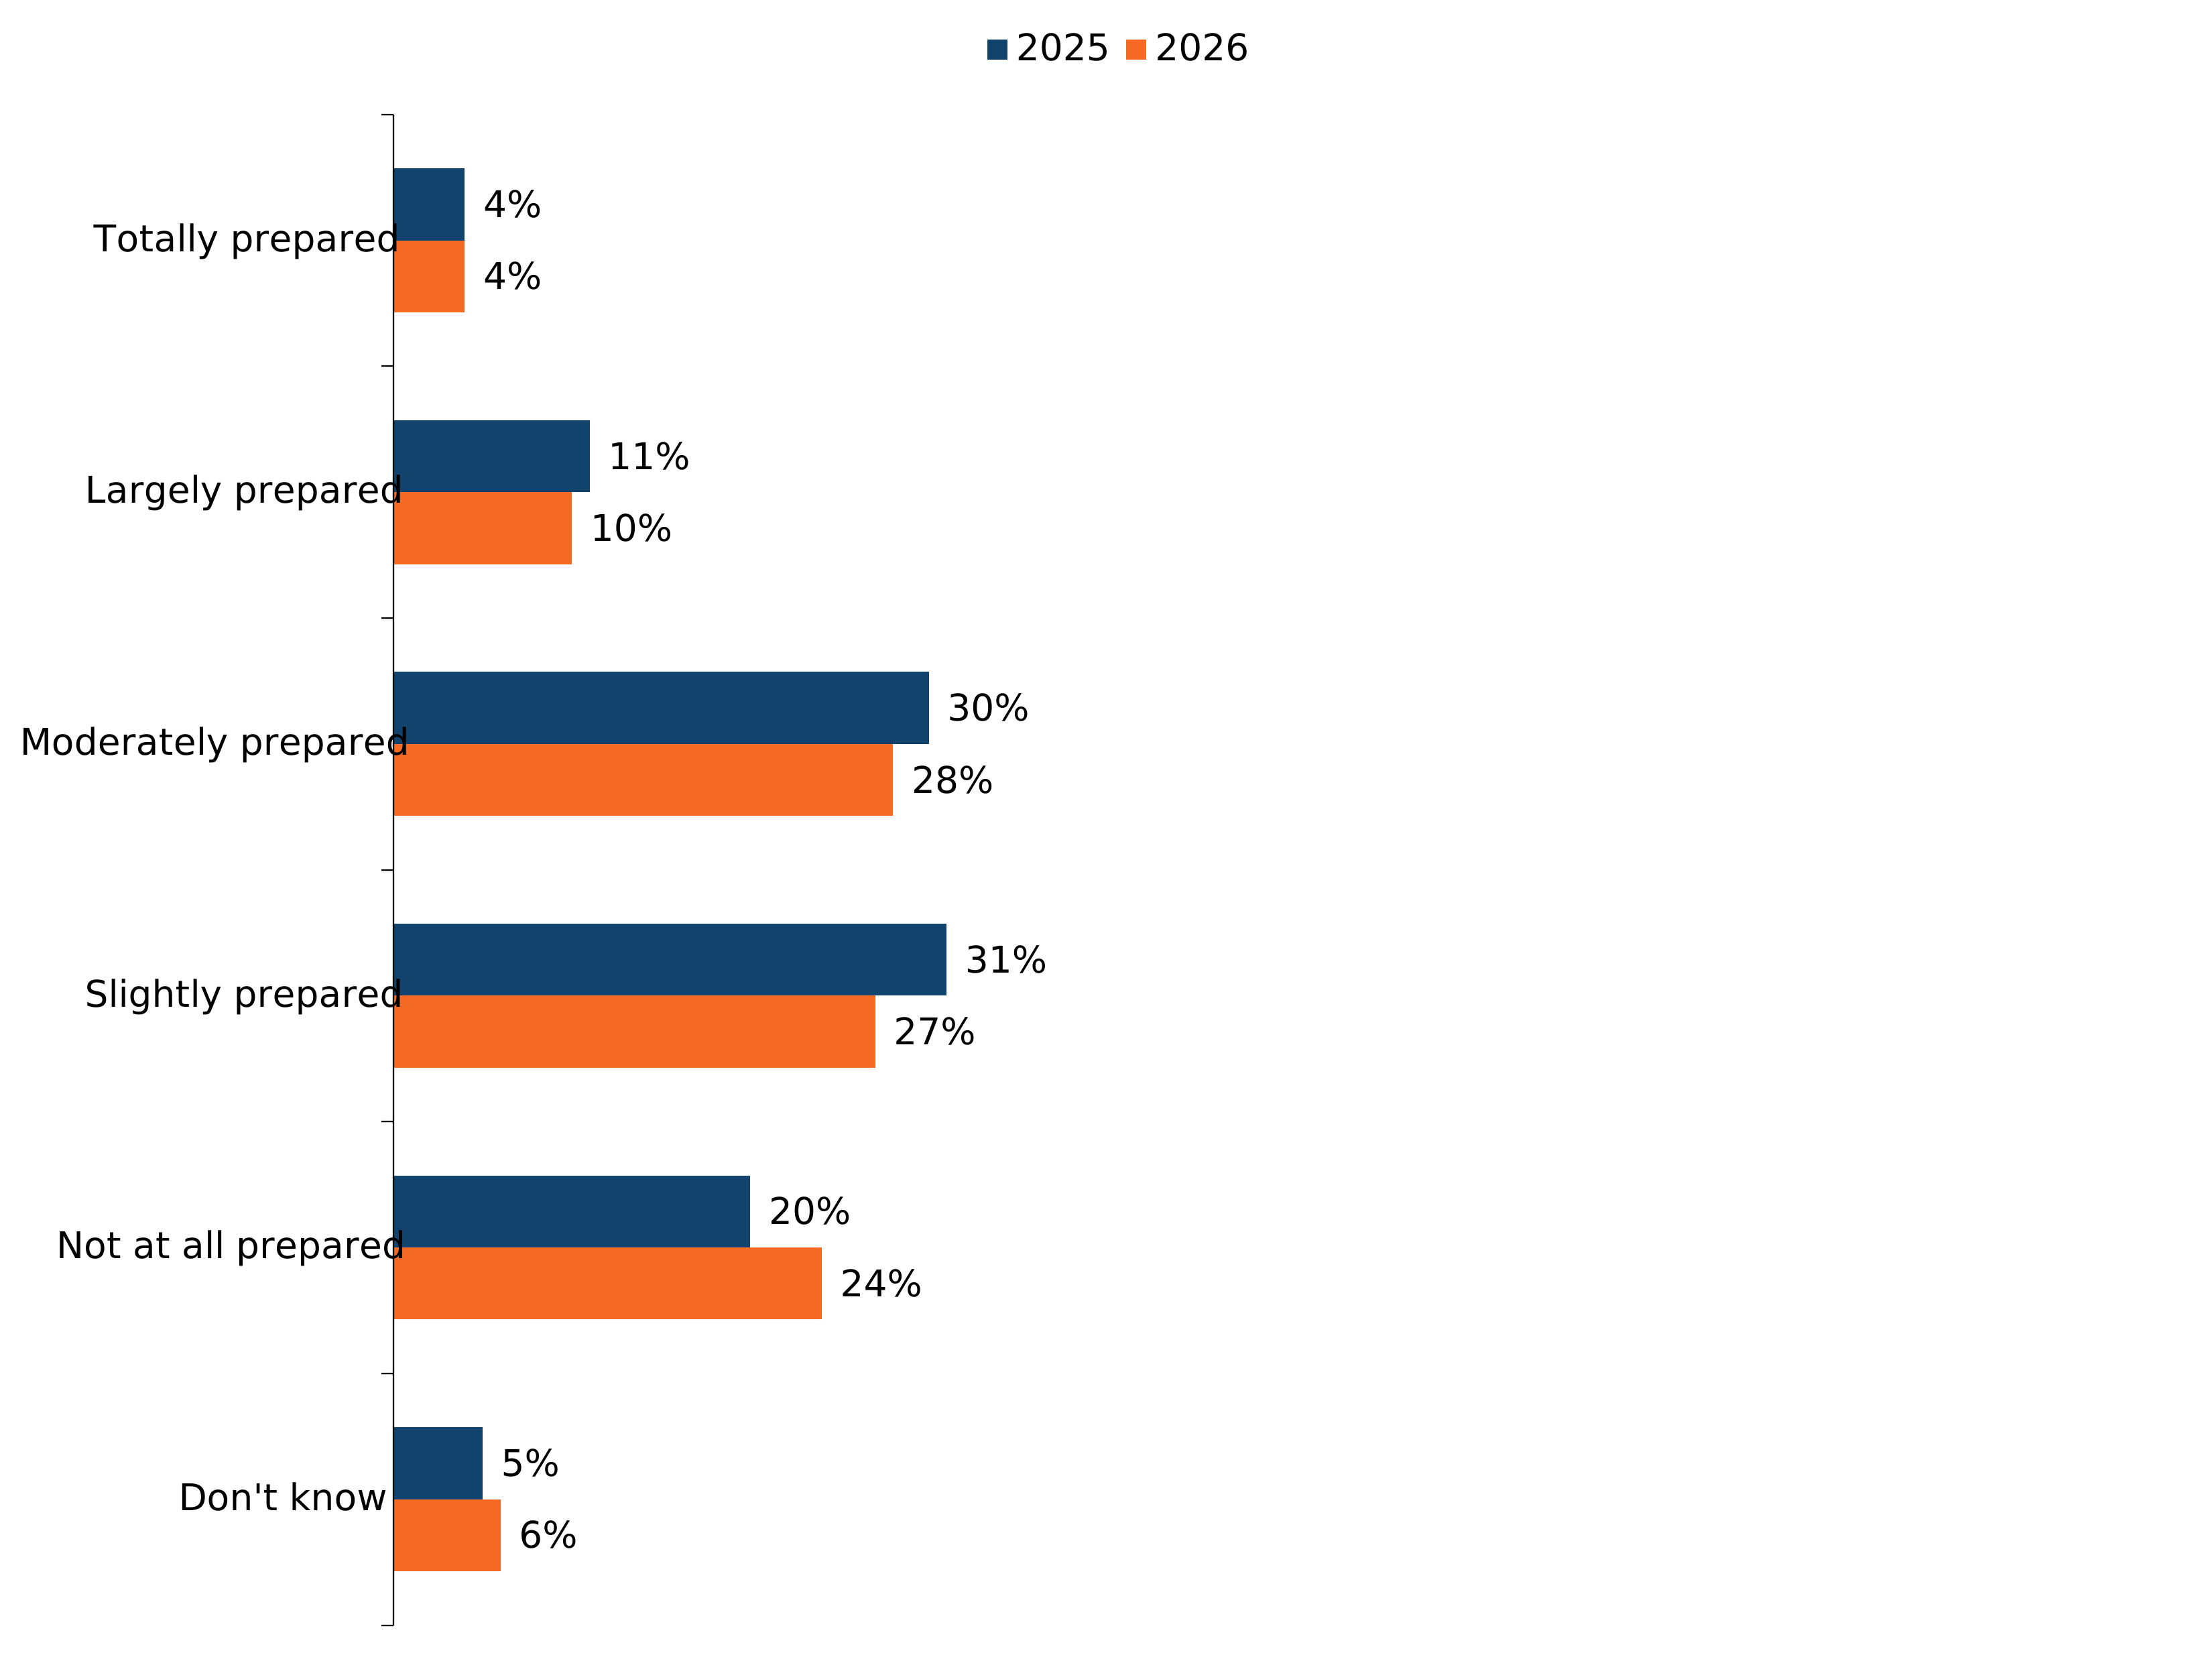
Figure note:
- Source: Q8. How prepared, if at all, do you feel the UK as a whole is for an emergency/disaster?
- Data shown are for 2025 (Wave 1) and 2026 (Wave 2).
- Base: All respondents in UK sample, 2025 (n=10,536); 2026 (n=10,791).
Due to rounding, the percentages for Q8 add up to 101% in 2025 and 99% in 2026.
Perceptions around responsibility for preparing for emergencies/disasters
The majority (82%) of respondents said that the UK Government should have full or a large amount of responsibility for preparing for emergencies/disasters that could affect their local area.
This compared to 66% who thought that the local council should have full or a large amount of responsibility and 26% who thought that voluntary organisations, charities or community groups should have full or a large amount of responsibility for preparing for emergencies/disasters that could affect their local area
31% of respondents thought they themselves should have a full or large amount of responsibility for preparing for emergencies/disasters that could affect their local area and a further 34% thought they should have a moderate amount of responsibility.
81% of survey respondents from Scotland, Wales and Northern Ireland thought that the devolved governments should have full or a large amount of responsibility for preparing for emergencies/disasters that could affect their local area.
Compared to 2025, the most notable change was a four percentage point decrease in the proportion attributing full or large responsibility to the UK Government (86% to 82%).
Note: Due to a need to reduce the length of this question, the 2026 questionnaire no longer asked for perceptions of responsibility for preparing for emergencies/disasters for the following:
- Emergency services
- Utility providers
- Voluntary organisations / charities and community groups (these options, previously kept separate, were combined into one option)
- Elected mayors
Figure 2.11: How much responsibility respondents thought different people/organisations should have for preparing for emergencies/disasters (showing % of respondents) (see UK 2026 table 48 (ODS, 1.15MB))
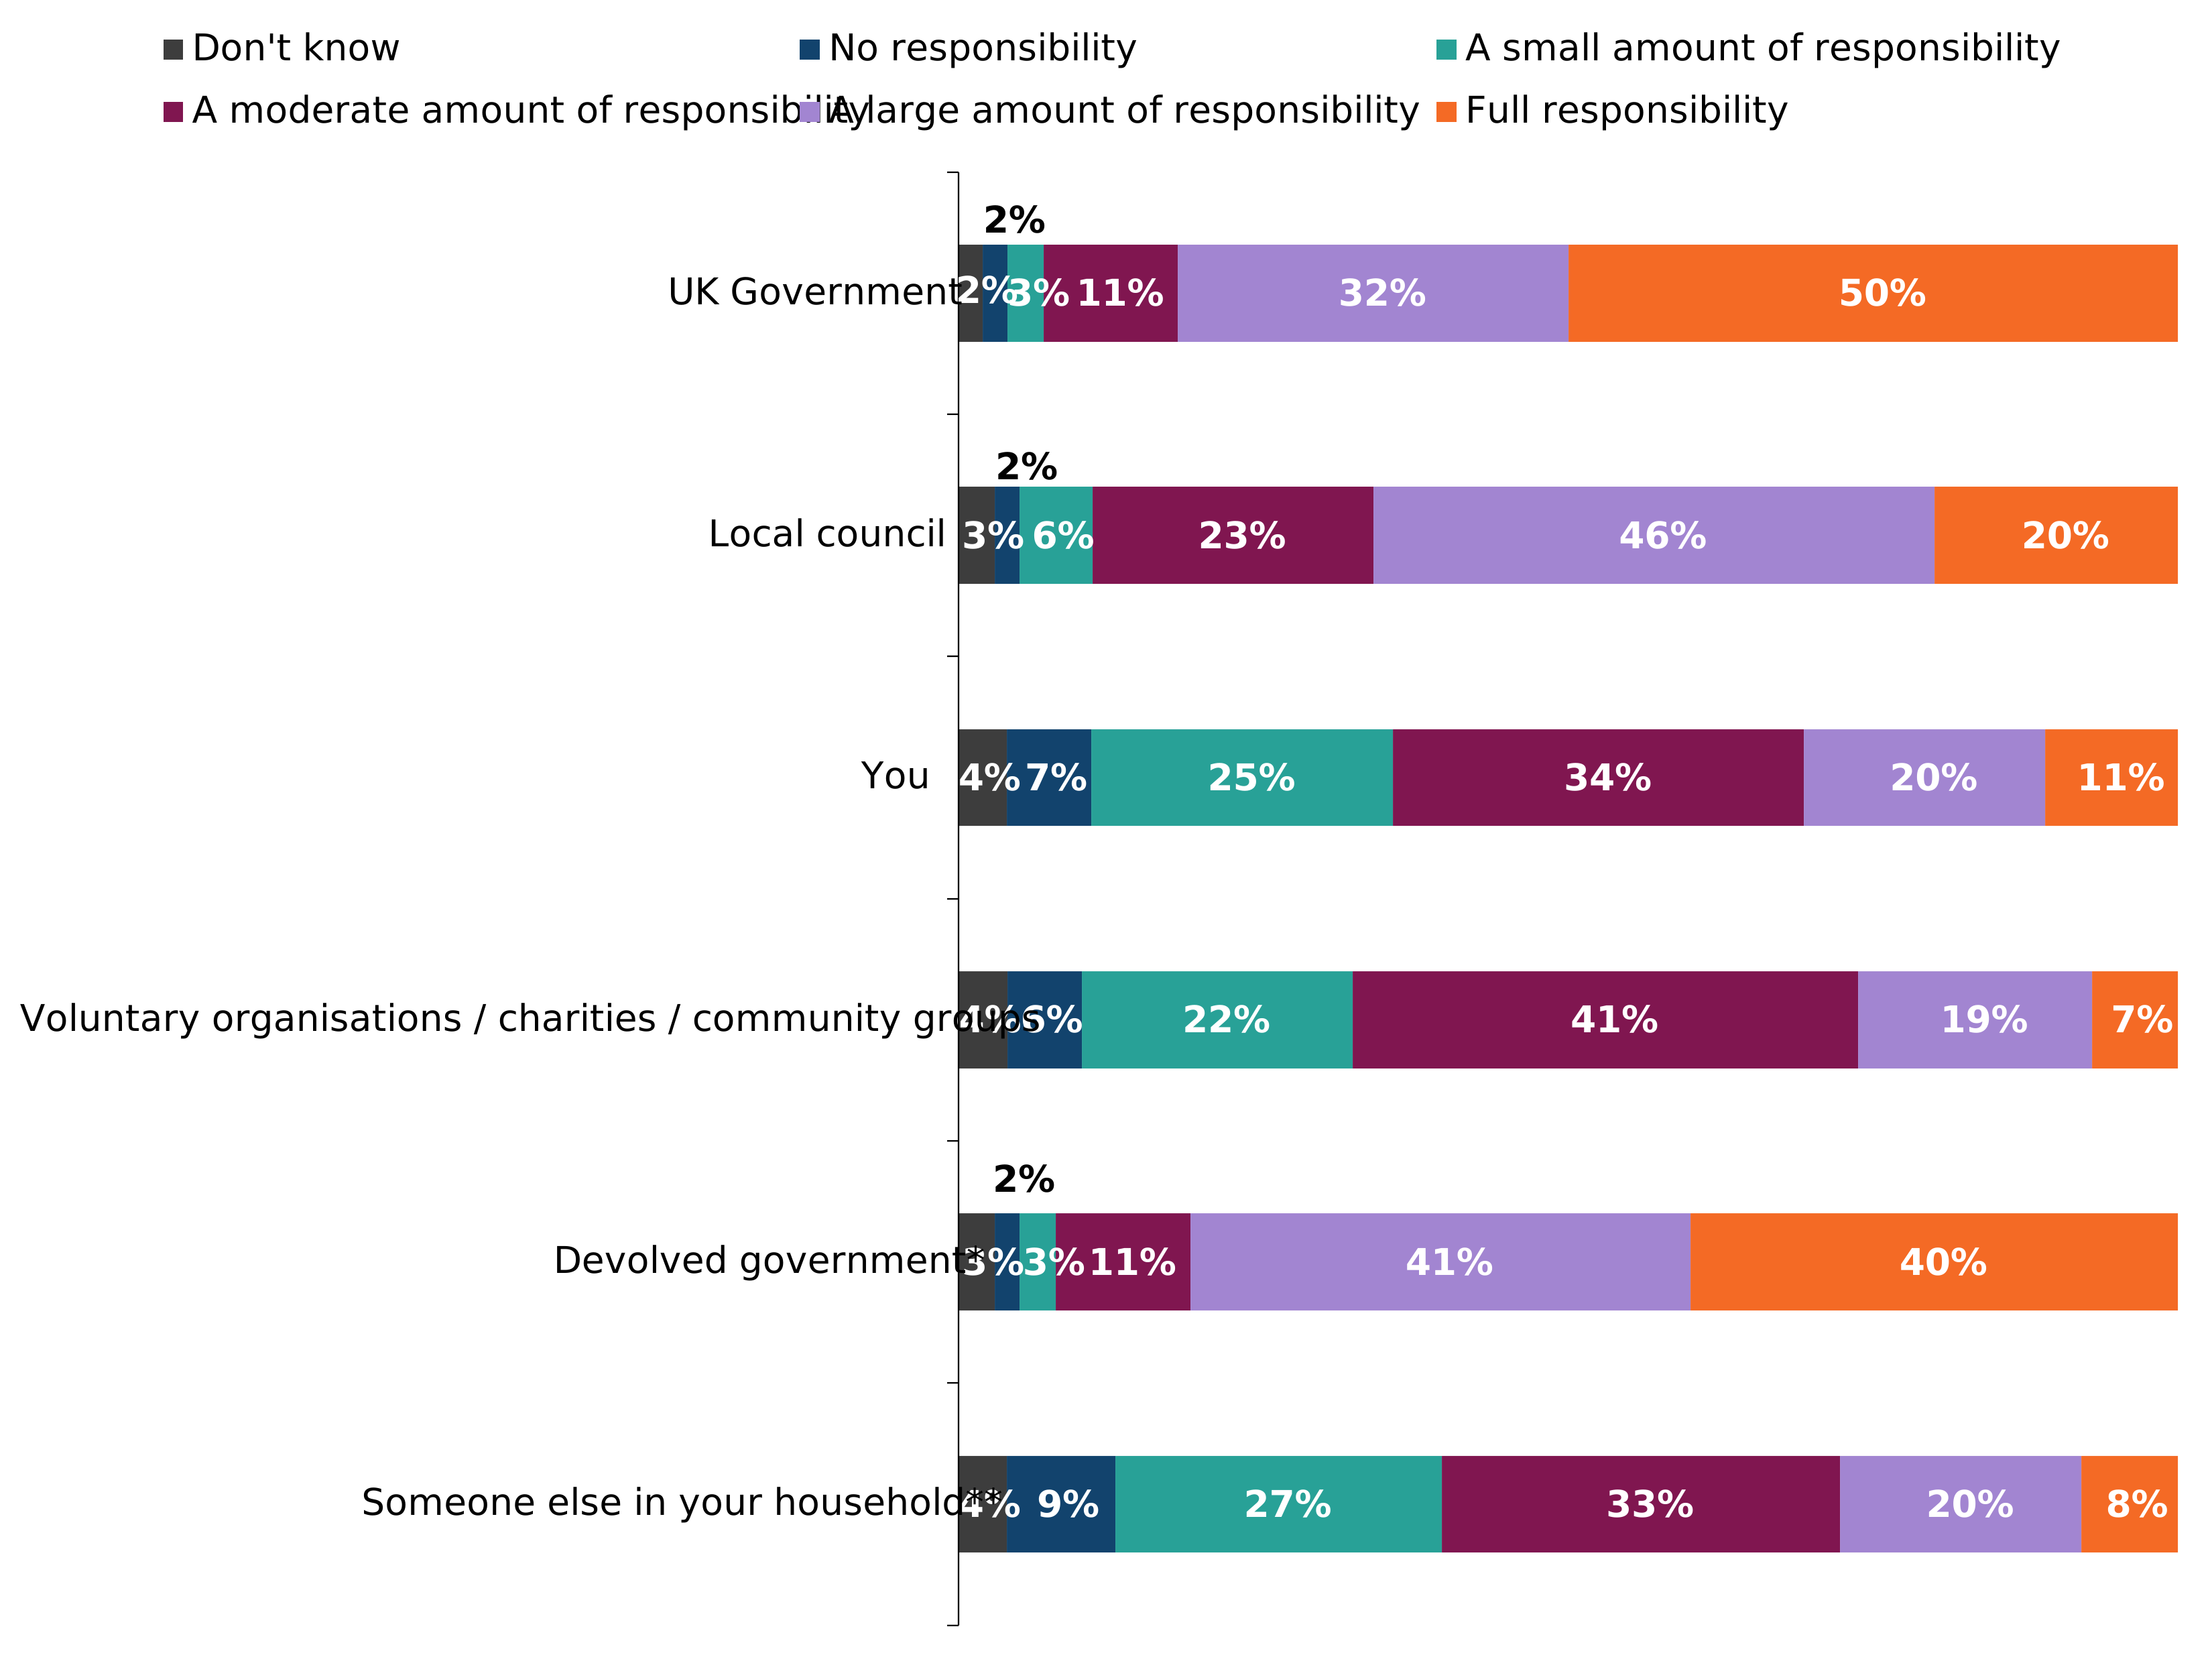
*Option only shown to respondents who live in Scotland, Wales or Northern Ireland (see figure note below)
** Option only shown to respondents who live with at least one other person (see figure note below)
These options are presented at the bottom of the chart as they cannot be directly compared with the other options (which were seen by the full sample).
Figure note:
Source: Q9. How much responsibility, if any, do you think each of the following should have for preparing for emergencies/disasters that could affect your local area?
Some response options were only shown to certain respondents if they were applicable to their circumstances. This chart uses the following bases:
- All respondents in UK sample (n=10,791).
- Those who live in Scotland, Wales or Northern Ireland (n=3,709).
- Those that have at least one other person living with them in their household (n=8,478).
Due to rounding, the totals will not always add up to 100%.
Figure 2.12: 2025 to 2026 comparison of how much responsibility respondents thought different people/organisations should have for preparing for emergencies/disasters, 2025 to 2026 (showing % of respondents who selected full responsibility or large amount of responsibility) (see UK WoW table 49 (ODS, 1.47MB))
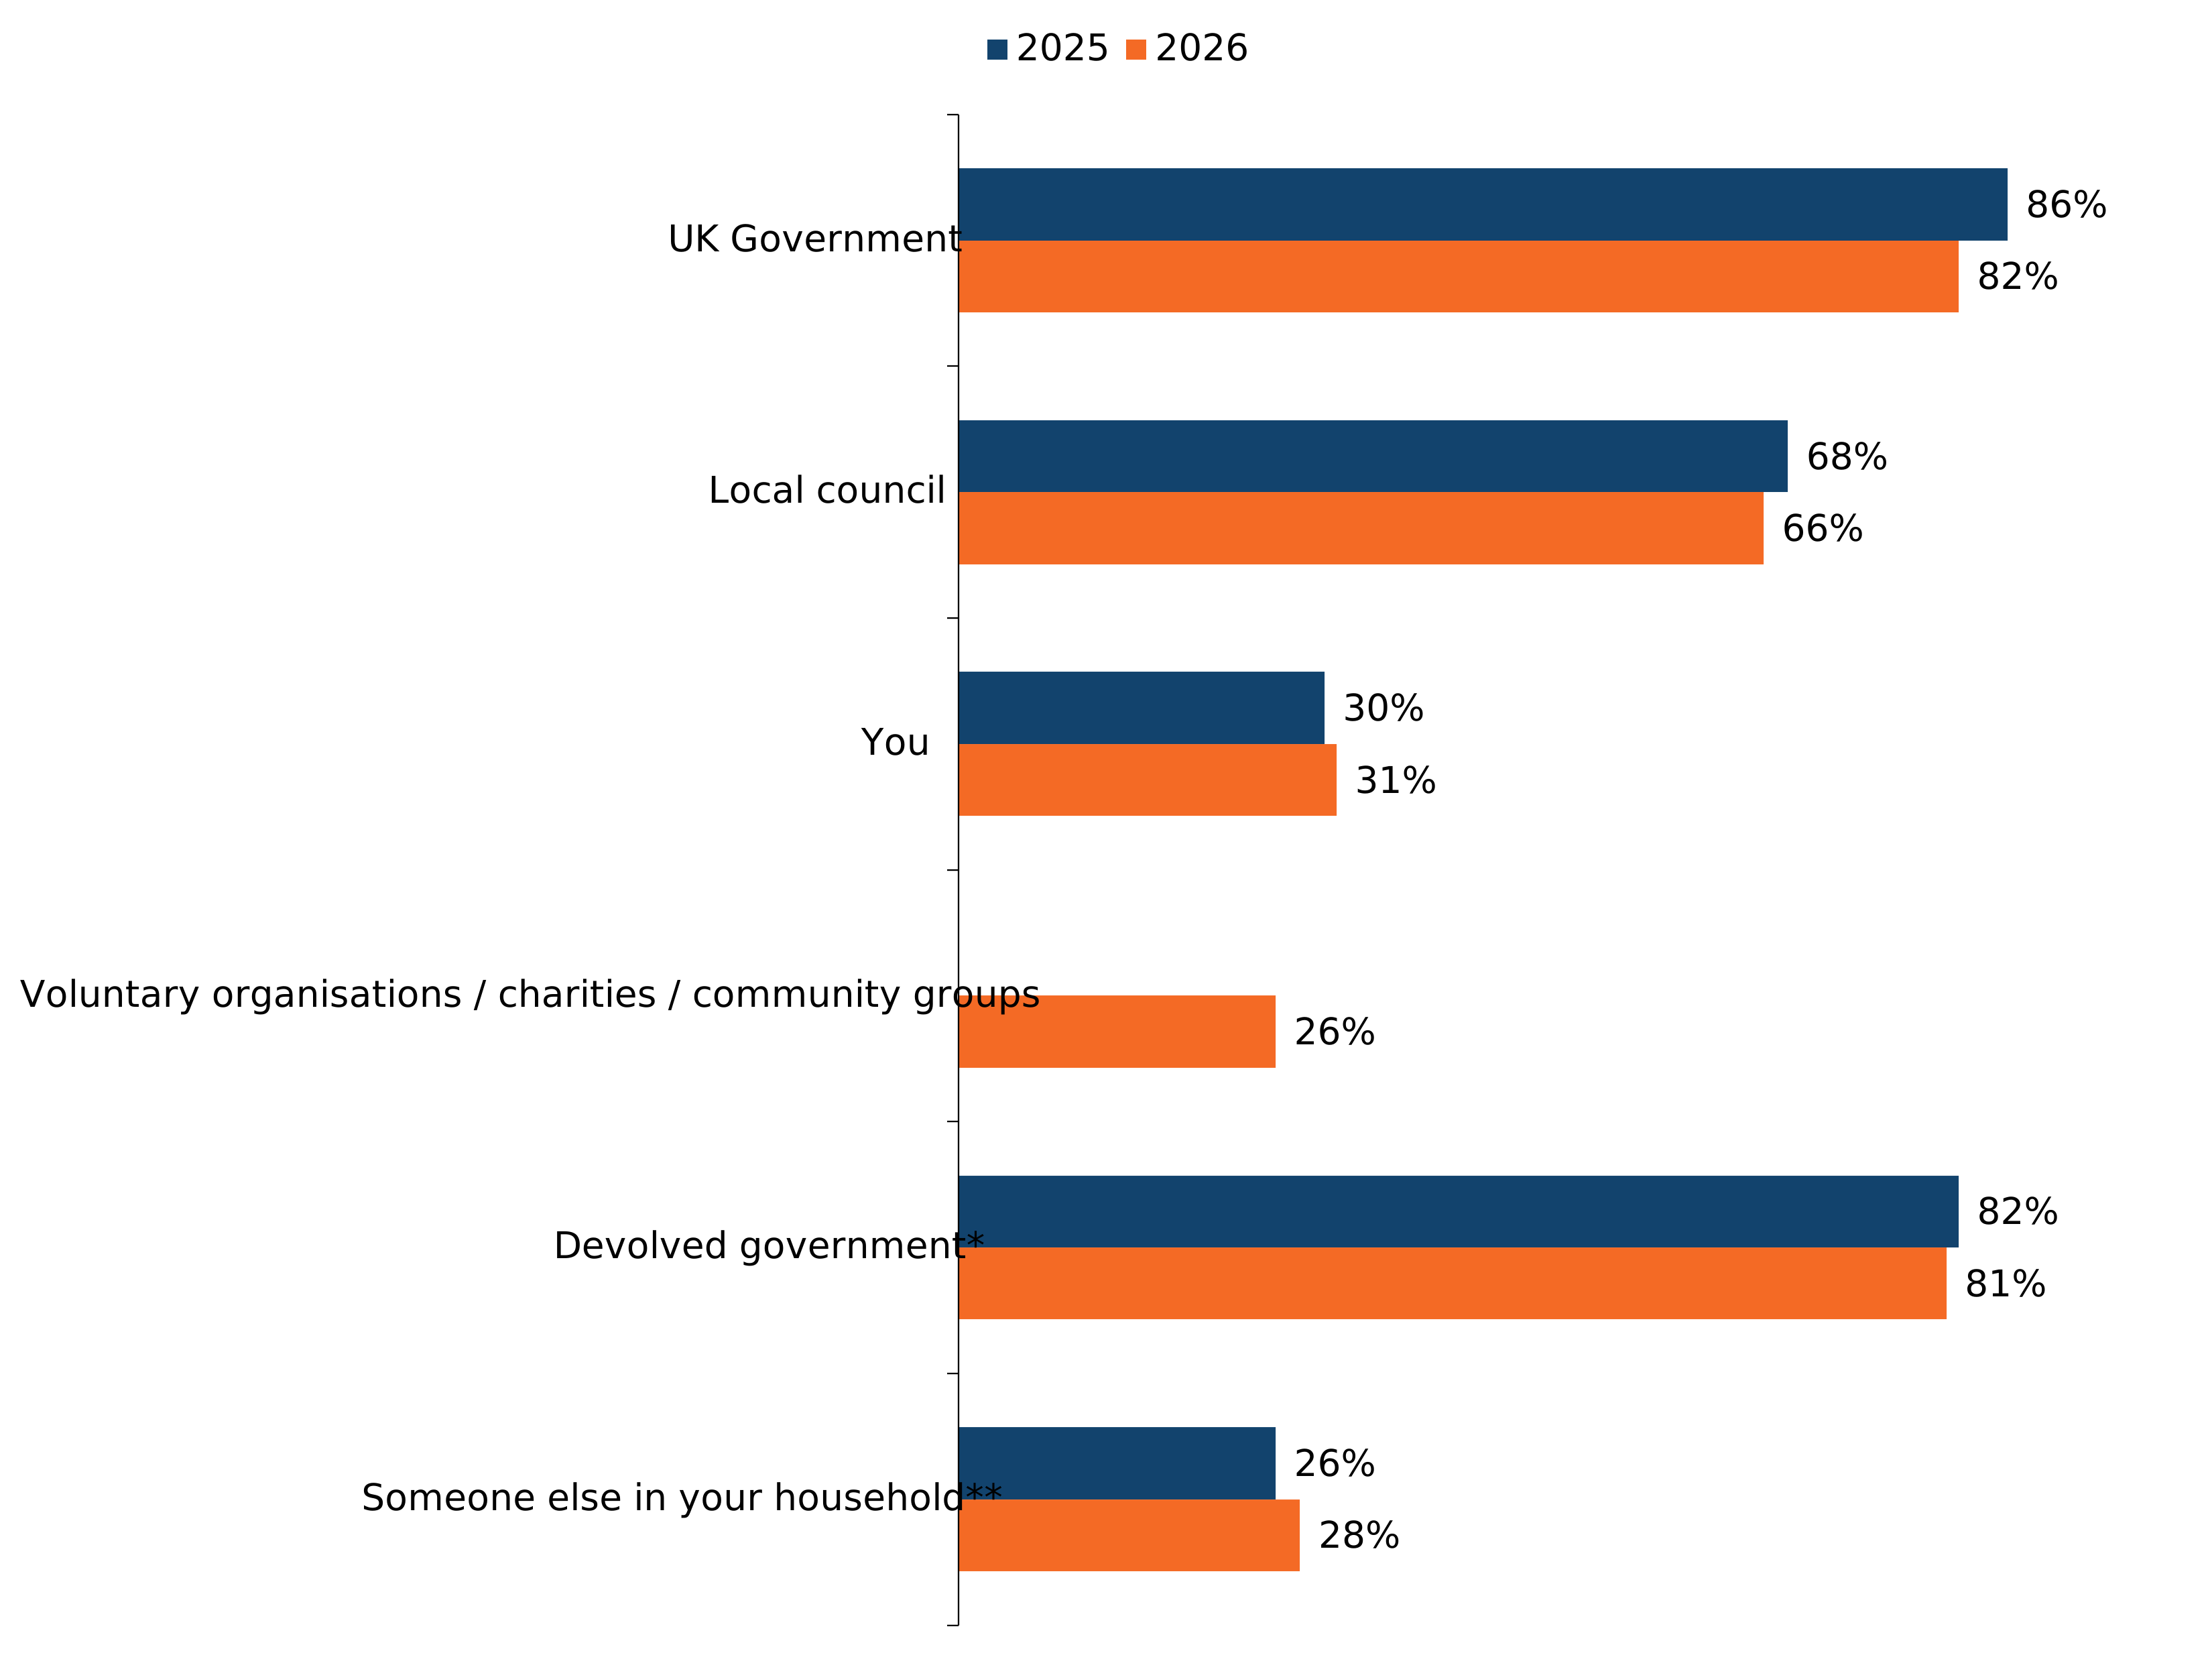
*Option only shown to respondents who live in Scotland, Wales or Northern Ireland (see figure note below)
** Option only shown to respondents who live with at least one other person (see figure note below)
These options are presented at the bottom of the chart as they cannot be directly compared with the other options (which were seen by the full sample).
Figure note:
Source: Q9. How much responsibility, if any, do you think each of the following should have for preparing for emergencies/disasters that could affect your local area?
The statement “Voluntary organisations / charities / community groups” was not assessed in 2025.
Some response options were only shown to certain respondents if they were applicable to their circumstances. This chart uses the following bases:
- All respondents in UK sample, 2025 (n=10,536); 2026 (n=10,791).
- Those who live in Scotland, Wales or Northern Ireland, 2025 (n=3,809); 2026 (n=3,709).
- Those that have at least one other person living with them in their household, 2025 (n=8,178); 2026 (n=8,478).
Perceived household resilience
When asked to consider a power cut that also impacted their gas and water supply, 25% of survey respondents thought that they would only be able to meet the basic needs of themselves and their household for 1 day or less, before needing supplies or outside help. This compared to 41% who thought they could meet the basic needs of their household for 2-3 days and 12% who thought they could meet their basic needs for 6 days or more.
Compared to 2025, there was an increase in perceived household resilience. The proportion feeling they could only last 1 day or less fell seven percentage points (32% to 25%), while those feeling they could last 2-3 days increased two percentage points (39% to 41%), and those able to last 6 days or more rose two percentage points (10% to 12%).
Figure 2.13: 2025 to 2026 comparison of how long respondents thought they would be able to meet the basic needs of their household before needing supplies or outside help, in the event of a power cut that also impacted their gas and water supply (showing % of respondents) (see UK WoW table 57 (ODS, 1.47MB))
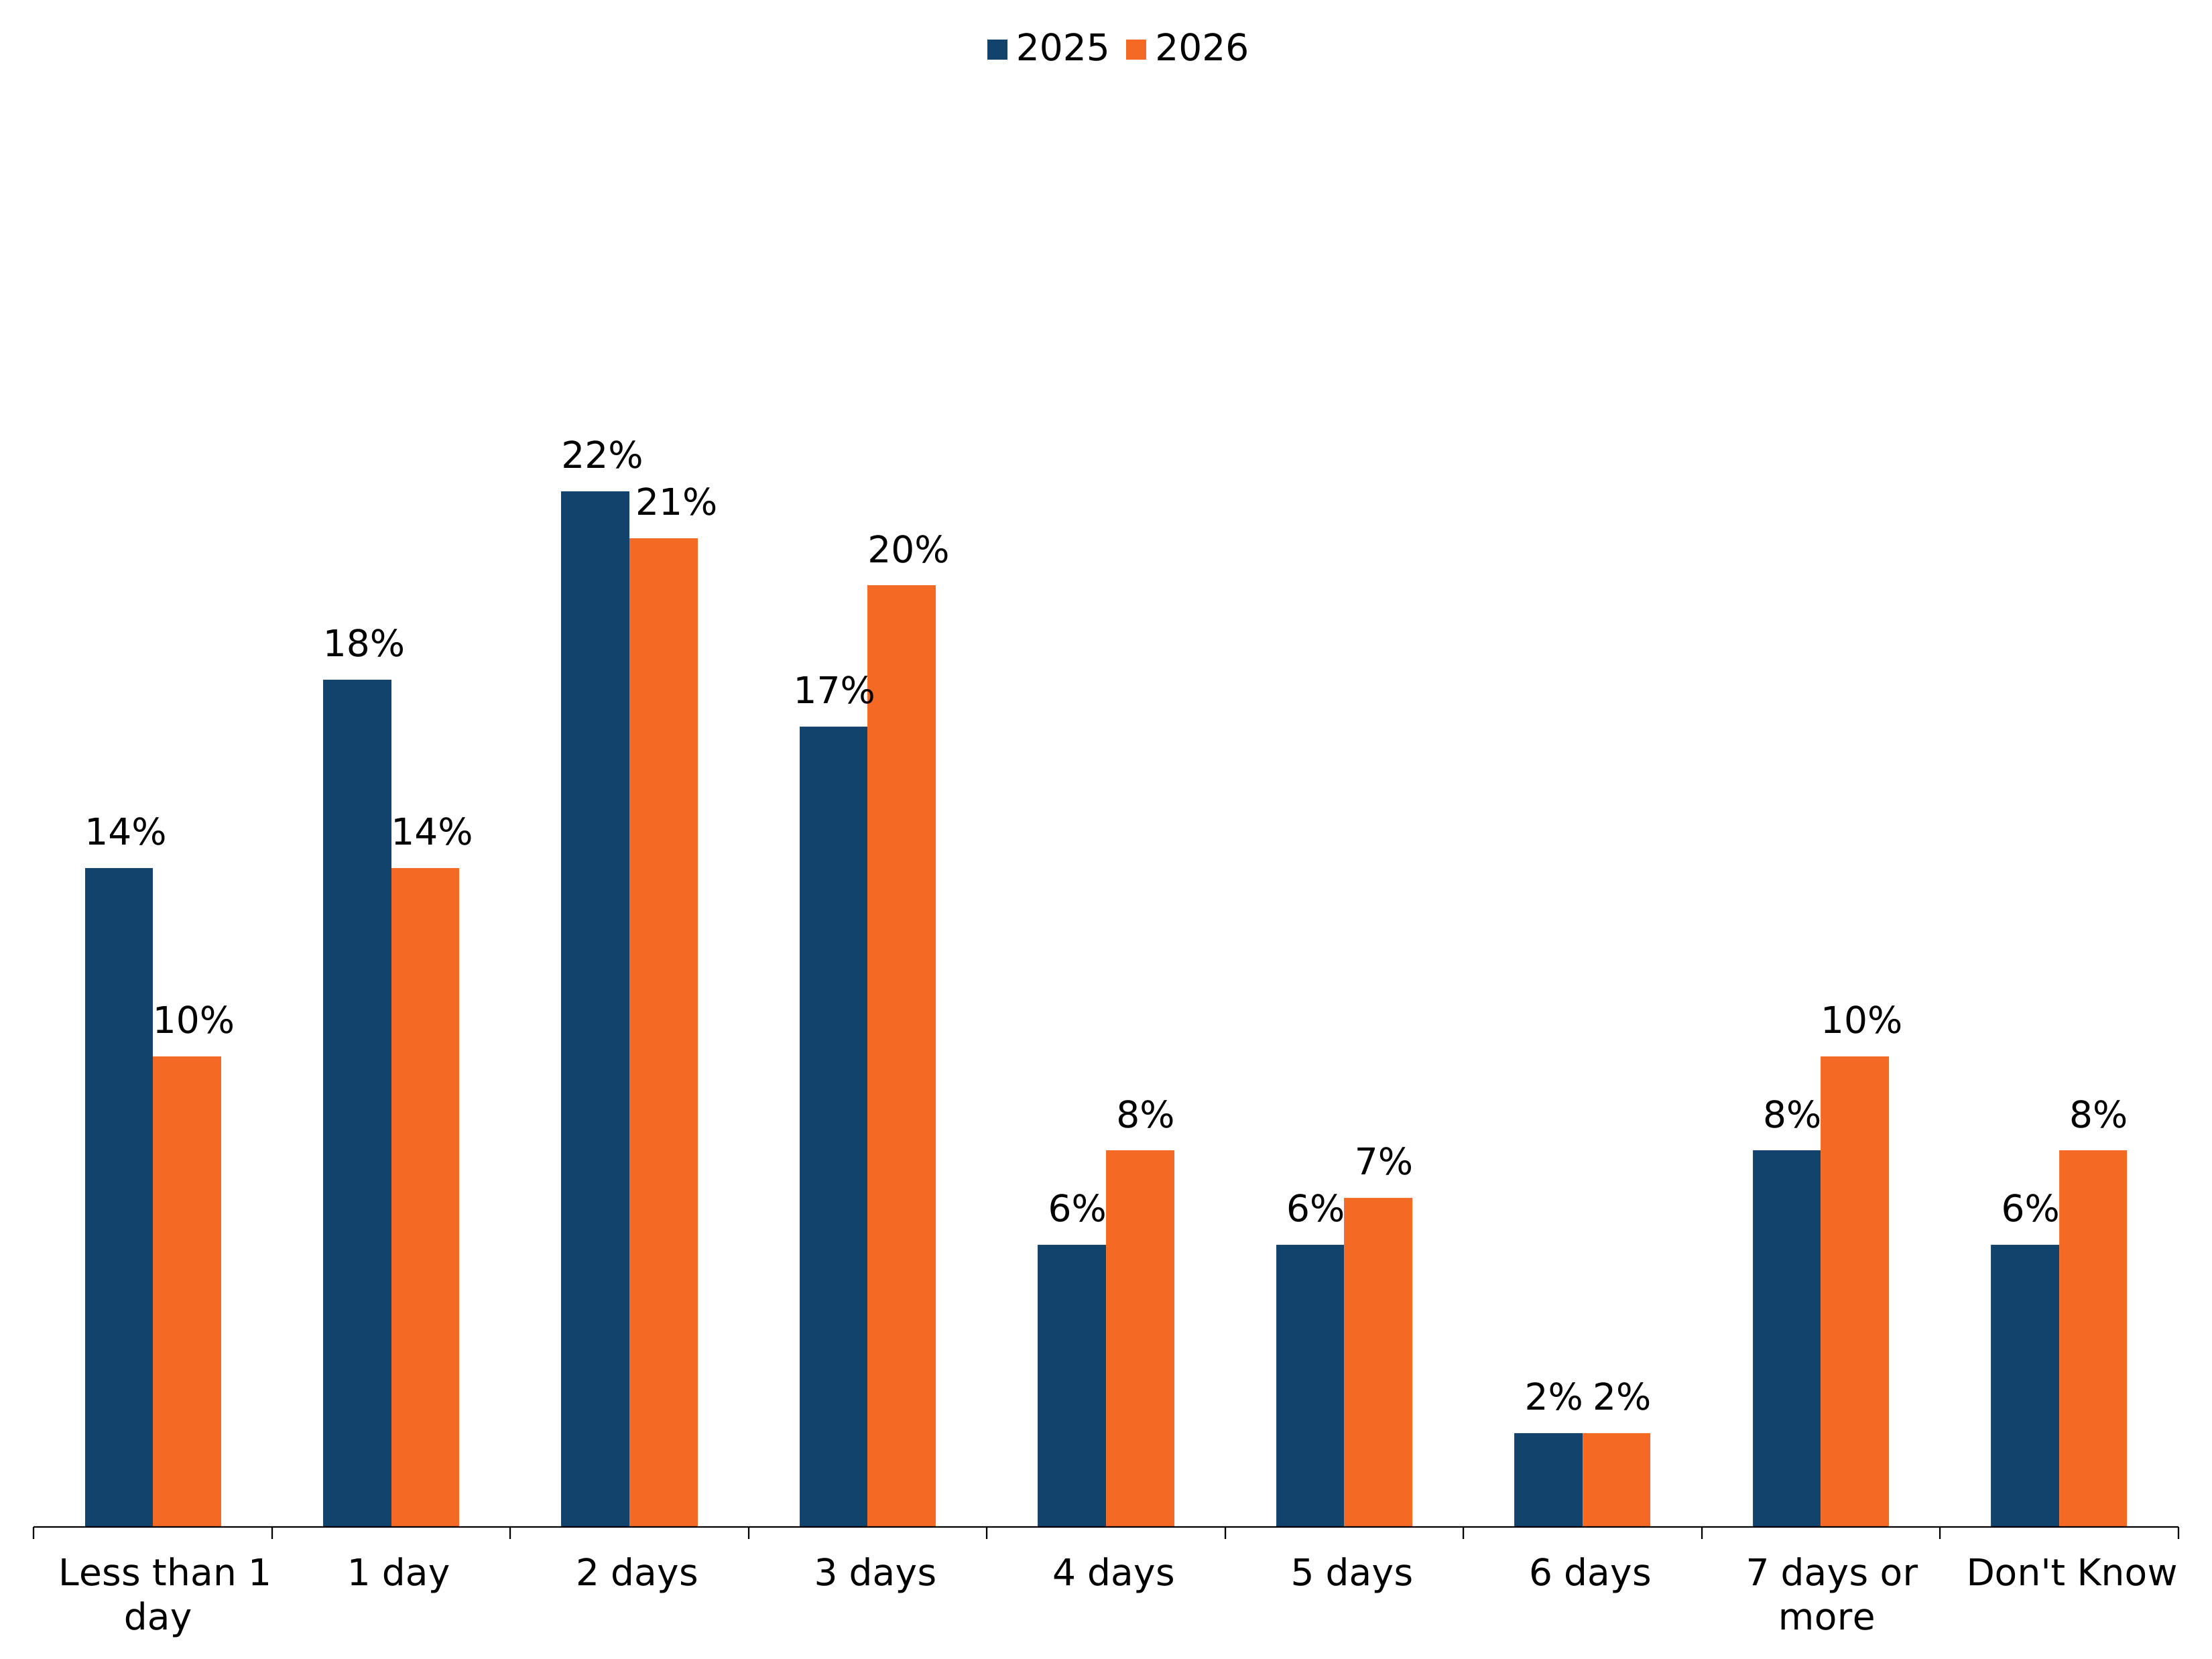
Figure note:
Source: Q10. Thinking about a power cut that also impacts your gas and water supply… For how long do you think you would be able to meet the basic needs of you and your household before needing supplies or outside help (such as food, water or medical support from friends/family or the authorities)?
Data shown are for 2025 (Wave 1) and 2026 (Wave 2).
Base: All respondents in UK sample 2025 (n=10,536); 2026 (n=10,791).
Due to rounding, the percentages for Q10 add up to 99% in 2025.
Perceived ability to perform first aid
48% of respondents were very or somewhat confident in their own ability to perform first aid, whereas 33% were either not very or not at all confident.
Figure 2.14: Level of confidence in own ability to perform first aid (showing % of respondents) (see UK 2026 table 58 (ODS, 1.15MB))
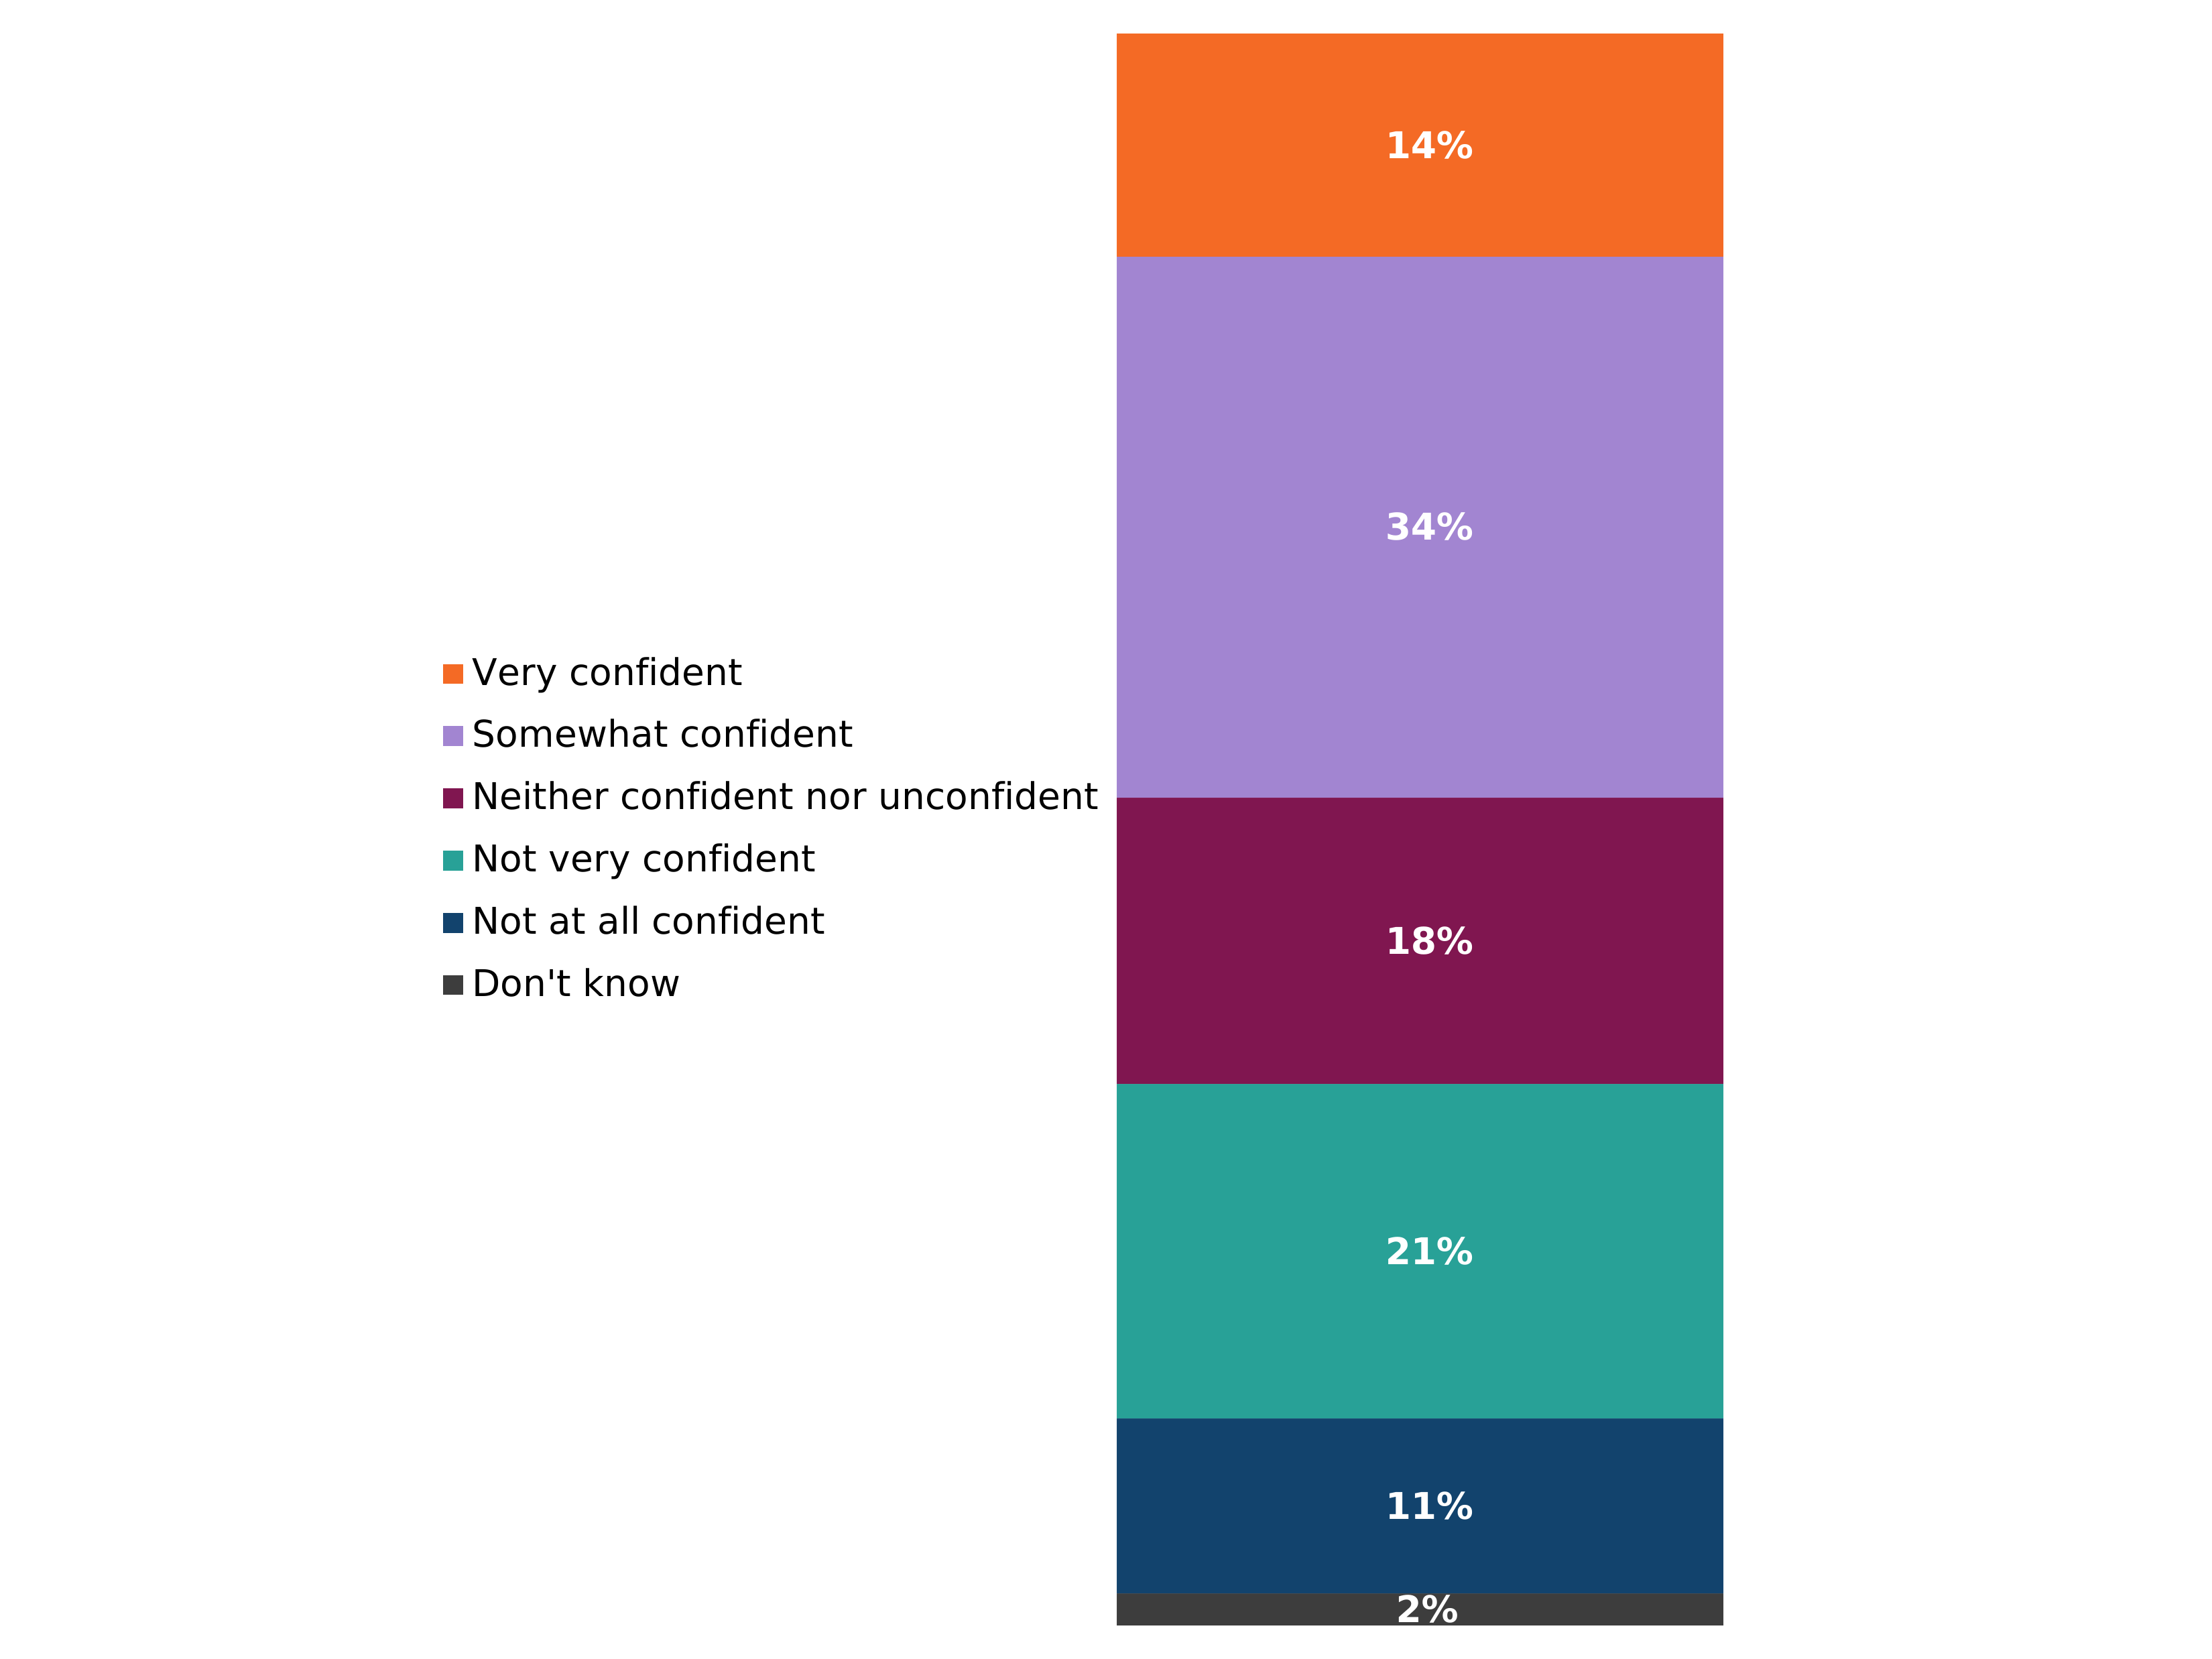
Figure note:
Source: Q37. How confident, if at all, are you in your own ability to perform first aid?
Base: All respondents in UK sample (n=10,791).
A majority (62%) of respondents were very or somewhat confident in their own ability to treat someone for a minor burn, whereas 19% were either not very or not at all confident.
Figure 2.15: Level of confidence in own ability to treat someone for a minor burn (showing % of respondents) (see UK 2026 table 38 (ODS, 1.15MB))
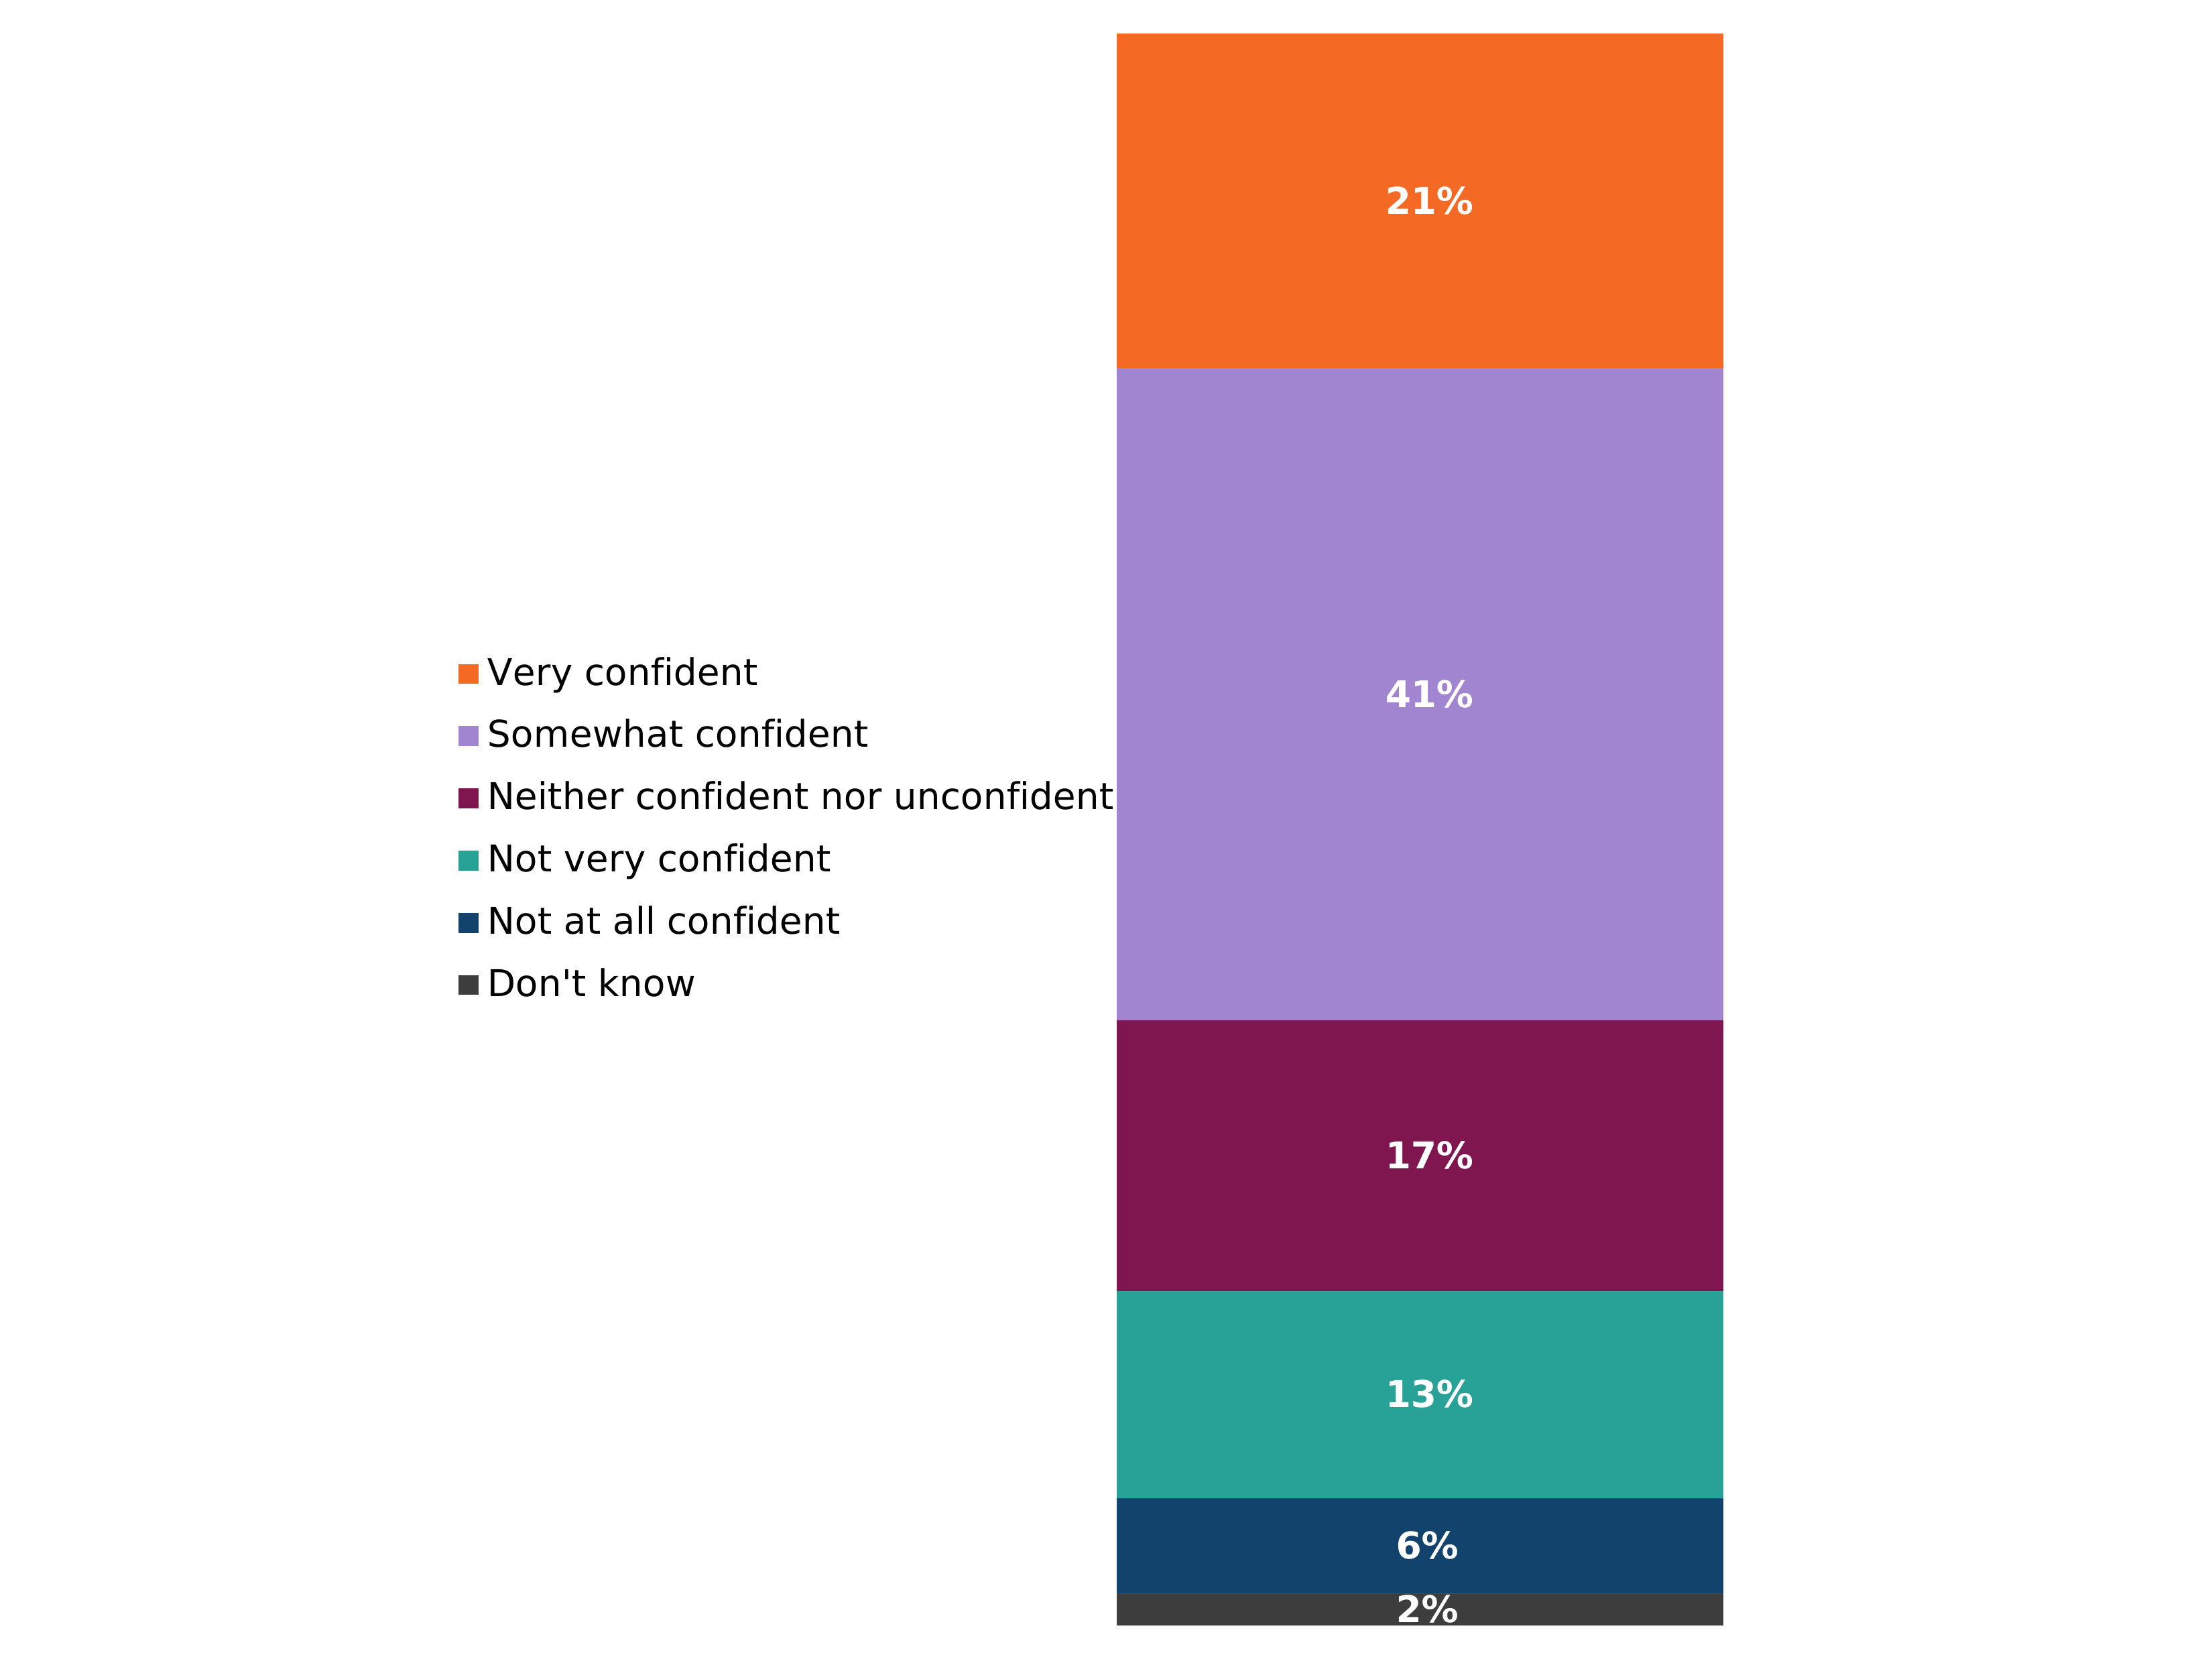
Figure note:
Source: Q38. How confident, if at all, are you in your ability to treat someone for a minor burn?
Base: All respondents in UK sample (n=10,791).
49% of respondents were very or somewhat confident in their own ability to identify whether someone was suffering from hypothermia, whereas 27% were either not very or not at all confident.
Figure 2.16: Level of confidence in own ability to identify the signs that someone was suffering from hypothermia (showing % of respondents) (see UK 2026 table 60 (ODS, 1.15MB))
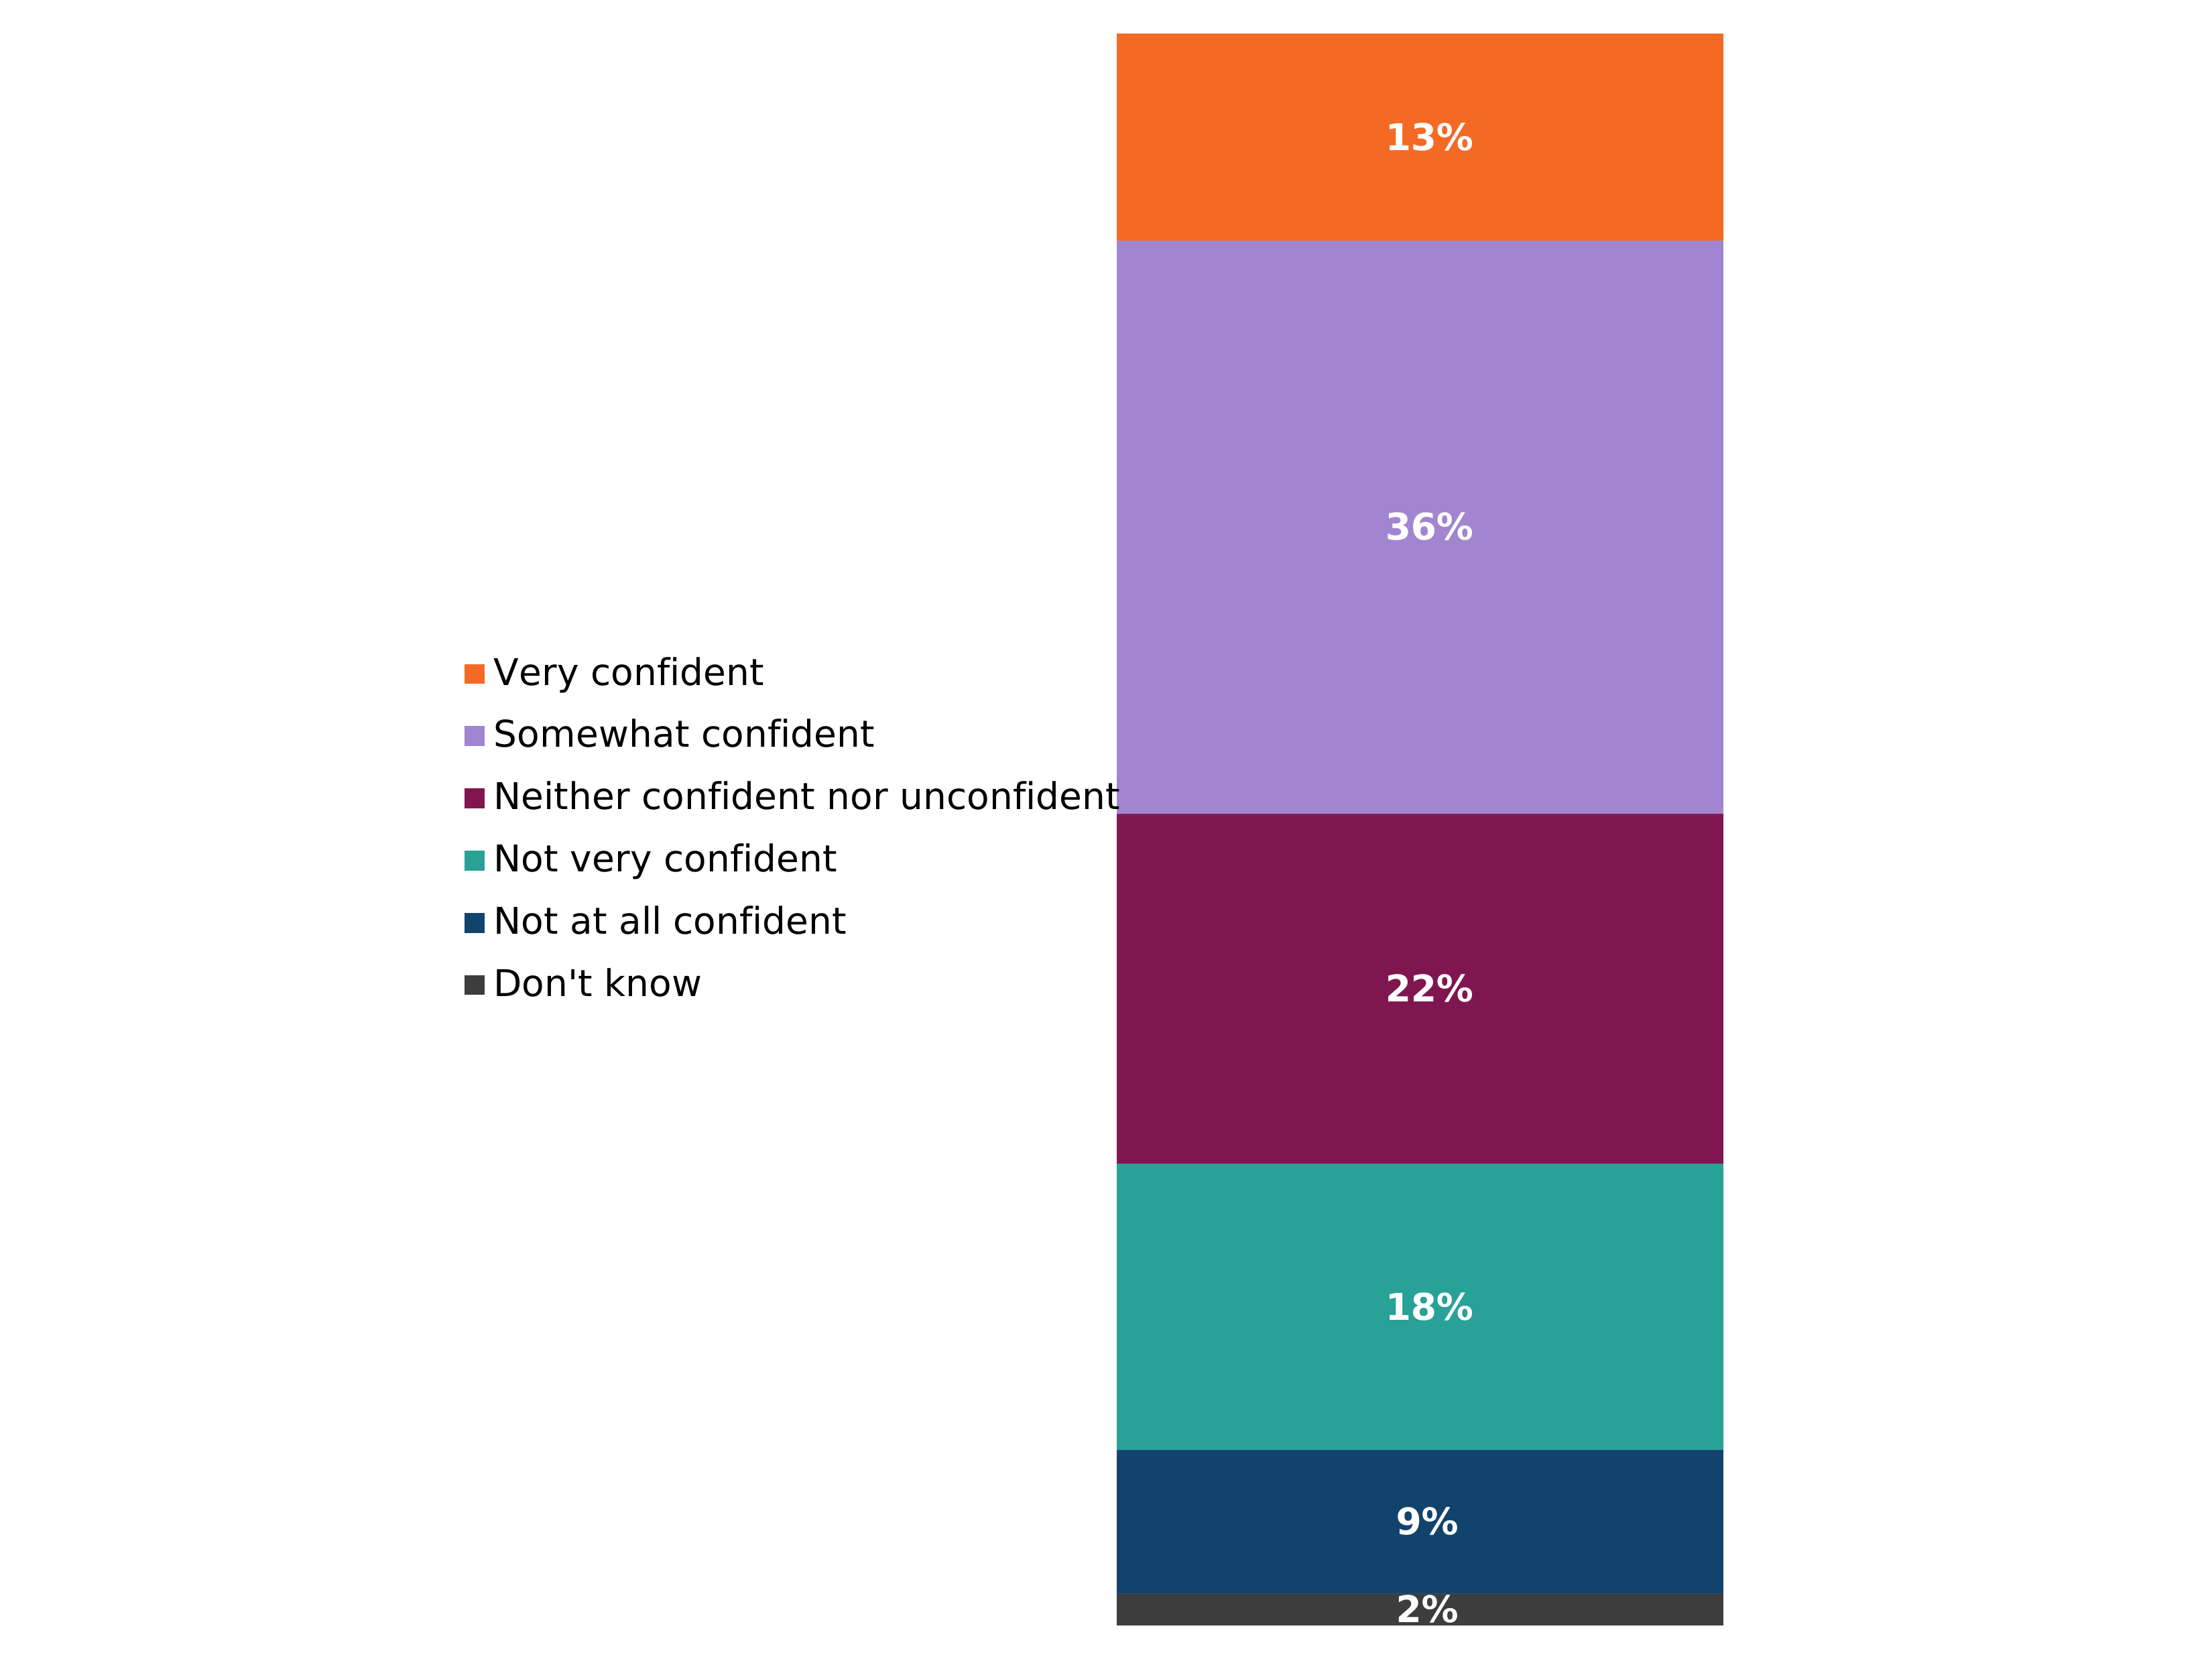
Figure note:
Source: Q39. How confident, if at all, are you that you would be able to identify the signs that someone was suffering from hypothermia (low body temperature)?
Base: All respondents in UK sample (n=10,791).
Information and communication
Information sources
23% of survey respondents recalled having seen or heard information or advice in the last 12 months about actions they could take to be more prepared for emergencies or disasters that might occur in the UK. 69% said they had not seen or heard advice of this kind in the last 12 months and 7% selected that they did not know.
Compared to 2025, an increased proportion of respondents recalled seeing or hearing preparedness information or advice, rising four percentage points from 19% to 23%. At the same time, the proportion who had not seen or heard such advice fell six percentage points (75% to 69%).
Data note:
Source: Q11. Have you seen or heard any information or advice in the last 12 months about actions you can take to be more prepared for emergencies or disasters that might occur in the UK? (Please think about content that is specific to the UK rather than anything you might have seen about emergencies or disasters abroad).
Base: All respondents in UK sample, 2025 (n=10,536); 2026 (n=10,791).
Of the respondents who reported they had seen or heard information or advice on emergency preparedness in the last 12 months, 28% reported seeing or hearing this on a non-UK Government social media account, while slightly less (23%) reported seeing or hearing information on a UK Government social media account. 28% reported having seen or heard information through traditional media, for example on TV, on the radio or by reading it in a newspaper and the same proportion (28%) reported seeing or hearing advice on a UK Government website for example GOV.UK/Prepare.
The 2026 questionnaire changed the response options for where respondents saw or heard this information and as a result some sources are not directly comparable between 2025 and 2026.
The following response options were split or combined:
- ‘On social media’ was split into two new statements in 2026. ‘On social media, from a UK government account’ and ‘On social media, not from a government account’
- ‘From a voluntary organisation / charity’ and ‘From a local community group’ were removed for 2026. They were replaced by a single code ‘From a voluntary organisation / charity / community group’
The following response options were added to the question in 2026:
- ‘From a media personality, celebrity or influencer’,
- ‘From a member of the UK emergency services (fire, police, or ambulance service)’
- From a UK politician (MP or Minister)
For each response option that was asked on a consistent basis in both 2025 and 2026, the proportion of respondents who reported seeing or hearing information from that source was lower in 2026 than in 2025. The biggest decrease was in those reporting seeing or hearing information on a devolved government website, declining by six percentage points (17% to 11%), followed by a four percentage point decline in those reporting seeing or hearing information on a local government / council website (21% to 17%). There was a two percentage point decline in those saying they had seen or heard information on a UK Government website e.g. GOV.UK/Prepare, Met Office or Environment Agency.
An open response option for this question received a total of 38 responses. Most of these were of a similar theme to the existing response options, for example respondents mentioned different types of traditional media such as radio or the news, or online platforms such as YouTube. All other themes had less than five responses coded to them.
Figure 3.1: 2025 to 2026 comparison of where respondents reported having seen or heard emergency preparedness advice or information (showing % of respondents) (see UK WoW table 62 (ODS, 1.47MB))
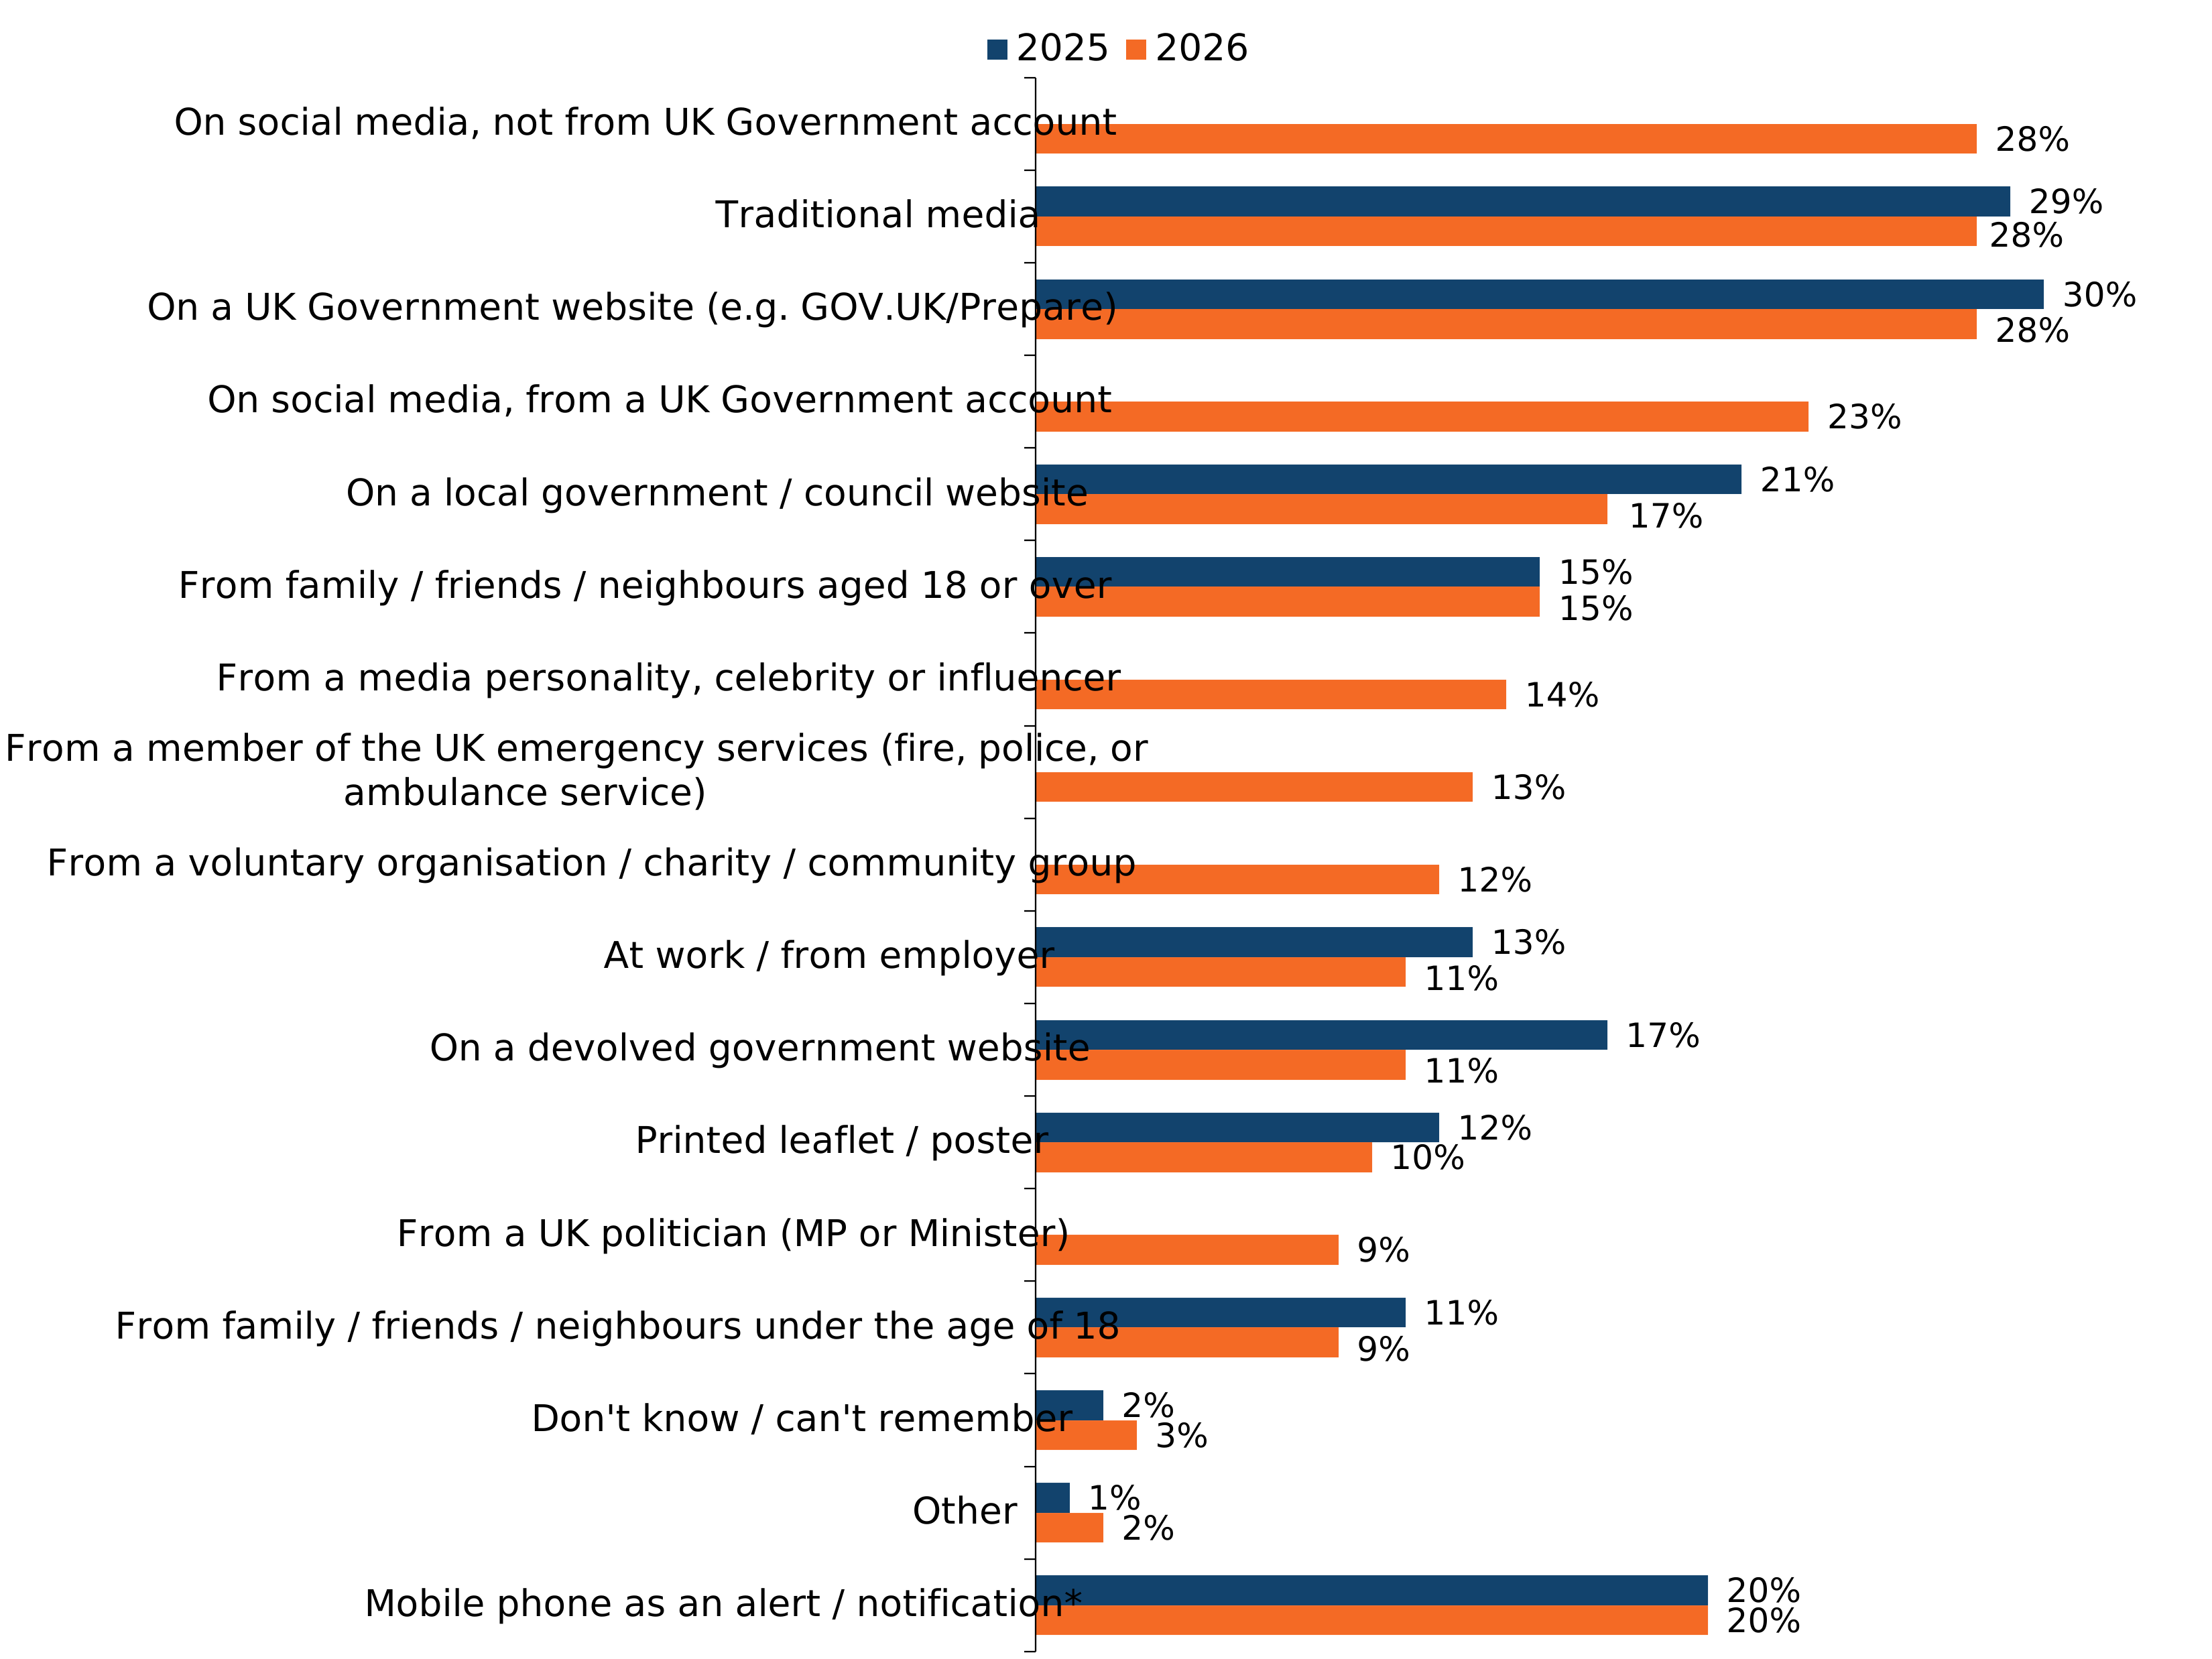
- Option only shown to respondents who had seen / heard emergency information or advice in the last 12 months and who owned a mobile phone
Figure note:
Source: Q12. Where did you see or hear this information?
Data shown are for 2025 (Wave 1) and 2026 (Wave 2).
The following statements were not assessed in 2025: On social media, not from UK Government account, On social media from a UK Government account, From a media personality, celebrity or influencer, From a member of the UK emergency services, From a voluntary organisation / charity / community group, From a UK politician (MO or minister)
Some response options were only shown to certain respondents if they were applicable to their circumstances. This chart uses the following bases:
- Those who have seen / heard emergency information or advice in the last 12 months, 2025 (n=2,806); 2026 (n=2,501).
- Those who have seen / heard emergency information or advice in the last 12 months and who own a mobile phone, 2025 (n=2,076); 2026 (n=2,487).
Of the respondents who reported having seen or heard information or advice on how to prepare for emergencies in the last 12 months, 32% said this was about war, followed by 26% who said it was about extreme cold weather or storms. A quarter reported having seen or heard information about power cuts (25%) and approximately the same proportion reported the information was related to human disease outbreaks/pandemics (24%). 26% said the information was about various types of emergencies.
Compared to 2025, there were decreases across preparedness information seen or heard across several emergency types. Extreme cold weather or storms fell five percentage points (31% to 26%), flooding decreased seven percentage points (28% to 21%), and power cuts dropped five percentage points (30% to 25%). Cyber or phishing attacks (22% to 17%), water outages (21% to 17%), and wildfires (17% to 12%) also saw declines. Terrorist attacks and general preparedness information remained stable at 20% and 26% respectively.
An open response option for this question received a total of 23 responses. The most frequently given example (by five respondents) was that the information or advice was related to the ‘cost of living crisis’ or ‘energy/fuel crisis’. All other themes had less than five responses coded to them.
Note: War and food supply disruption were not included in Wave 1 and therefore no year-on-year comparison is available for these emergency types.
Figure 3.2: 2025 to 2026 comparison of the type of emergency the information or advice seen by respondents was about (showing % of respondents) (see UK WoW table 63 (ODS, 1.47MB))
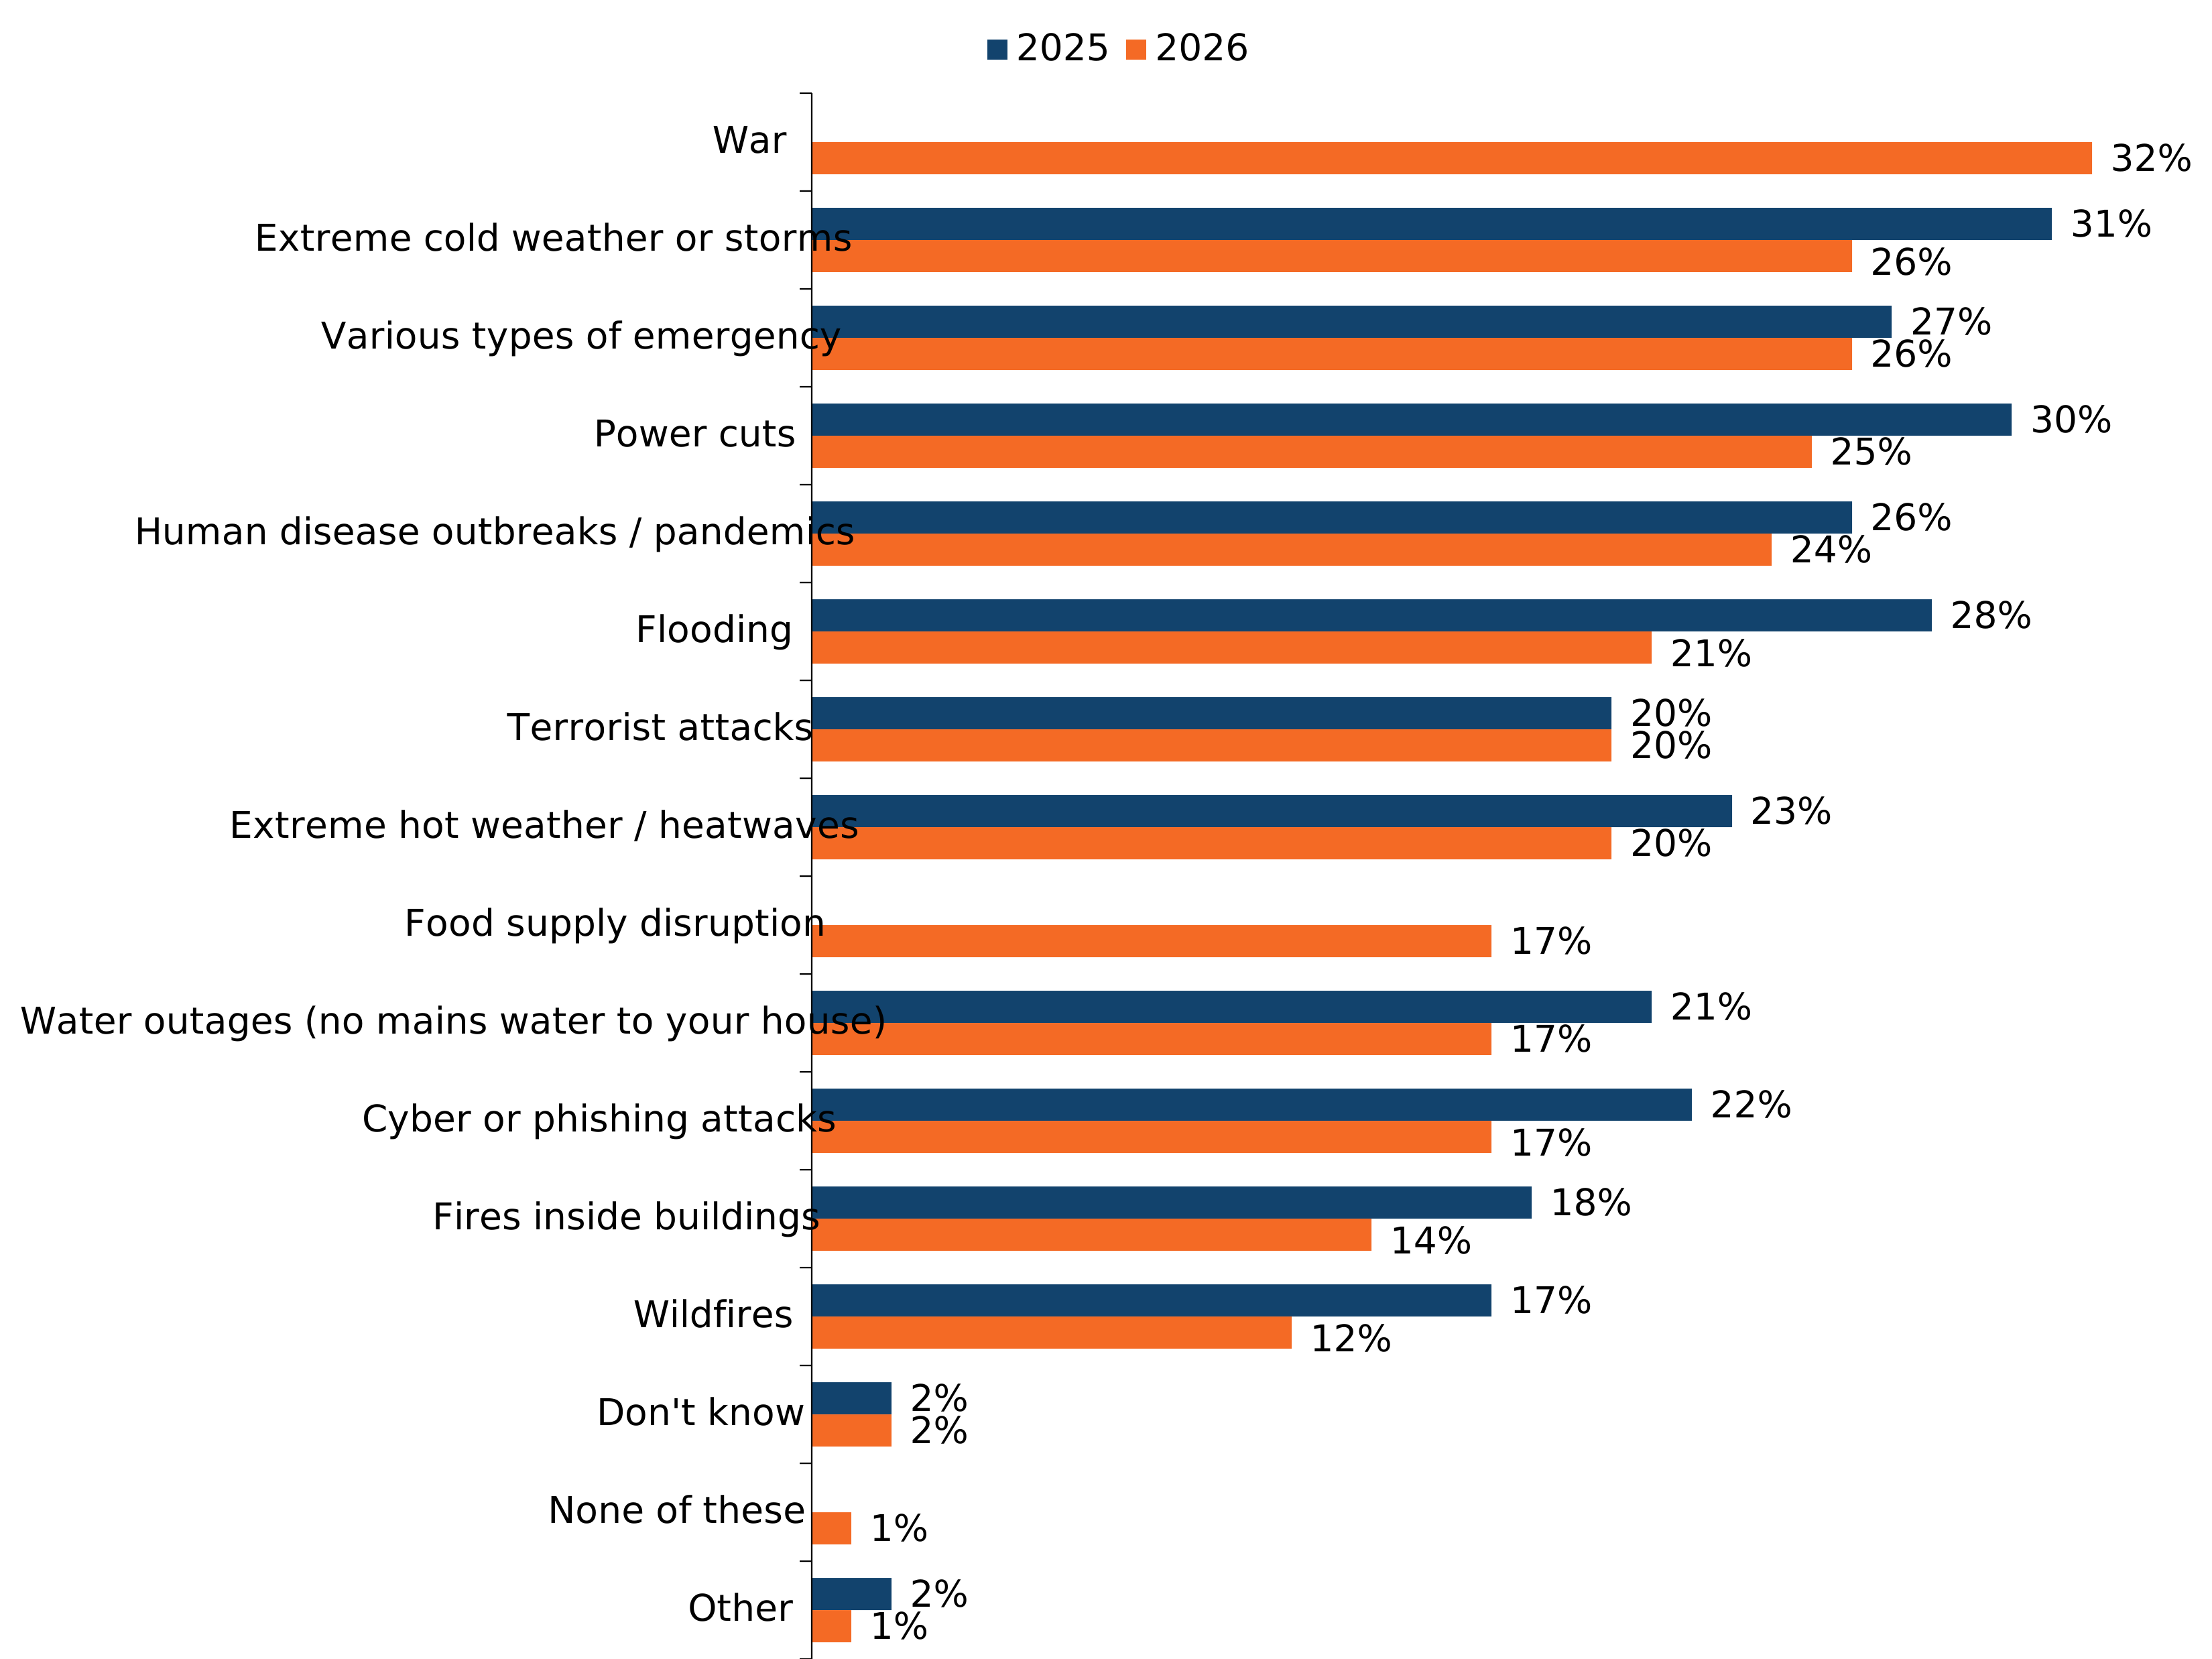
Figure note:
Source: Q13. Thinking about the information you saw or heard on preparing for emergencies/disasters in the UK… What type of emergency/disaster was it about?
Data shown are for 2025 (Wave 1) and 2026 (Wave 2).
The following statements were not assessed in 2026: War, Food supply disruption.
Base: Those who have seen / heard emergency information or advice in the last 12 months, 2025 (n=2,055); 2026 (n=2,422).
The majority (56%) of survey respondents who had seen or heard information or advice on how to prepare for emergencies in the last 12 months, and who recalled where they saw it, reported acting on the information or advice. This compared to 37% who stated they did not act on the information or advice and 7% who reported that they did not remember their response.
Compared to 2025, there was a decrease in the proportion who acted on preparedness information or advice, decreasing seven percentage points from 63% to 56%. Correspondingly, the proportion who did not act on the information rose six percentage points (31% to 37%).
Data note:
Source: Q14. Did you act on the information or advice? (Meaning did you change your plans or do something or buy something).
Base: Those who recall where they had seen / heard emergency information or advice, 2025 (n=2,055); 2026 (n=2,422).
15% of self-employed respondents stated that they had seen or heard advice on how to prepare their businesses for emergencies or disruption in the past 12 months. 78% reported that they had not seen or heard any such advice, and 7% were unsure.
Figure note:
Source: Q40. In the last 12 months have you seen or heard advice on how to prepare your business for emergencies or disruption (also known as business continuity advice)?
Base: Those who are self-employed, 2026 (n=1,131).
GOV.UK/Prepare
14% of respondents reported having visited the UK Government ‘Prepare’ website (GOV.UK/Prepare), 81% indicated they had not, and 5% reported not knowing if they had.
Compared to 2025, there was a 1 percentage point increase in those who said they had visited the website (13% to 14%), with a corresponding 1 percentage point decrease in those reporting they had not visited the website (82% to 81%).
Data note:
Source: Q15. Have you visited the UK Government ‘Prepare’ website (GOV.UK/Prepare)?
Base: All respondents in UK sample, 2025 (n=10,536); 2026 (n=10,791).
Due to rounding, the percentages for Q15 add up to 99%.
Of the survey respondents who reported visiting the UK Government ‘Prepare’ website, 74% indicated that they acted on the information or advice on the website, 21% indicated they did not and 5% reported not remembering if they had.
Compared to 2025, the proportion who acted on the information rose four percentage points (70% to 74%), with a corresponding five percentage point decrease in those who did not act (26% to 21%).
Data note:
Source: Q16. Did you act on any of the information or advice on the site? (Meaning did you do something or buy something).
Base: Those who have visited GOV.UK/Prepare, 2025 (n=1,362); 2026 (n=1,450).
Emergency Alerts
The majority (74%) of survey respondents stated that they were aware of the UK Government Emergency Alerts service, 23% indicated they were not aware of the service, and 3% reported that they did not know.
Compared to 2025, awareness of the Emergency Alerts service increased, rising eleven percentage points (63% to 74%). Correspondingly, the proportion who were not aware fell eleven percentage points (34% to 23%), while those that reported they did not know stayed the same.
Data note:
Source: Q17. Are you aware of the UK Government’s Emergency Alerts service (text messages sent to all mobile phones in a specific location when there is a threat to life)?
Base: All respondents in UK sample, 2025 (n=10,536); 2026 (n=10,791).
Perceived knowledge and information needs
The majority (54%) of survey respondents considered themselves either not at all informed or somewhat uninformed about plans in the UK to deal with large-scale emergencies/disasters, whereas 23% described themselves as either somewhat or very well informed about these plans.
Compared to 2025, perceived levels of knowledge about UK emergency planning remained broadly stable, with the proportion considering themselves as either somewhat or very well informed increasing marginally from 22% to 23% and those considering themselves not at all informed or somewhat uninformed declining marginally from 56% to 54%.
Figure 3.3: How informed respondents reported being about plans in place in the UK to deal with large-scale emergencies/disasters (showing % of respondents) (see UK 2026 table 68 (ODS, 1.15MB))
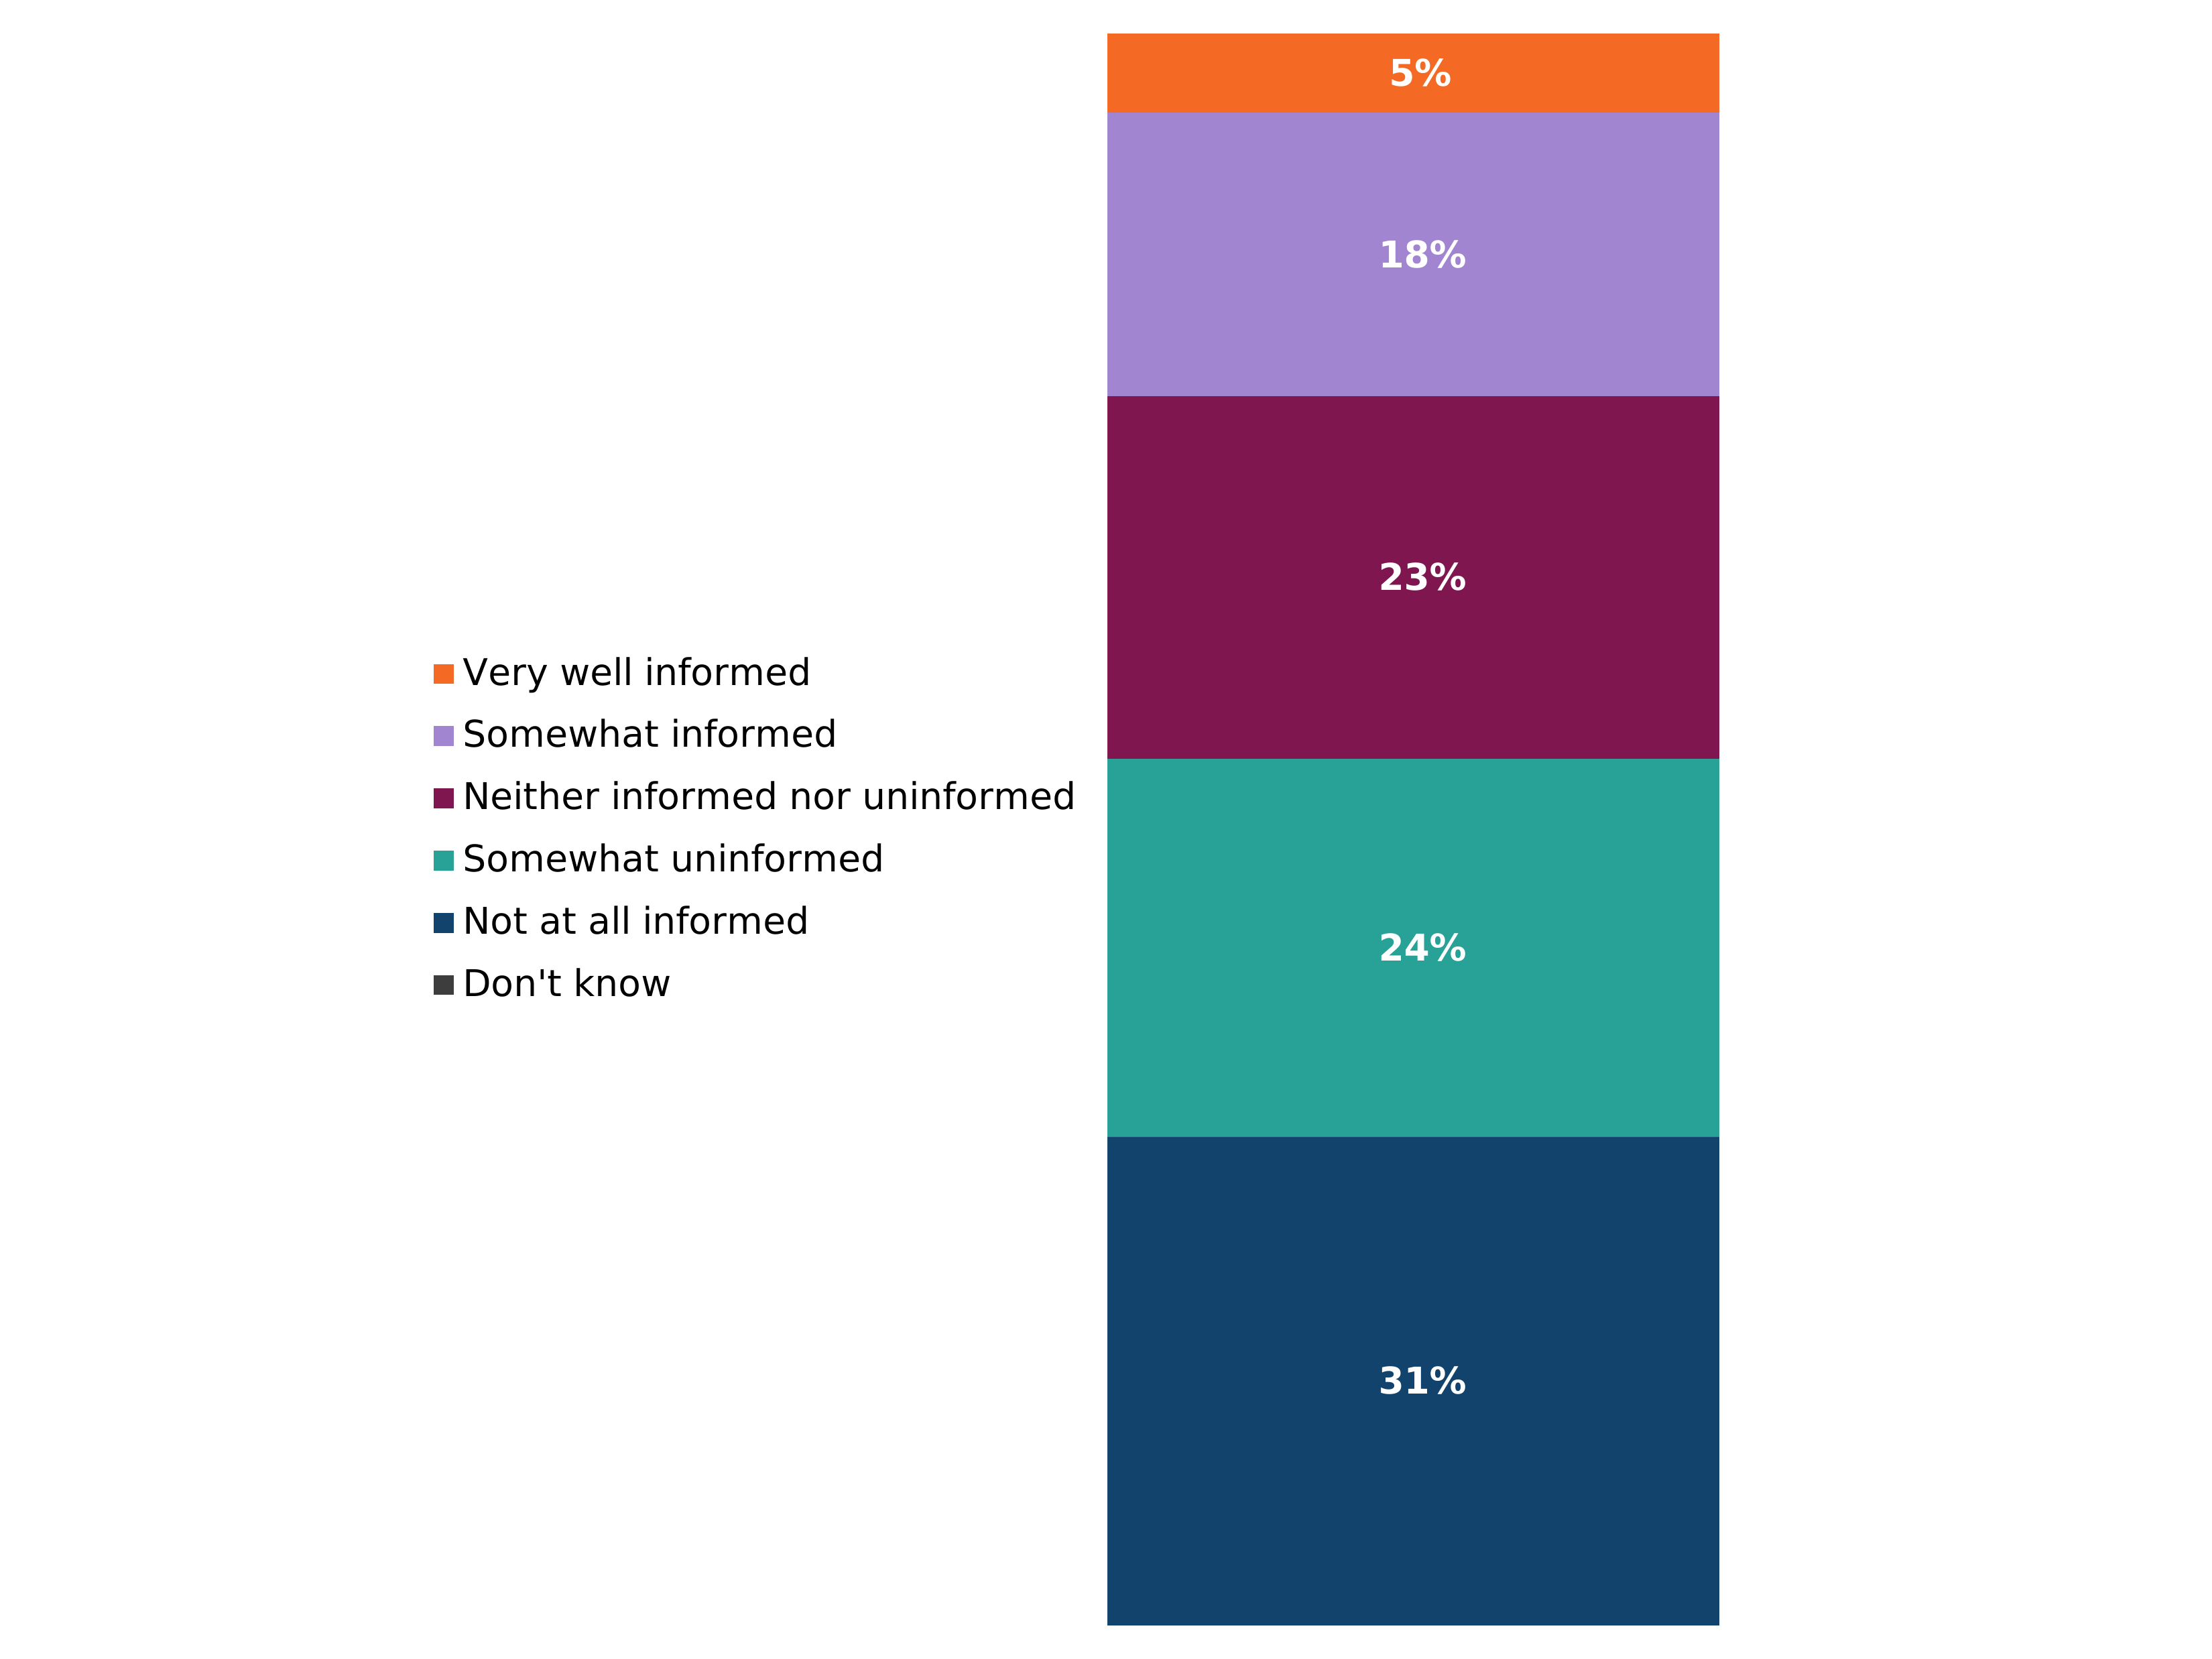
Figure note:
Source: Q20. How much do you know about what plans are in place in the UK to deal with large-scale emergencies/disasters? I am…
Base: All respondents in UK sample, 2025 (n=10,536); 2026 (n=10,791).
Due to rounding, the percentages for Q20 add up to 101%.
Figure 3.4: 2025 to 2026 comparison of how informed respondents reported being about plans in place in the UK to deal with large-scale emergencies/disasters (showing % of respondents) (see UK WoW table 68 (ODS, 1.47MB))
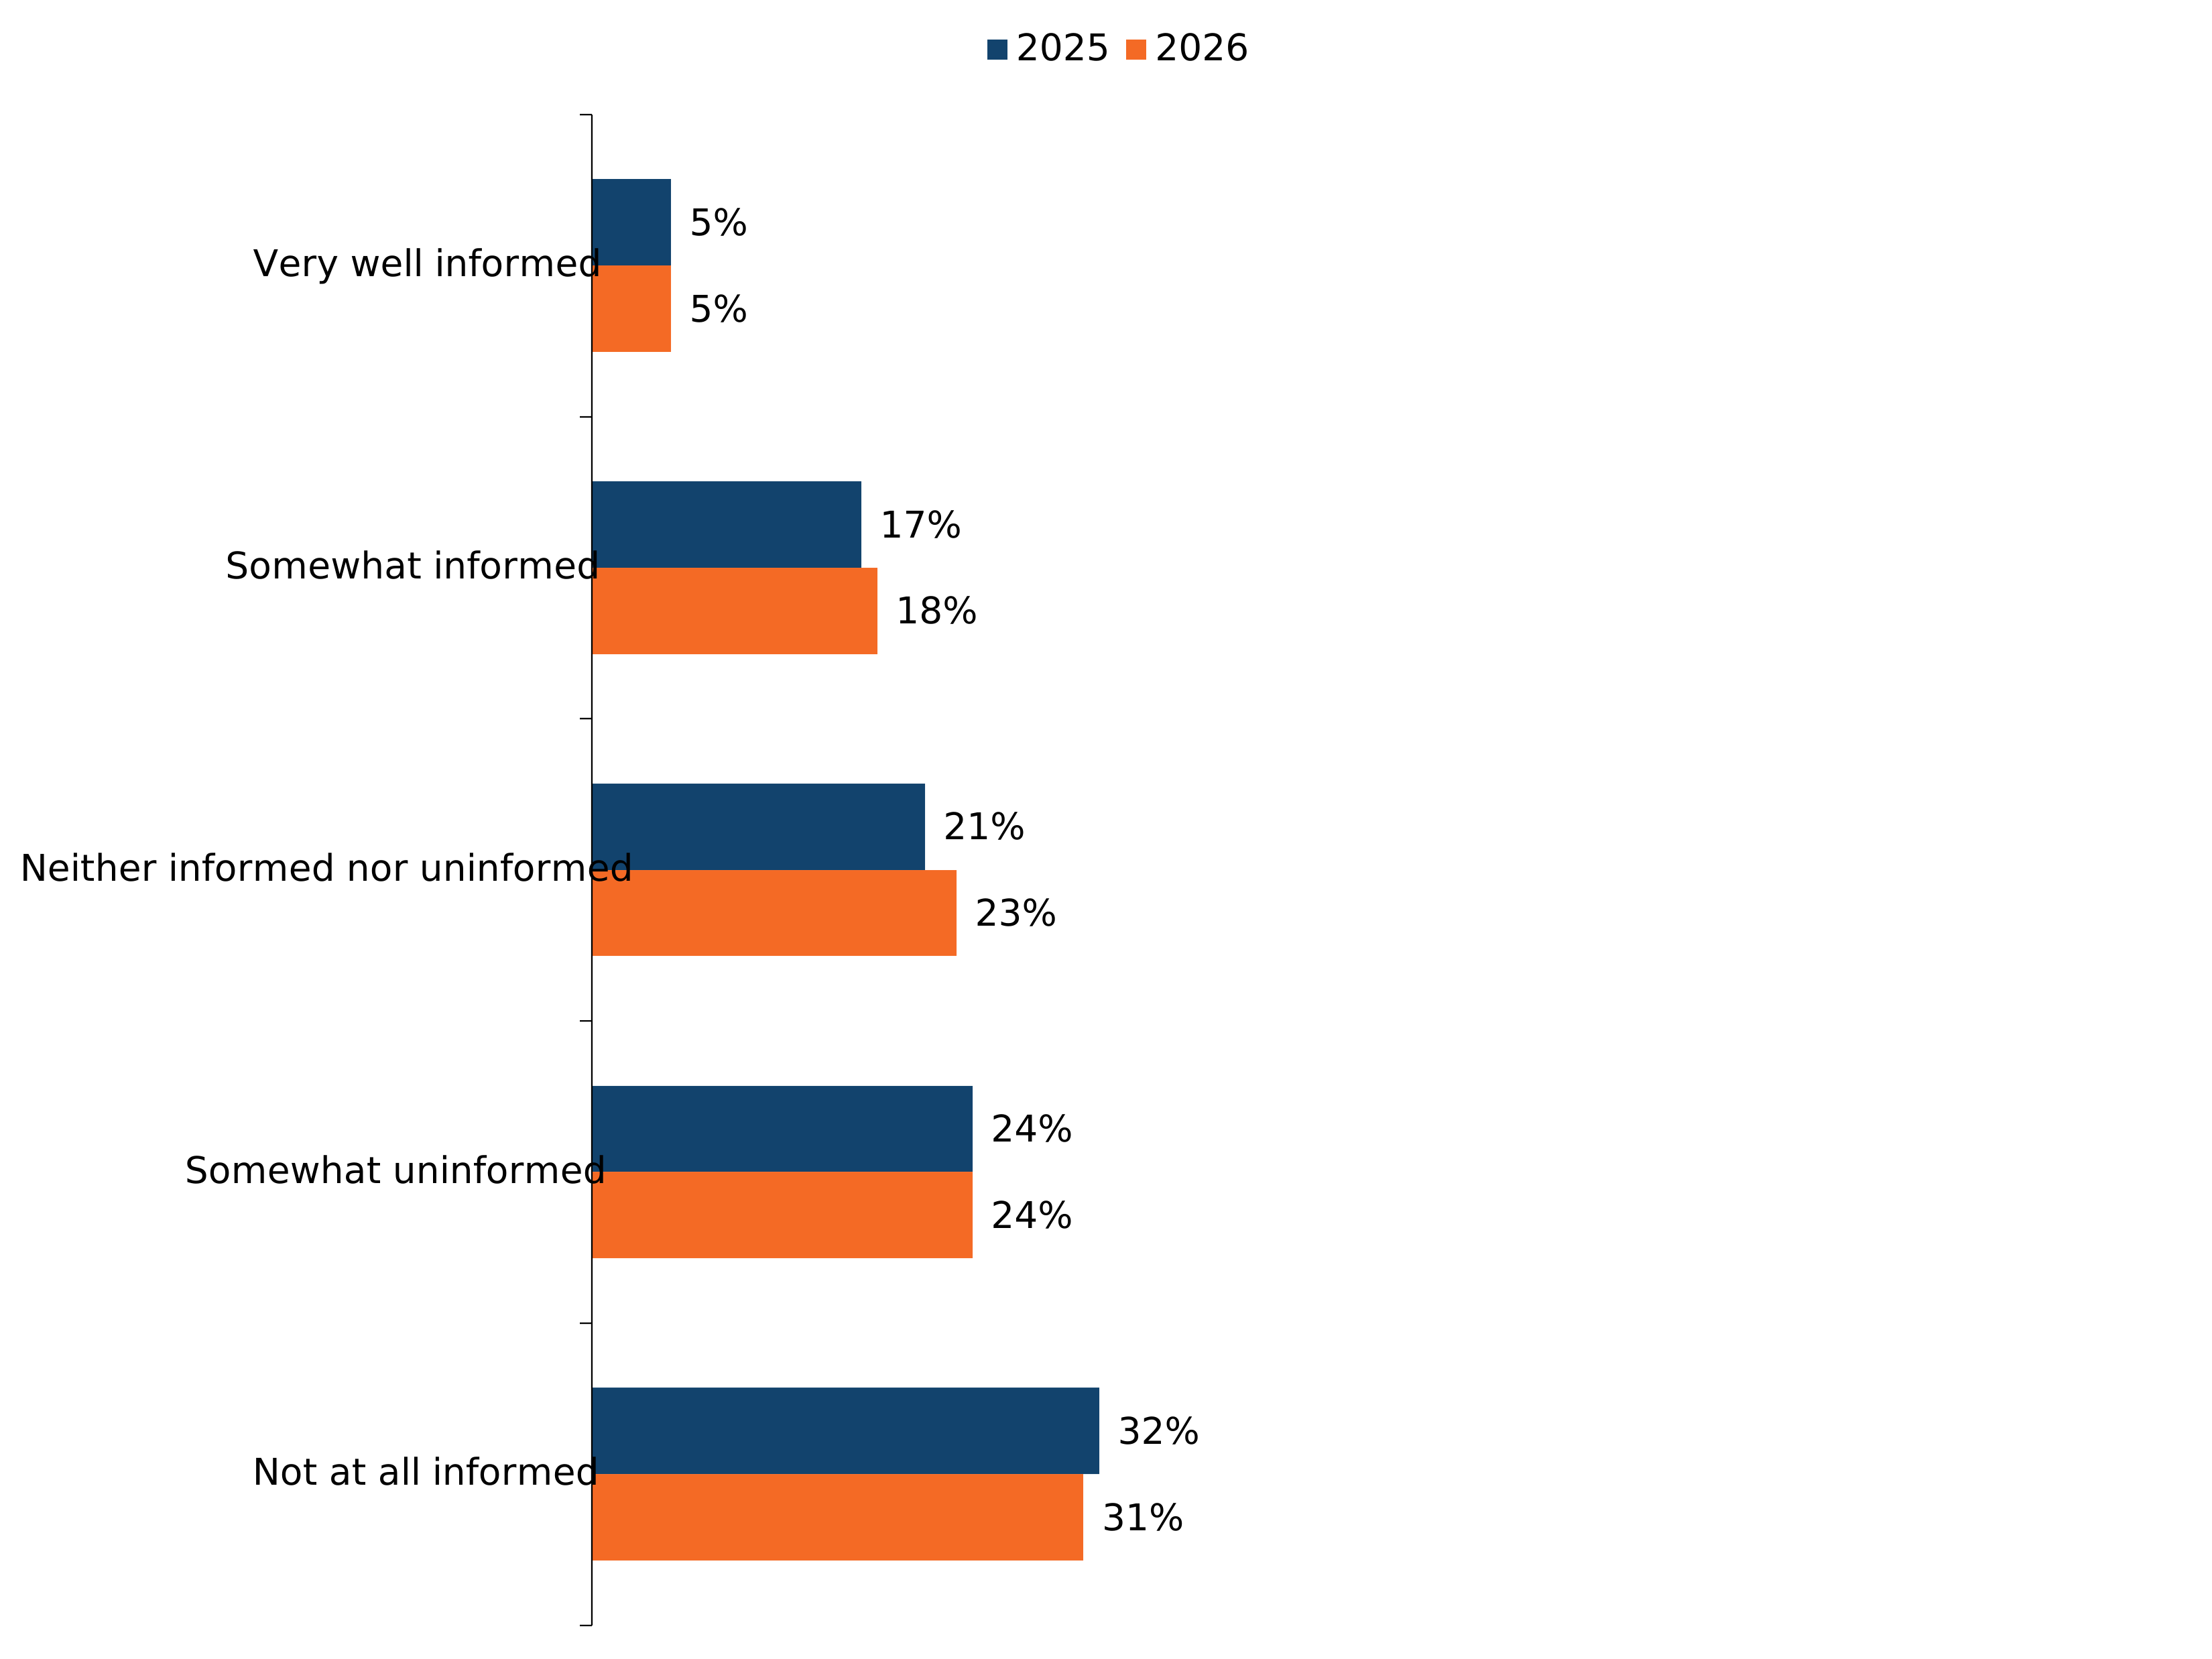
Figure note:
Source: Q20. How much do you know about what plans are in place in the UK to deal with large-scale emergencies/disasters? I am…
Base: All respondents in UK sample, 2025 (n=10,536); 2026 (n=10,791).
Due to rounding, the percentages for Q20 add up to 101% in 2026.
The majority (84%) of respondents thought it was either very or somewhat important for the government to share information with the public about what plans are in place to deal with large-scale emergencies/disasters, whereas 3% thought it was either not important or not at all important for the government to share this information.
Compared to 2025, views on the importance of government information sharing remained stable, with the proportion who thought it was important remaining unchanged (84%) and those who thought it was not important falling one percentage point (4% to 3%).
Figure 3.5: How important respondents thought it was for the government to share information with the public about large-scale emergency/disaster plans (showing % of respondents) (see UK 2026 table 69 (ODS, 1.15MB))
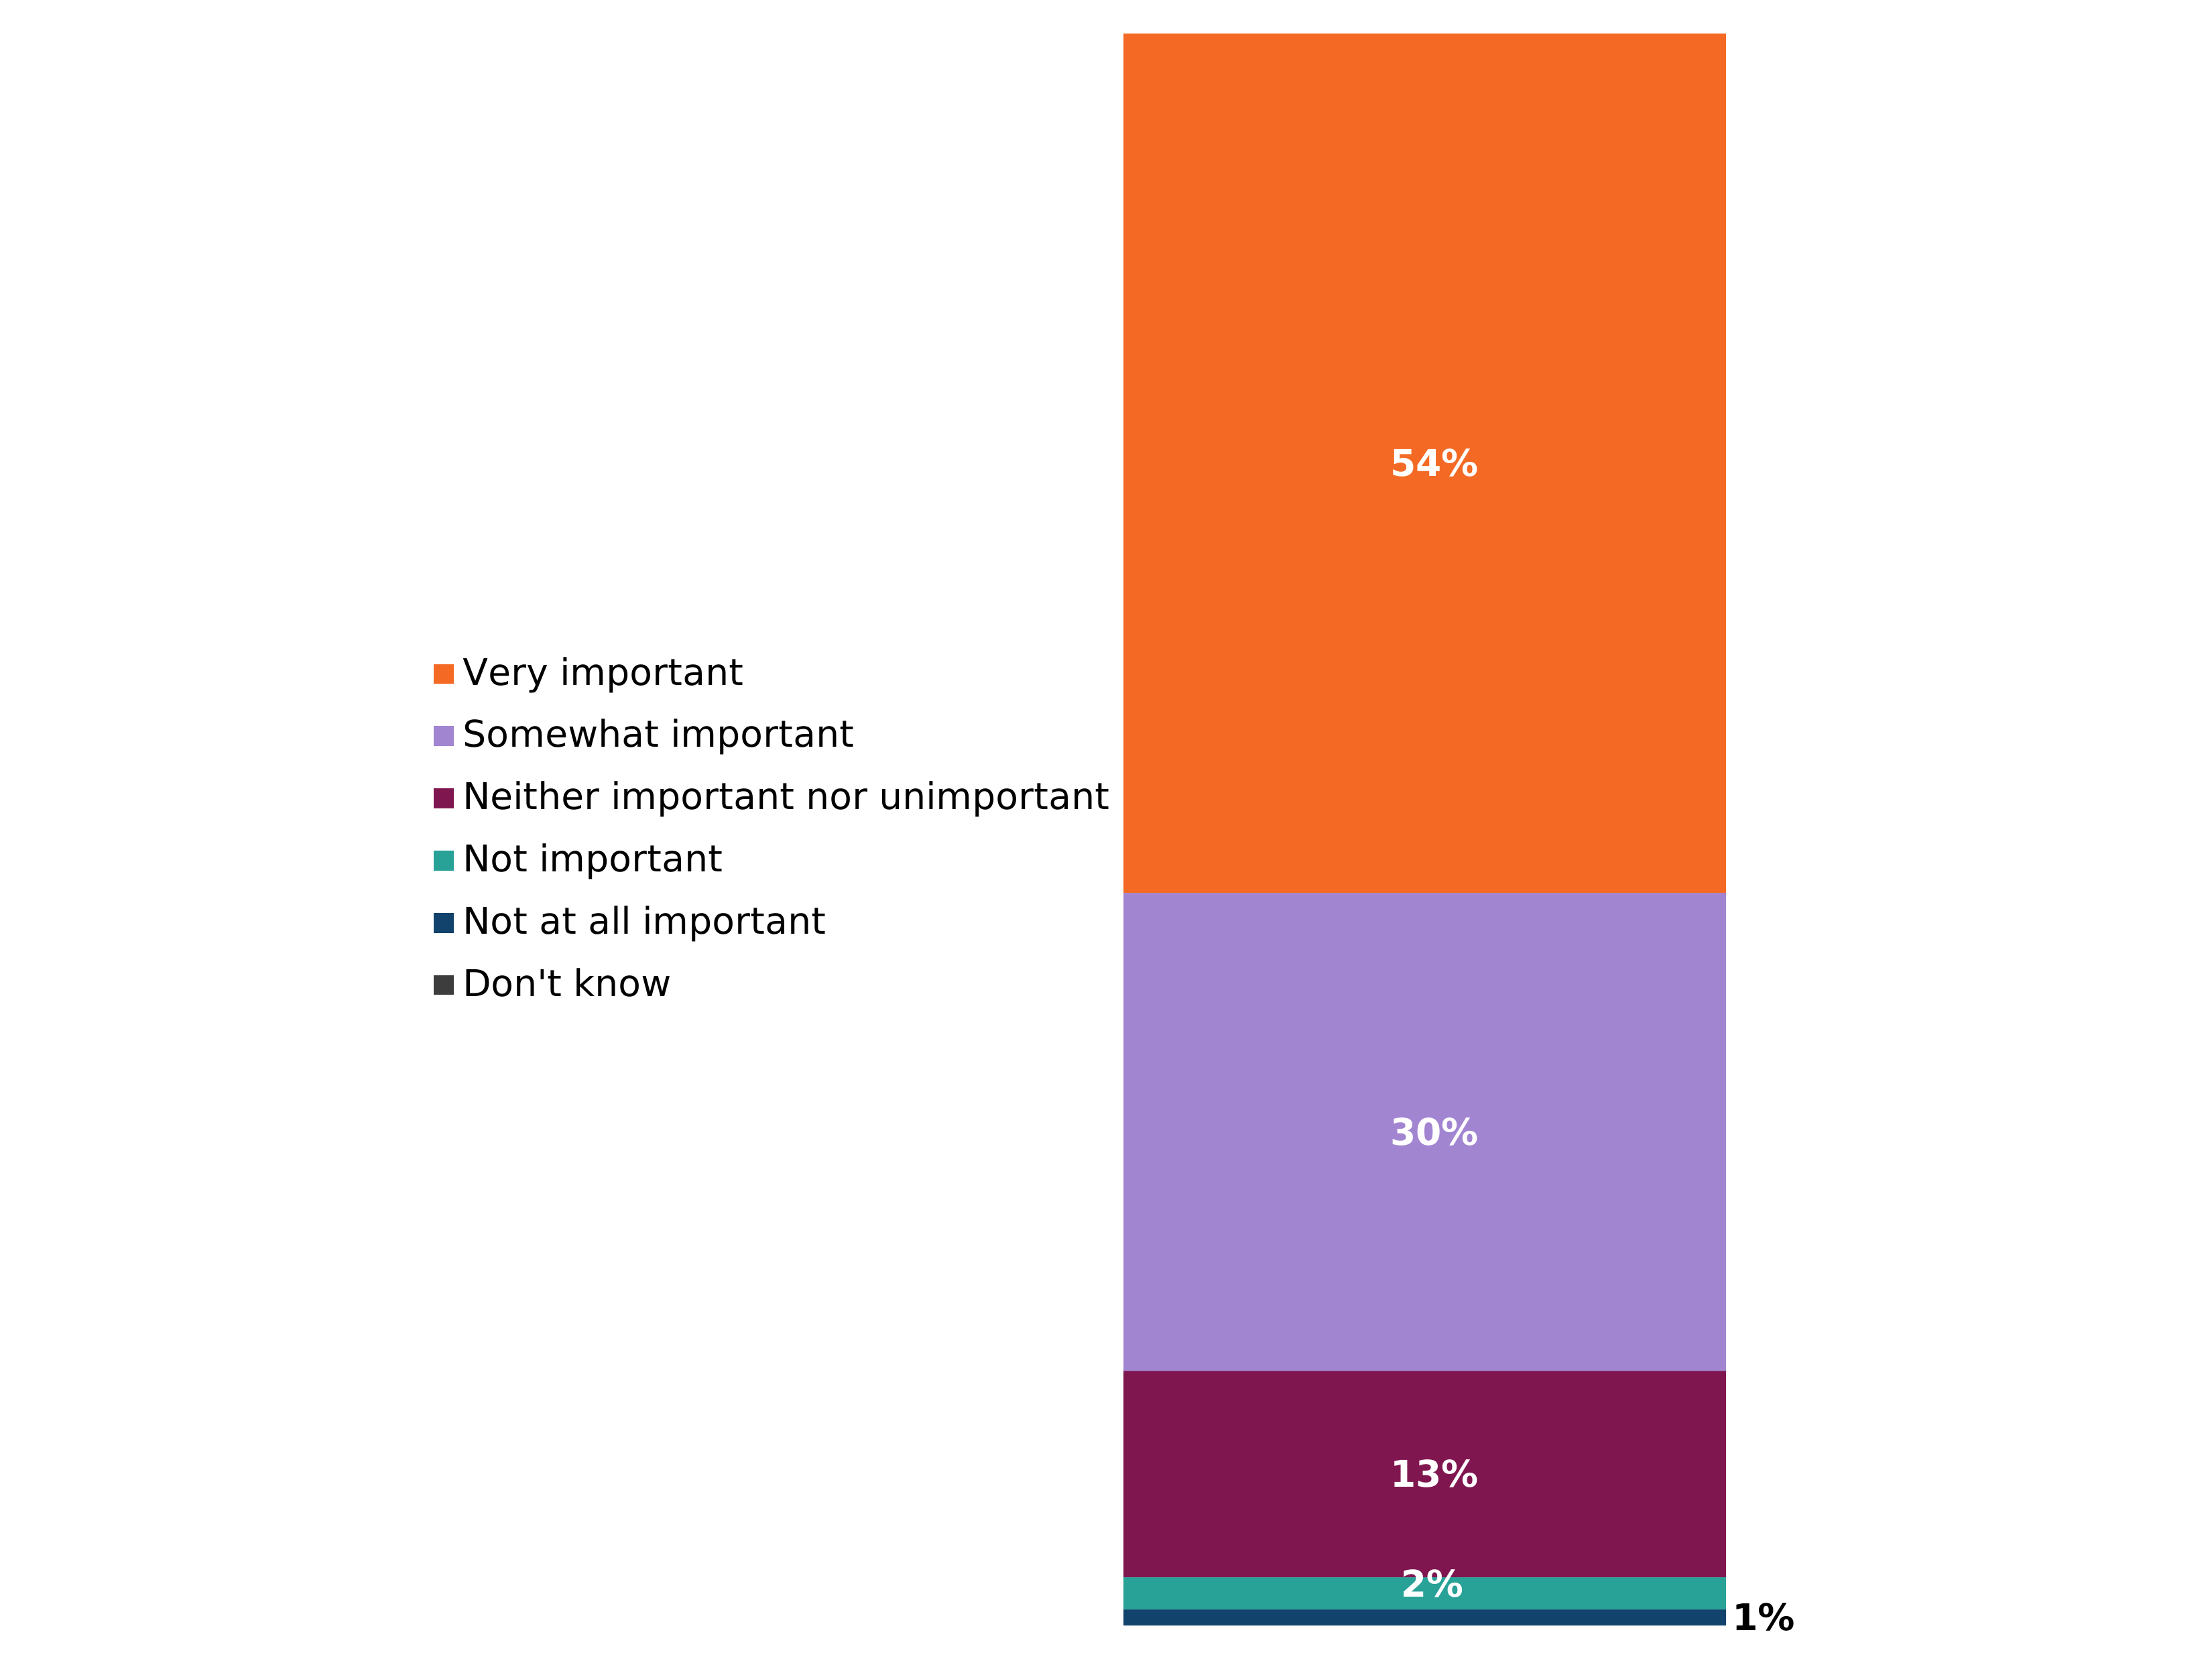
Figure note:
Source: Q21. How important, if at all, do you think it is for the government to share information with the public about what plans are in place to deal with large-scale emergencies/disasters?
Base: All respondents in UK sample, 2026 (n=10,791).
Figure 3.6: 2025 to 2026 comparison of how important respondents thought it was for the government to share information with the public about large-scale emergency/disaster plans (showing % of respondents) (see UK WoW table 69 (ODS, 1.47MB))
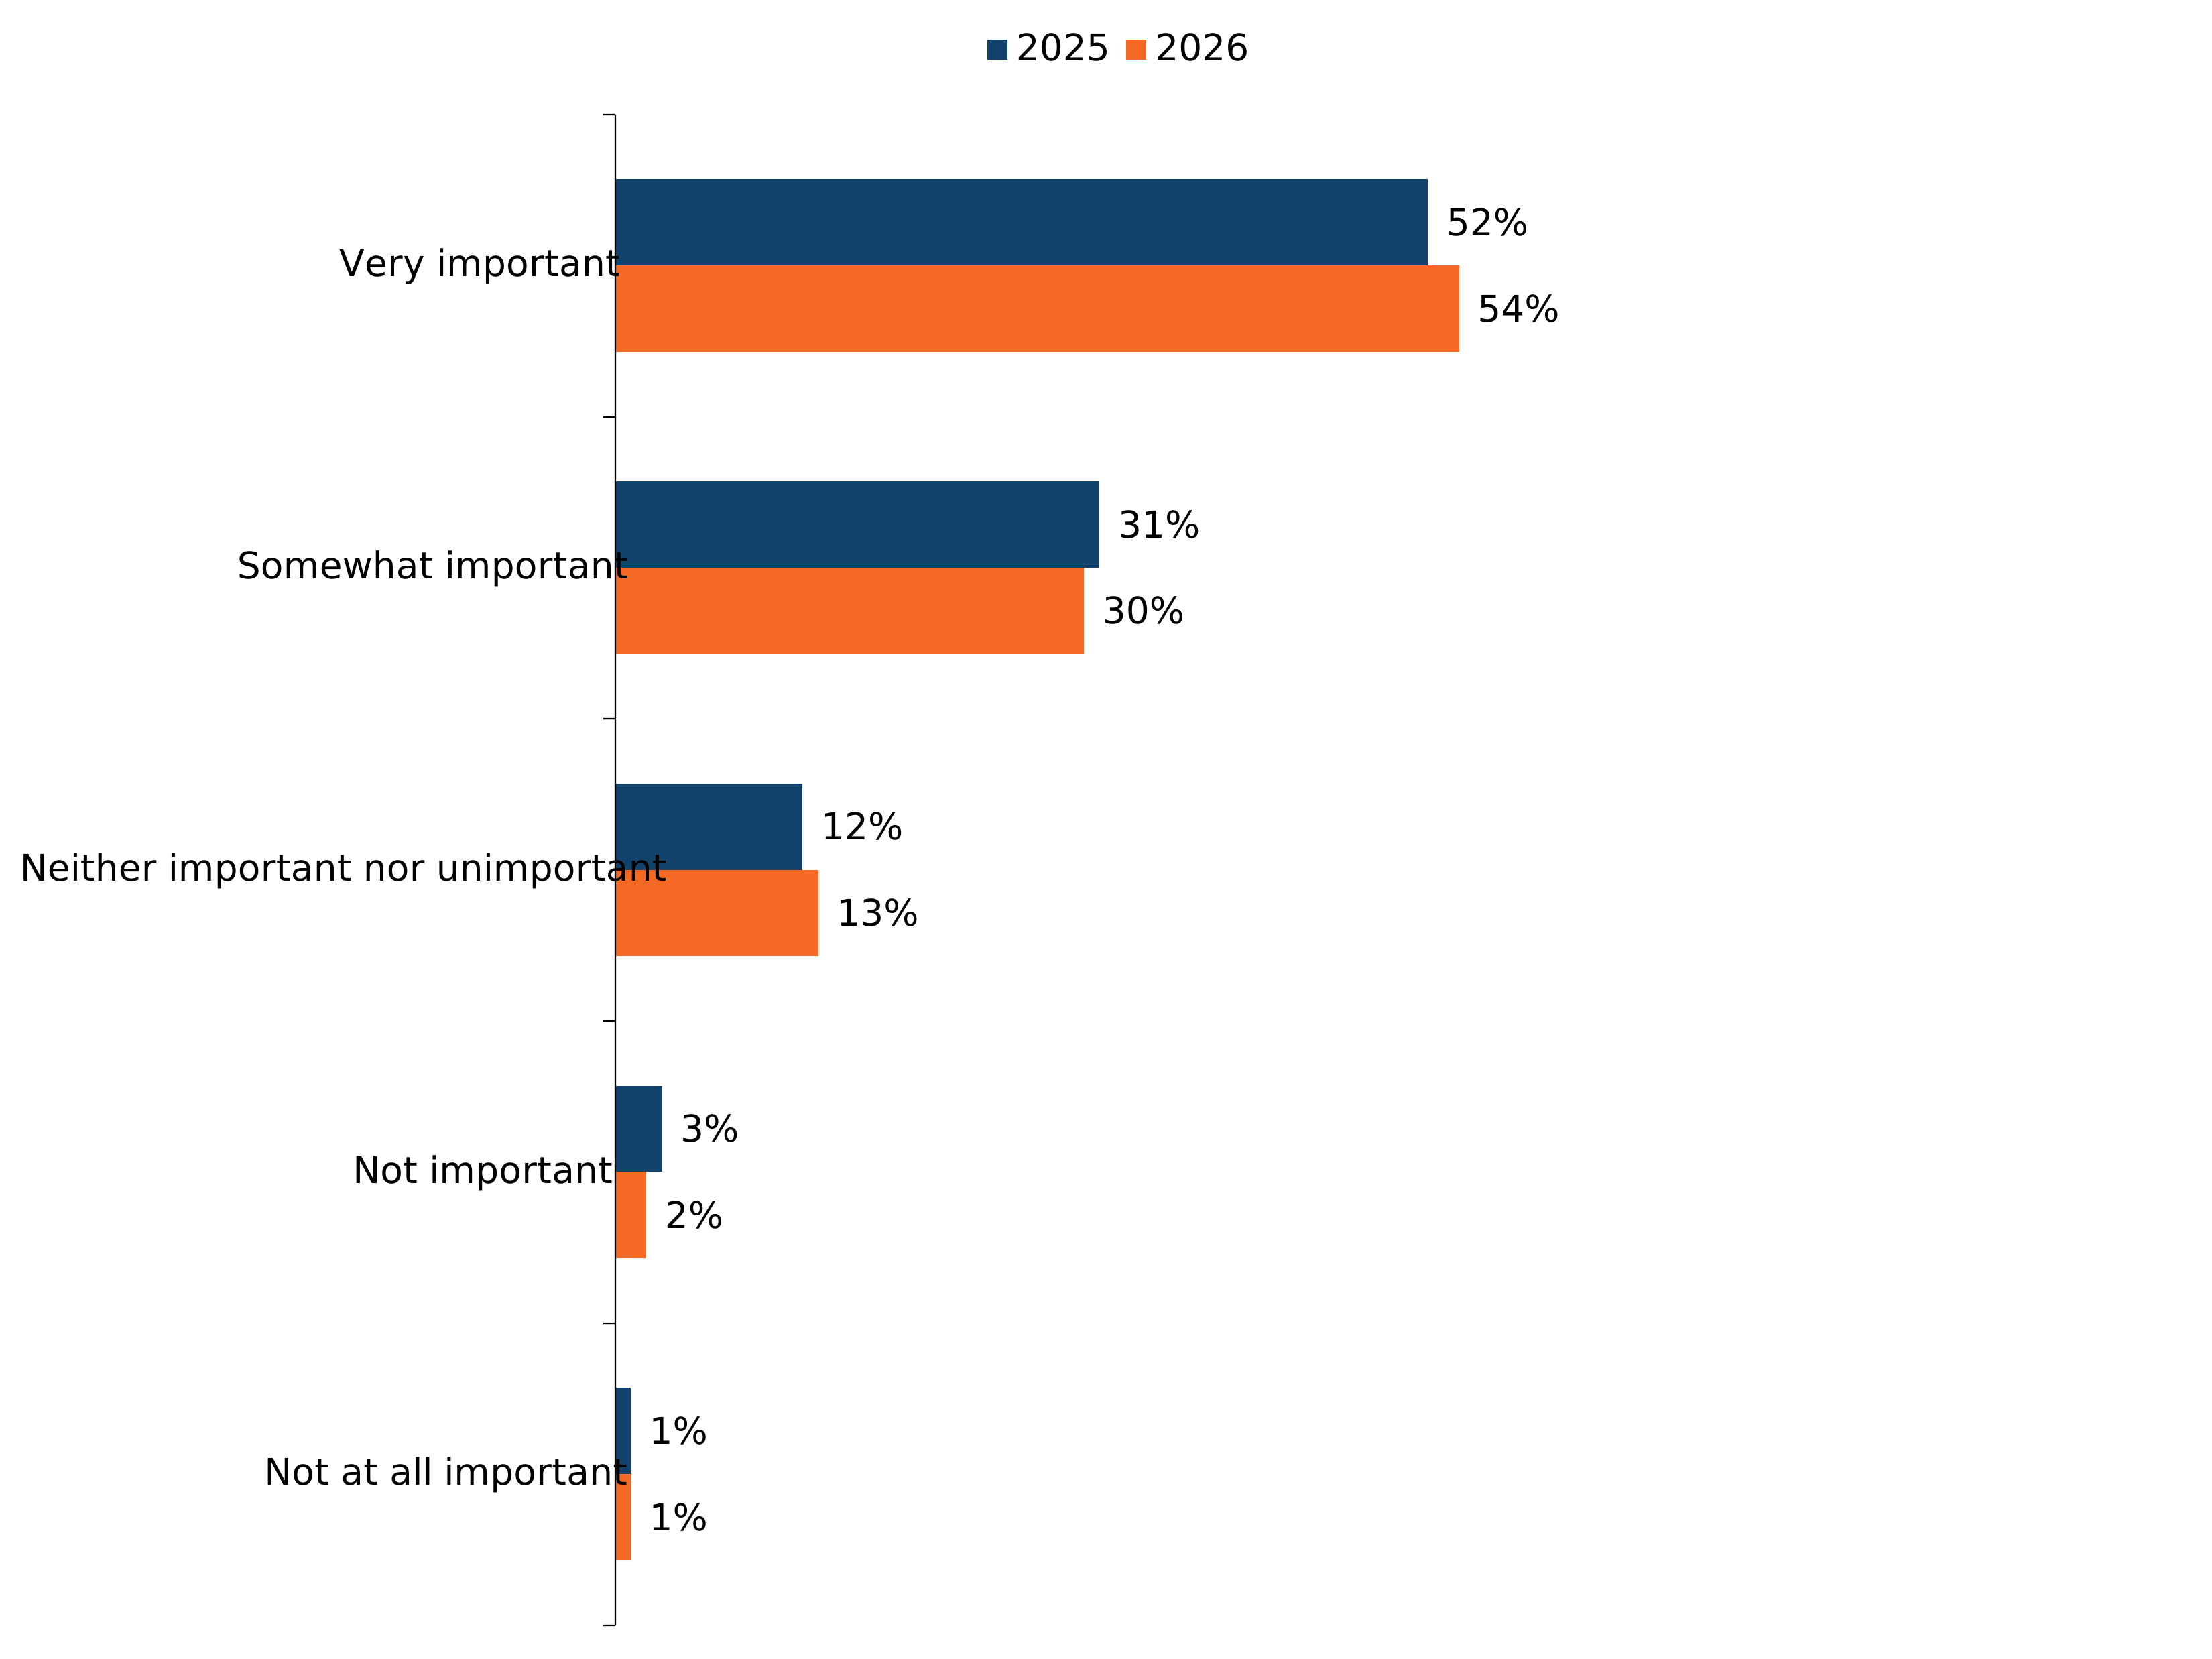
Figure note:
Source: Q21. How important, if at all, do you think it is for the government to share information with the public about what plans are in place to deal with large-scale emergencies/disasters?
Base: All respondents in UK sample, 2025 (n=10,536); 2026 (n=10,791).
Due to rounding, the percentages for Q21 add up to 99% in 2025.
The majority (84%) of survey respondents thought it was either very or somewhat important for the government to provide information on what they can do personally or within their household, to be more prepared for large-scale emergencies/disasters, whereas 4% thought it was either not important or not at all important for the government to provide them with this information.
Compared to 2025, views on the importance of the government providing household preparedness information remained stable, with the proportion who thought it was important unchanged at 84% and those who thought it was not important falling one percentage point (5% to 4%).
Figure 3.7: How important respondents thought it was for the government to provide them with information on what they can do to be more prepared for large-scale emergencies/disasters (showing % of respondents) (see UK 2026, table 70 (ODS, 1.15MB))
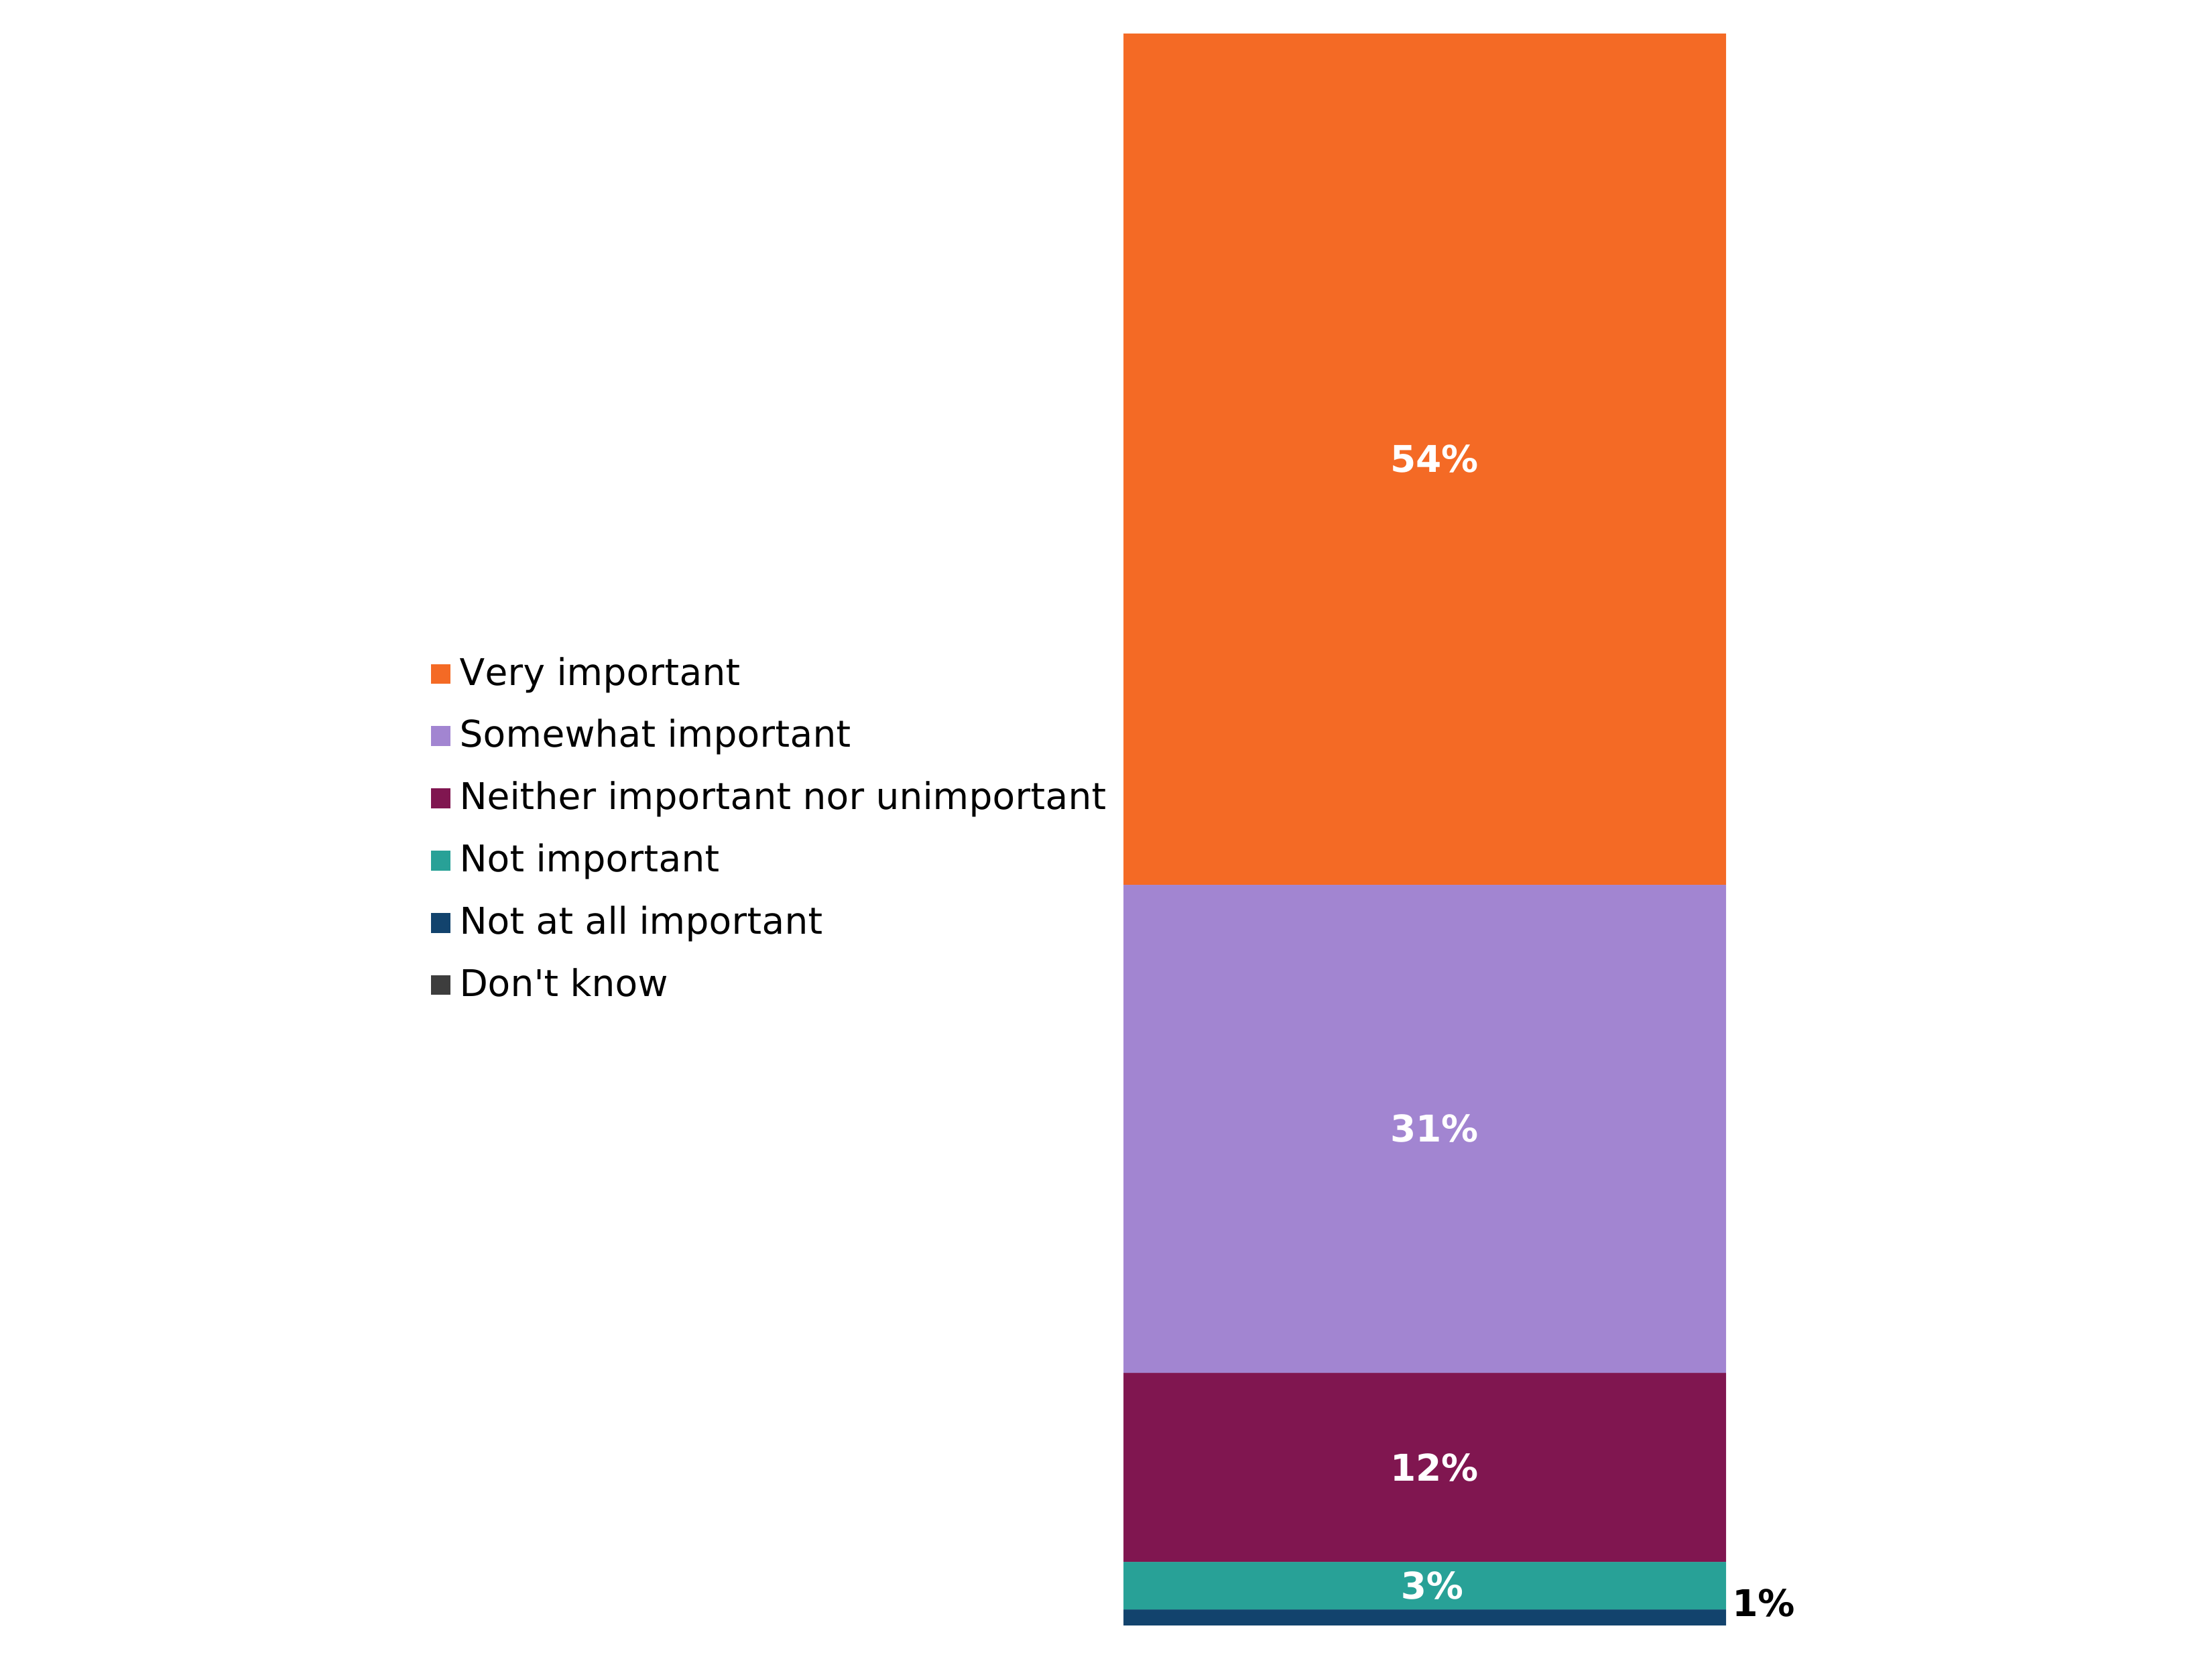
Figure note:
Source: Q22. How important do you think it is for the government to provide you with information on what you can do personally, or within your household, to be more prepared for large-scale emergencies/disasters?
Base: All respondents in UK sample, 2026 (n=10,791).
Due to rounding, the percentages for Q22 add up to 101%.
Figure 3.8: 2025 to 2026 comparison of how important respondents thought it was for the government to provide them with information on what they can do to be more prepared for large-scale emergencies/disasters, 2025 to 2026 (showing % of respondents) (see UK WoW, table 70 (ODS, 1.47MB))
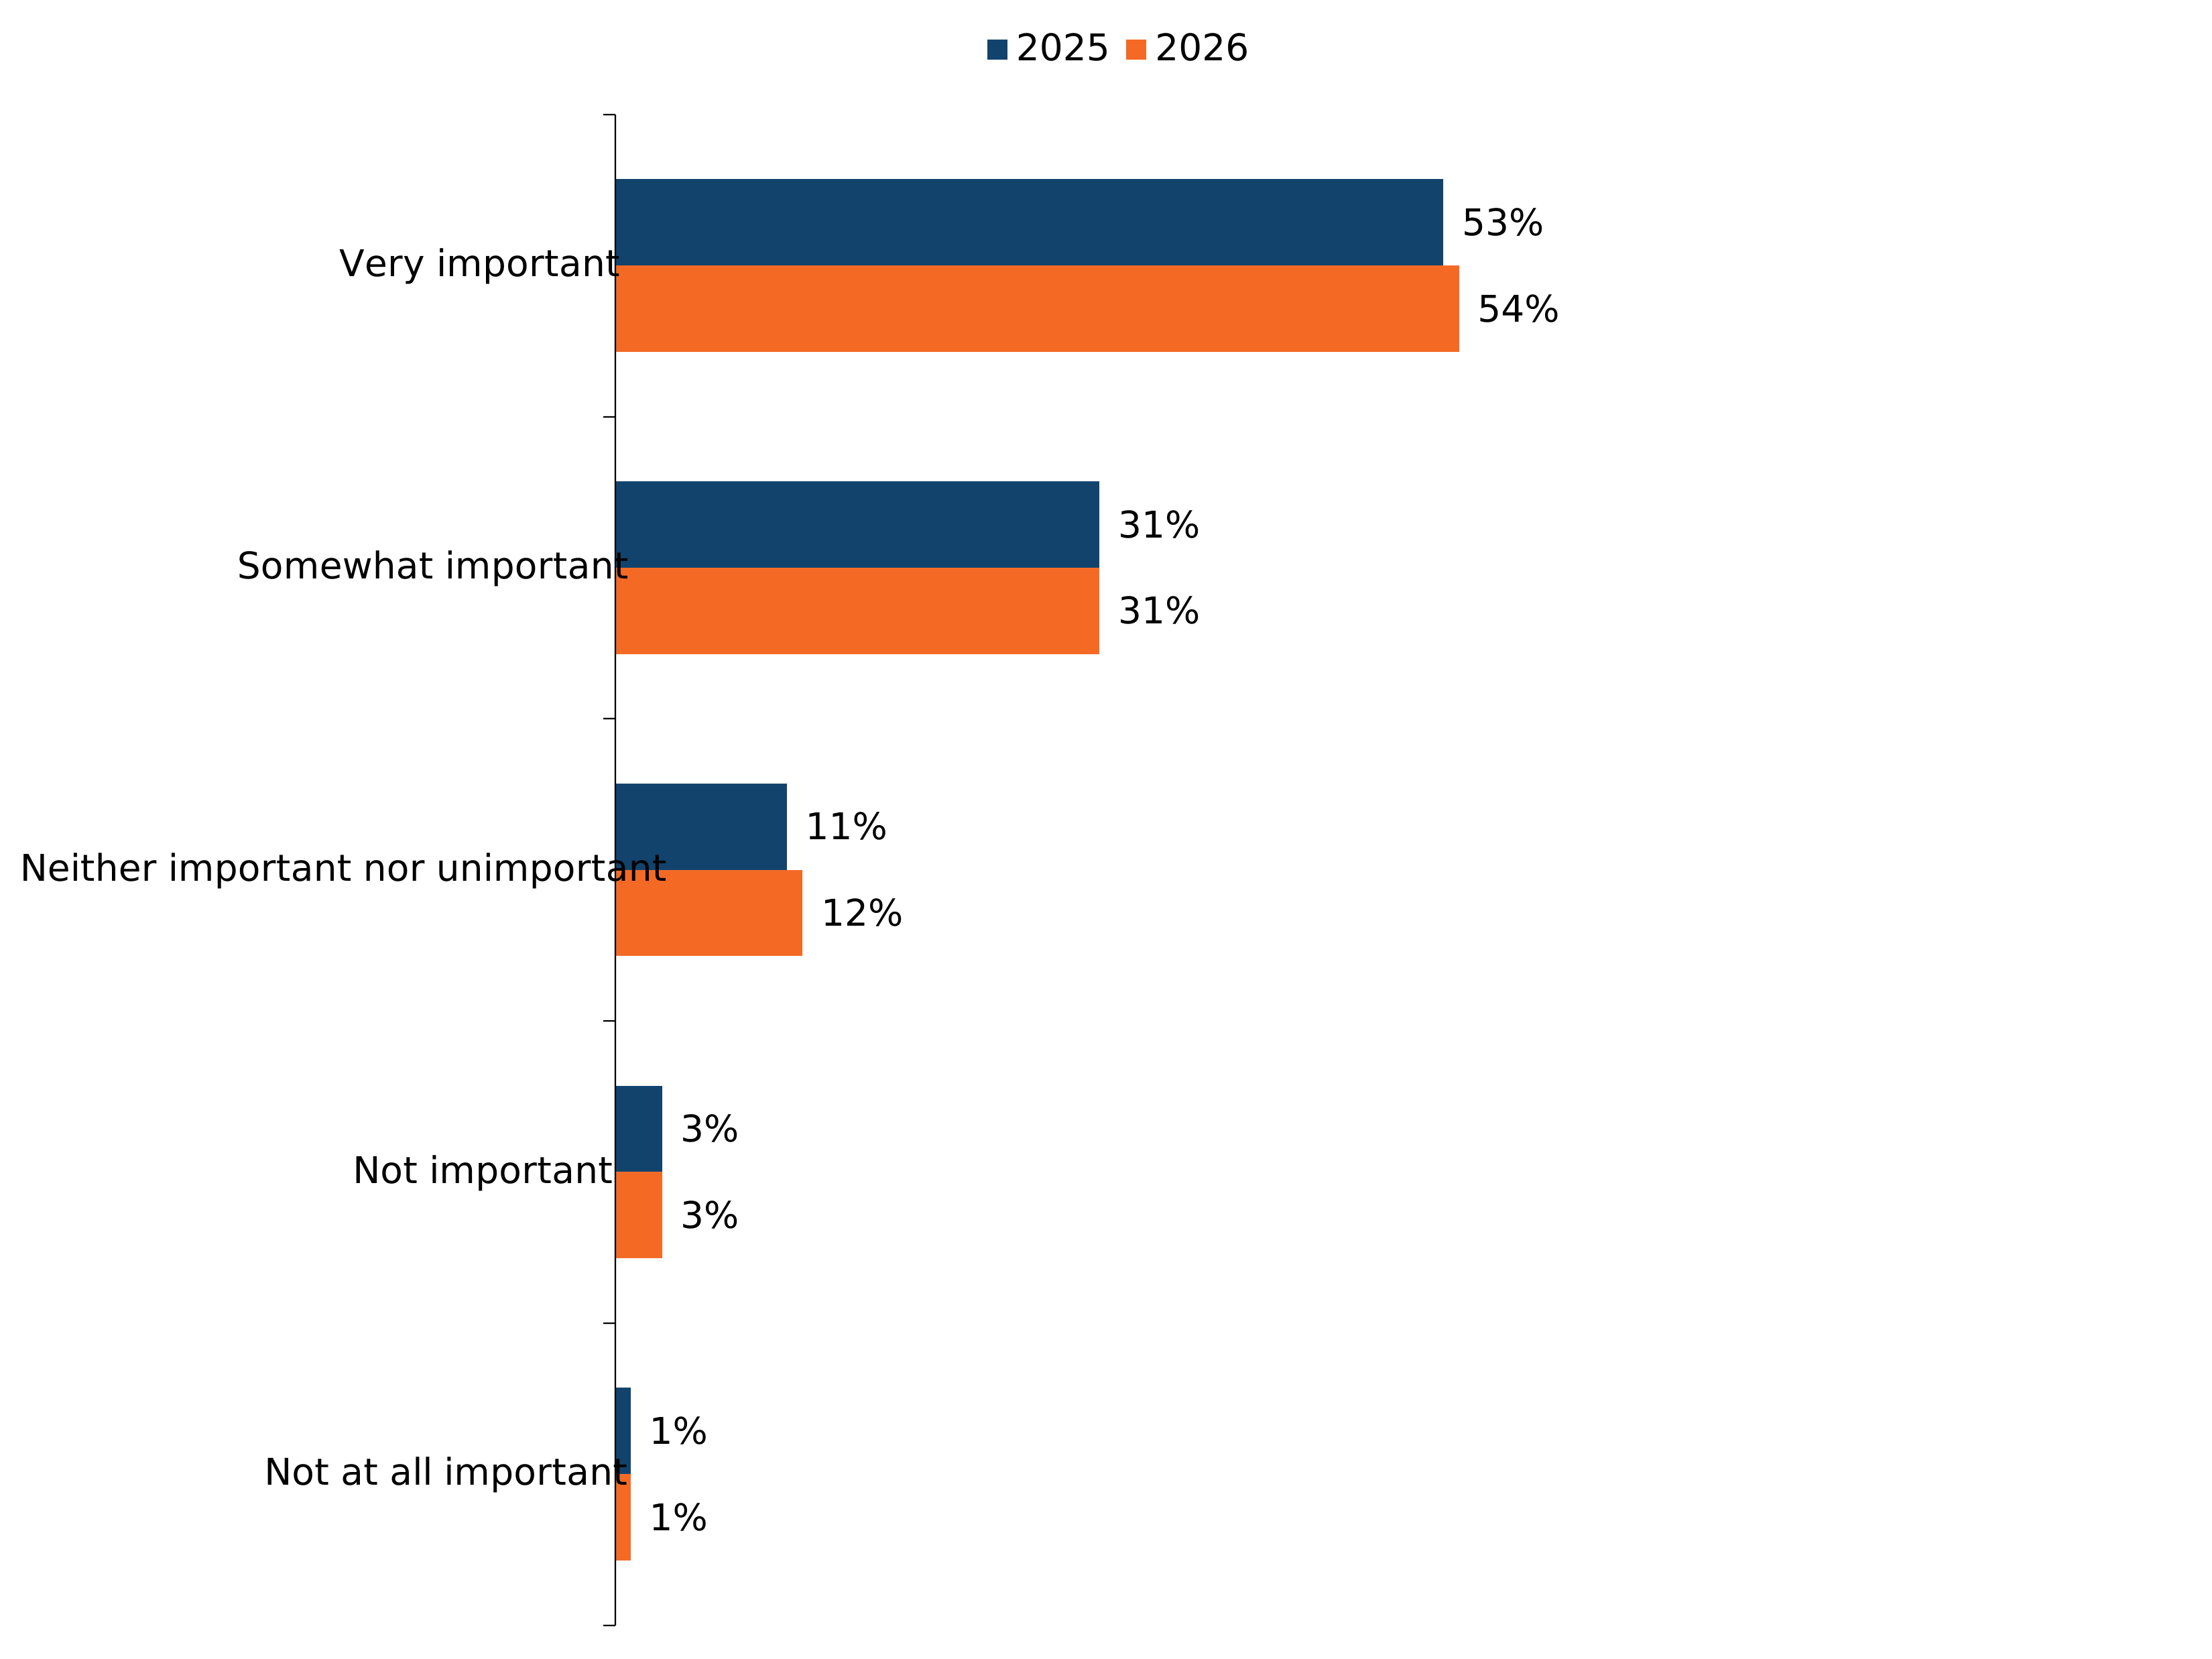
Figure note:
Source: Q22. How important do you think it is for the government to provide you with information on what you can do personally, or within your household, to be more prepared for large-scale emergencies/disasters?
Base: All respondents in UK sample, 2025 (n=10,536); 2026 (n=10,791).
Due to rounding, the percentages for Q22 in 2025, add up to 99%, and the percentages for Q22 in 2026 add up to 101%.
Preparedness actions and supplies
Emergency supplies people have at home and preparedness actions undertaken
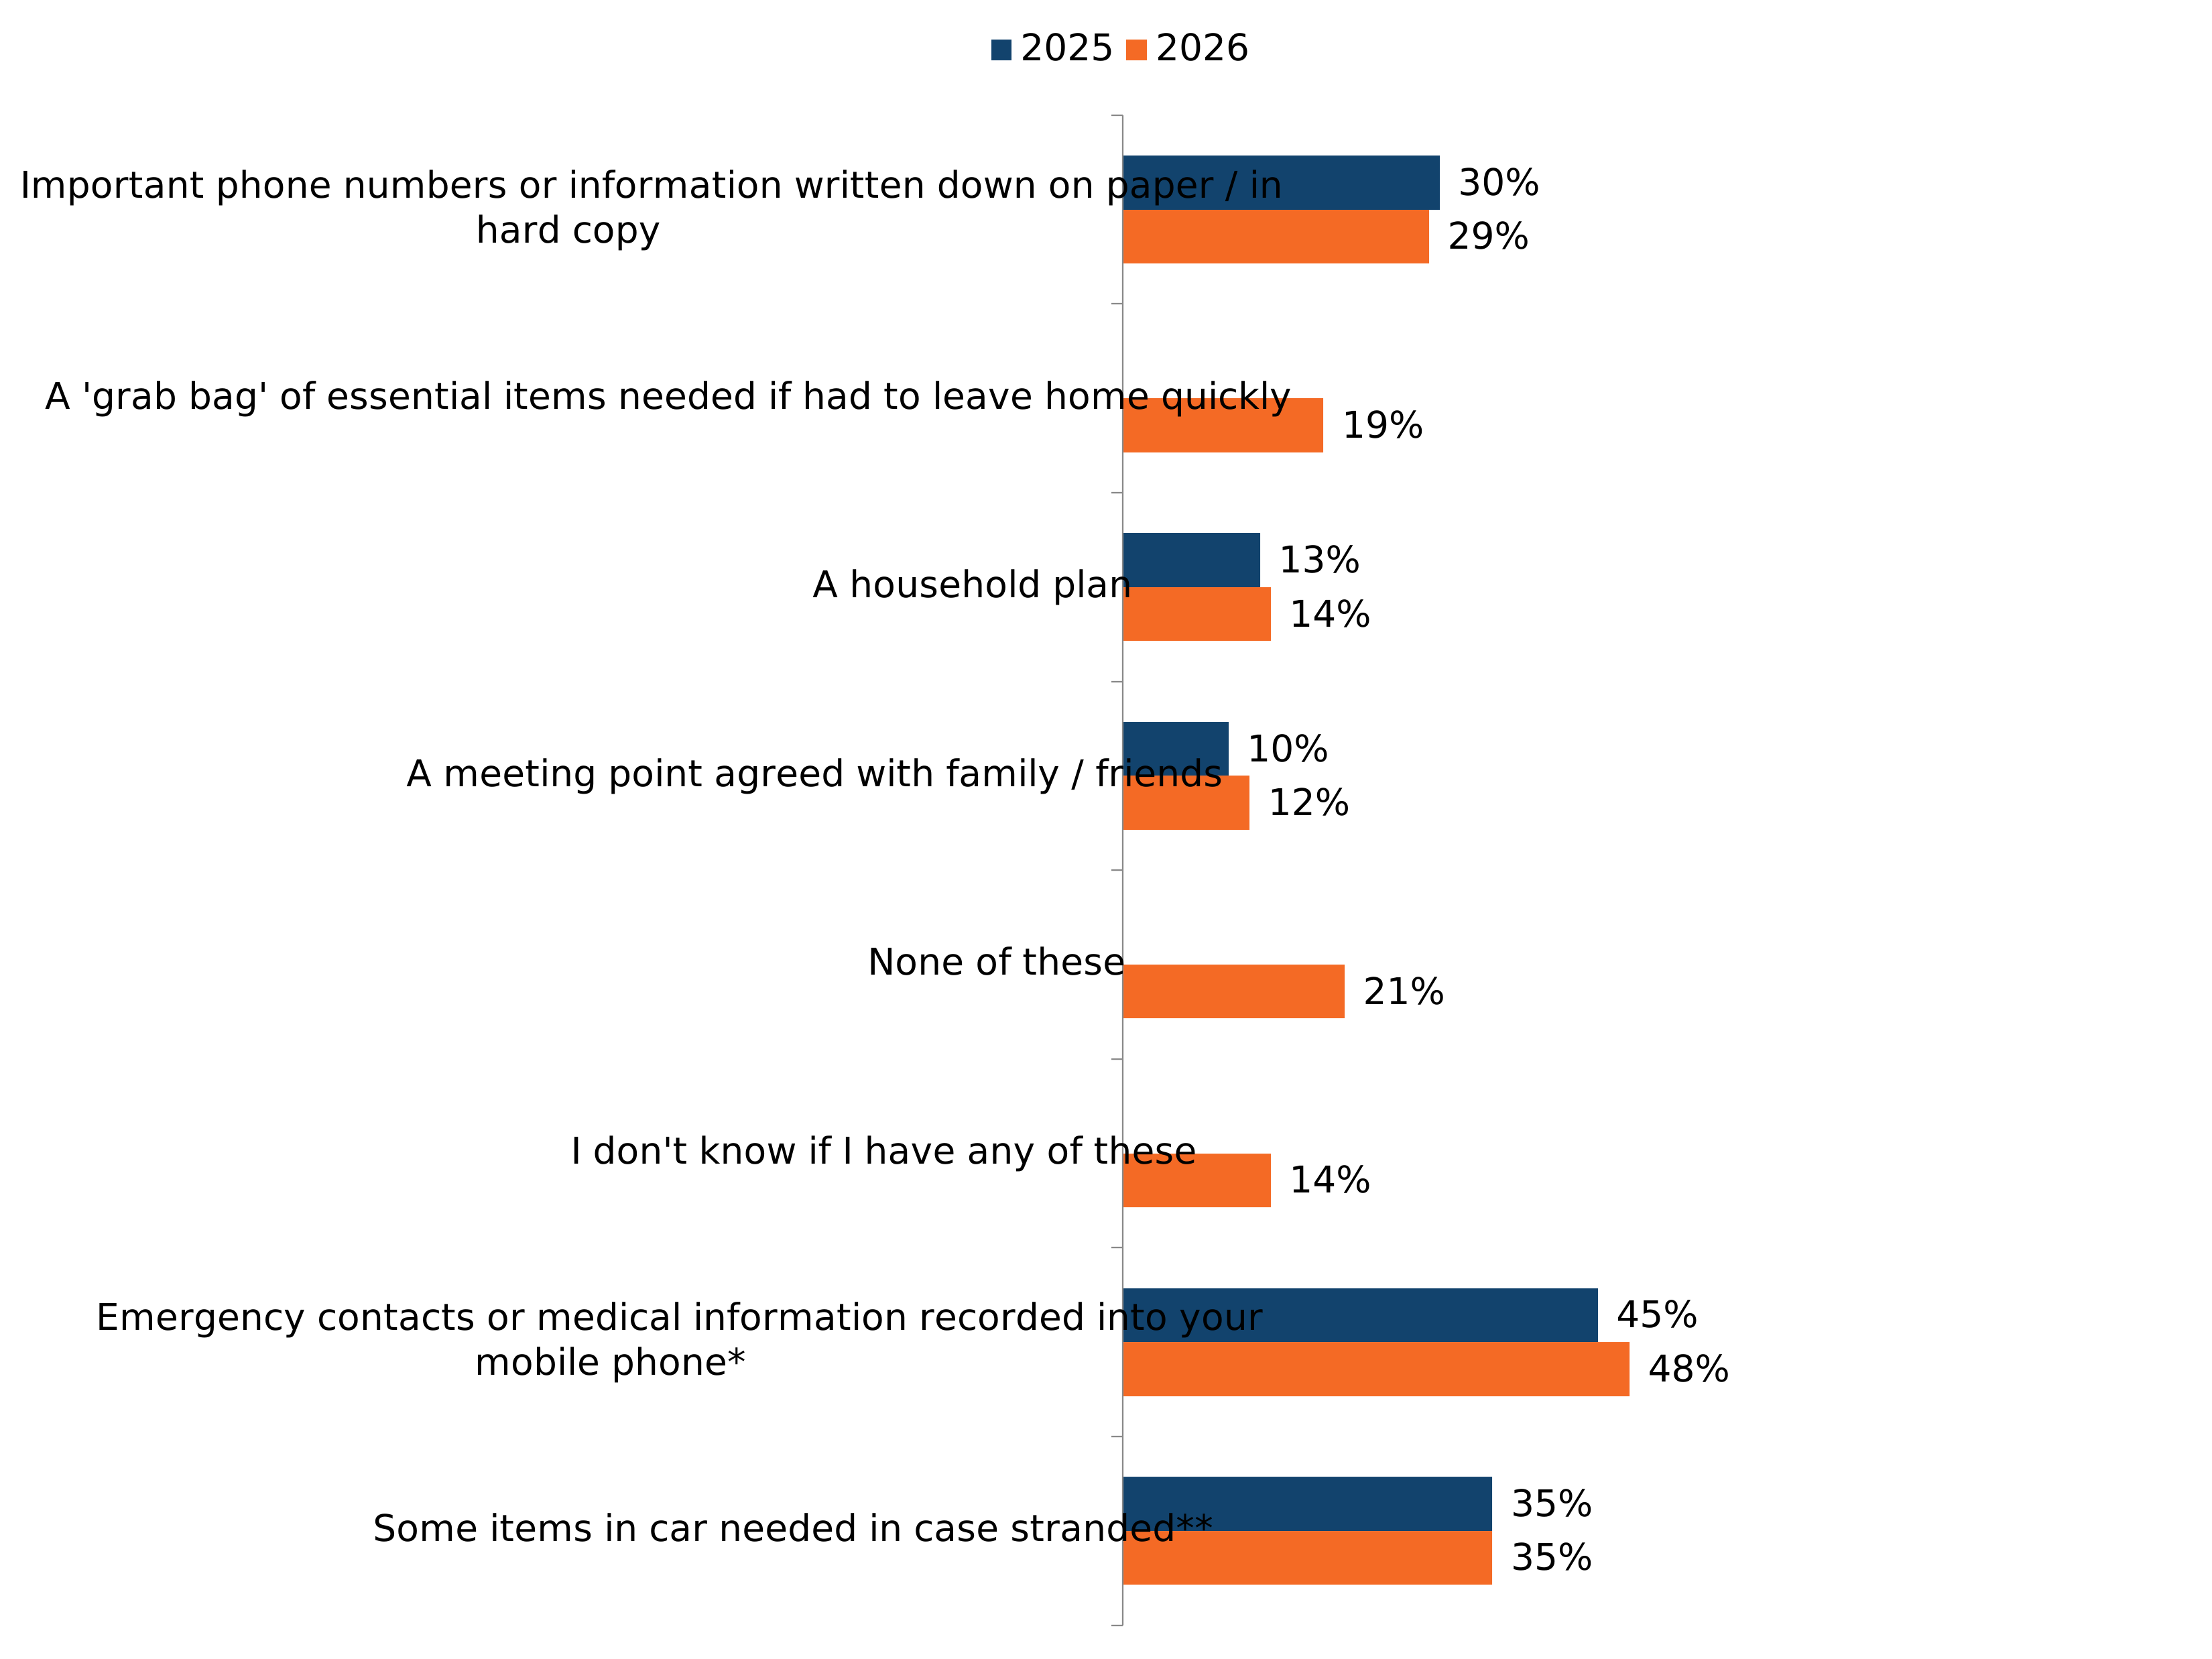
When asked about emergency/disaster-related items or preparation, 48% of survey respondents (who reported having a mobile phone) reported having emergency contacts or medical information recorded into their mobile phone. 35% of respondents (who had a car) reported keeping some items in their car that they might need if they were stranded. 29% of respondents reported that they had important phone numbers or information written down on paper or in hard copy. 19% reported having a ‘grab bag’ of essential items needed if they needed to leave their home quickly. 21% reported not having any of the items or undertaking any of the preparations listed in the question.
Compared to 2025, the proportion of respondents reporting that they had different emergency/disaster related objects or information were largely stable. There was a small increase in the proportion of respondents who reported having emergency contacts or medical information recorded in their mobile phone (45% to 48%) and in those who reported having a meeting point agreed with family or friends (10% to 12%). The proportion reporting having some items in a car in case stranded remained unchanged (35%). There was little change in the proportion reporting having important phone numbers or information written down on paper or in hard copy (30% to 29%) or having a household plan (13% to 14%).
Note: In 2025 the list of items included in this question included more options than it did in 2026, as the statement “Some essential items needed for power cuts stored in one place” was included in 2025 but not in 2026. This may have influenced responses, as participants could have been less likely to select ‘None of these’ or ‘I don’t know if I have any of these’ in 2025 than in 2026 because of the greater number of response options. As a result, these metrics should not be interpreted as a change over time, and the 2025 proportions for these responses are not shown.
Note: The response option “A ‘grab bag’ of essential items you would need to take if you had to leave your home quickly” is not directly comparable with 2025. In 2025, the response option referred to some essential items stored in one place, such as in a cupboard or in a ‘grab bag’, whereas in 2026 it referred specifically to a ‘grab bag’ of essential items. As a result, this metric should not be interpreted as a change over time, and the 2025 proportion for this response is not shown.
Figure 4.1: Emergency/disaster-related objects or information that respondents have (showing % of respondents) (see UK table 72 (ODS, 1.15MB))
*Option only shown to respondents who said they had a mobile phone (see figure note below)
**Option only shown to respondents who said they had a car (see figure note below)
Options with different base sizes are presented at the bottom of the chart as they cannot be directly compared with options seen by the full sample.
Figure note:
Source: Q23. Do you currently have any of the following?
Some response options were only shown to certain respondents if they were applicable to their circumstances. This chart uses the following bases:
- All respondents in UK sample, 2025 (n=10,536); 2026 (n=10,791).
- Those who own a mobile phone (n=10,454); 2026 (n=10,714).
- Those who own a car, 2025 (n=8,030); 2026 (n=7,729).
The majority (59%) of survey respondents indicated that they were aware of how to turn off one or more of the water, electric or gas supply in their home, and 49% reported protecting one or more of their most important online accounts with 2-step verification. 21% of respondents reported being signed up for flood alerts, weather alerts or other warnings, 17% reported being a member of a neighbourhood instant messaging group and 8% reported being a member of a community/volunteer group or social club that is active in emergency preparedness, response or recovery.
Compared to 2025, behaviours and preparedness-related actions were largely stable. There was a small increase in the proportion who had signed up for flood alerts, weather alerts or other warnings (19% to 21%) and in those who said they were members of a community or volunteer group active in emergency preparedness, response or recovery (7% to 8%). The percentage of respondents who reported protecting one or more of their important accounts (49%) and being a member of a neighbourhood instant messaging or closed social media group (17%) remained unchanged. There was a marginal decrease in the proportion of respondents saying they were aware of how to turn off one or more of the water, electric or gas supply in their home (60% to 59%).
Figure 4.2: 2025 to 2026 comparison of statements respondents said applied to them. (showing % of respondents) (see UK WoW table 73 (ODS, 1.47MB))
I am currently…
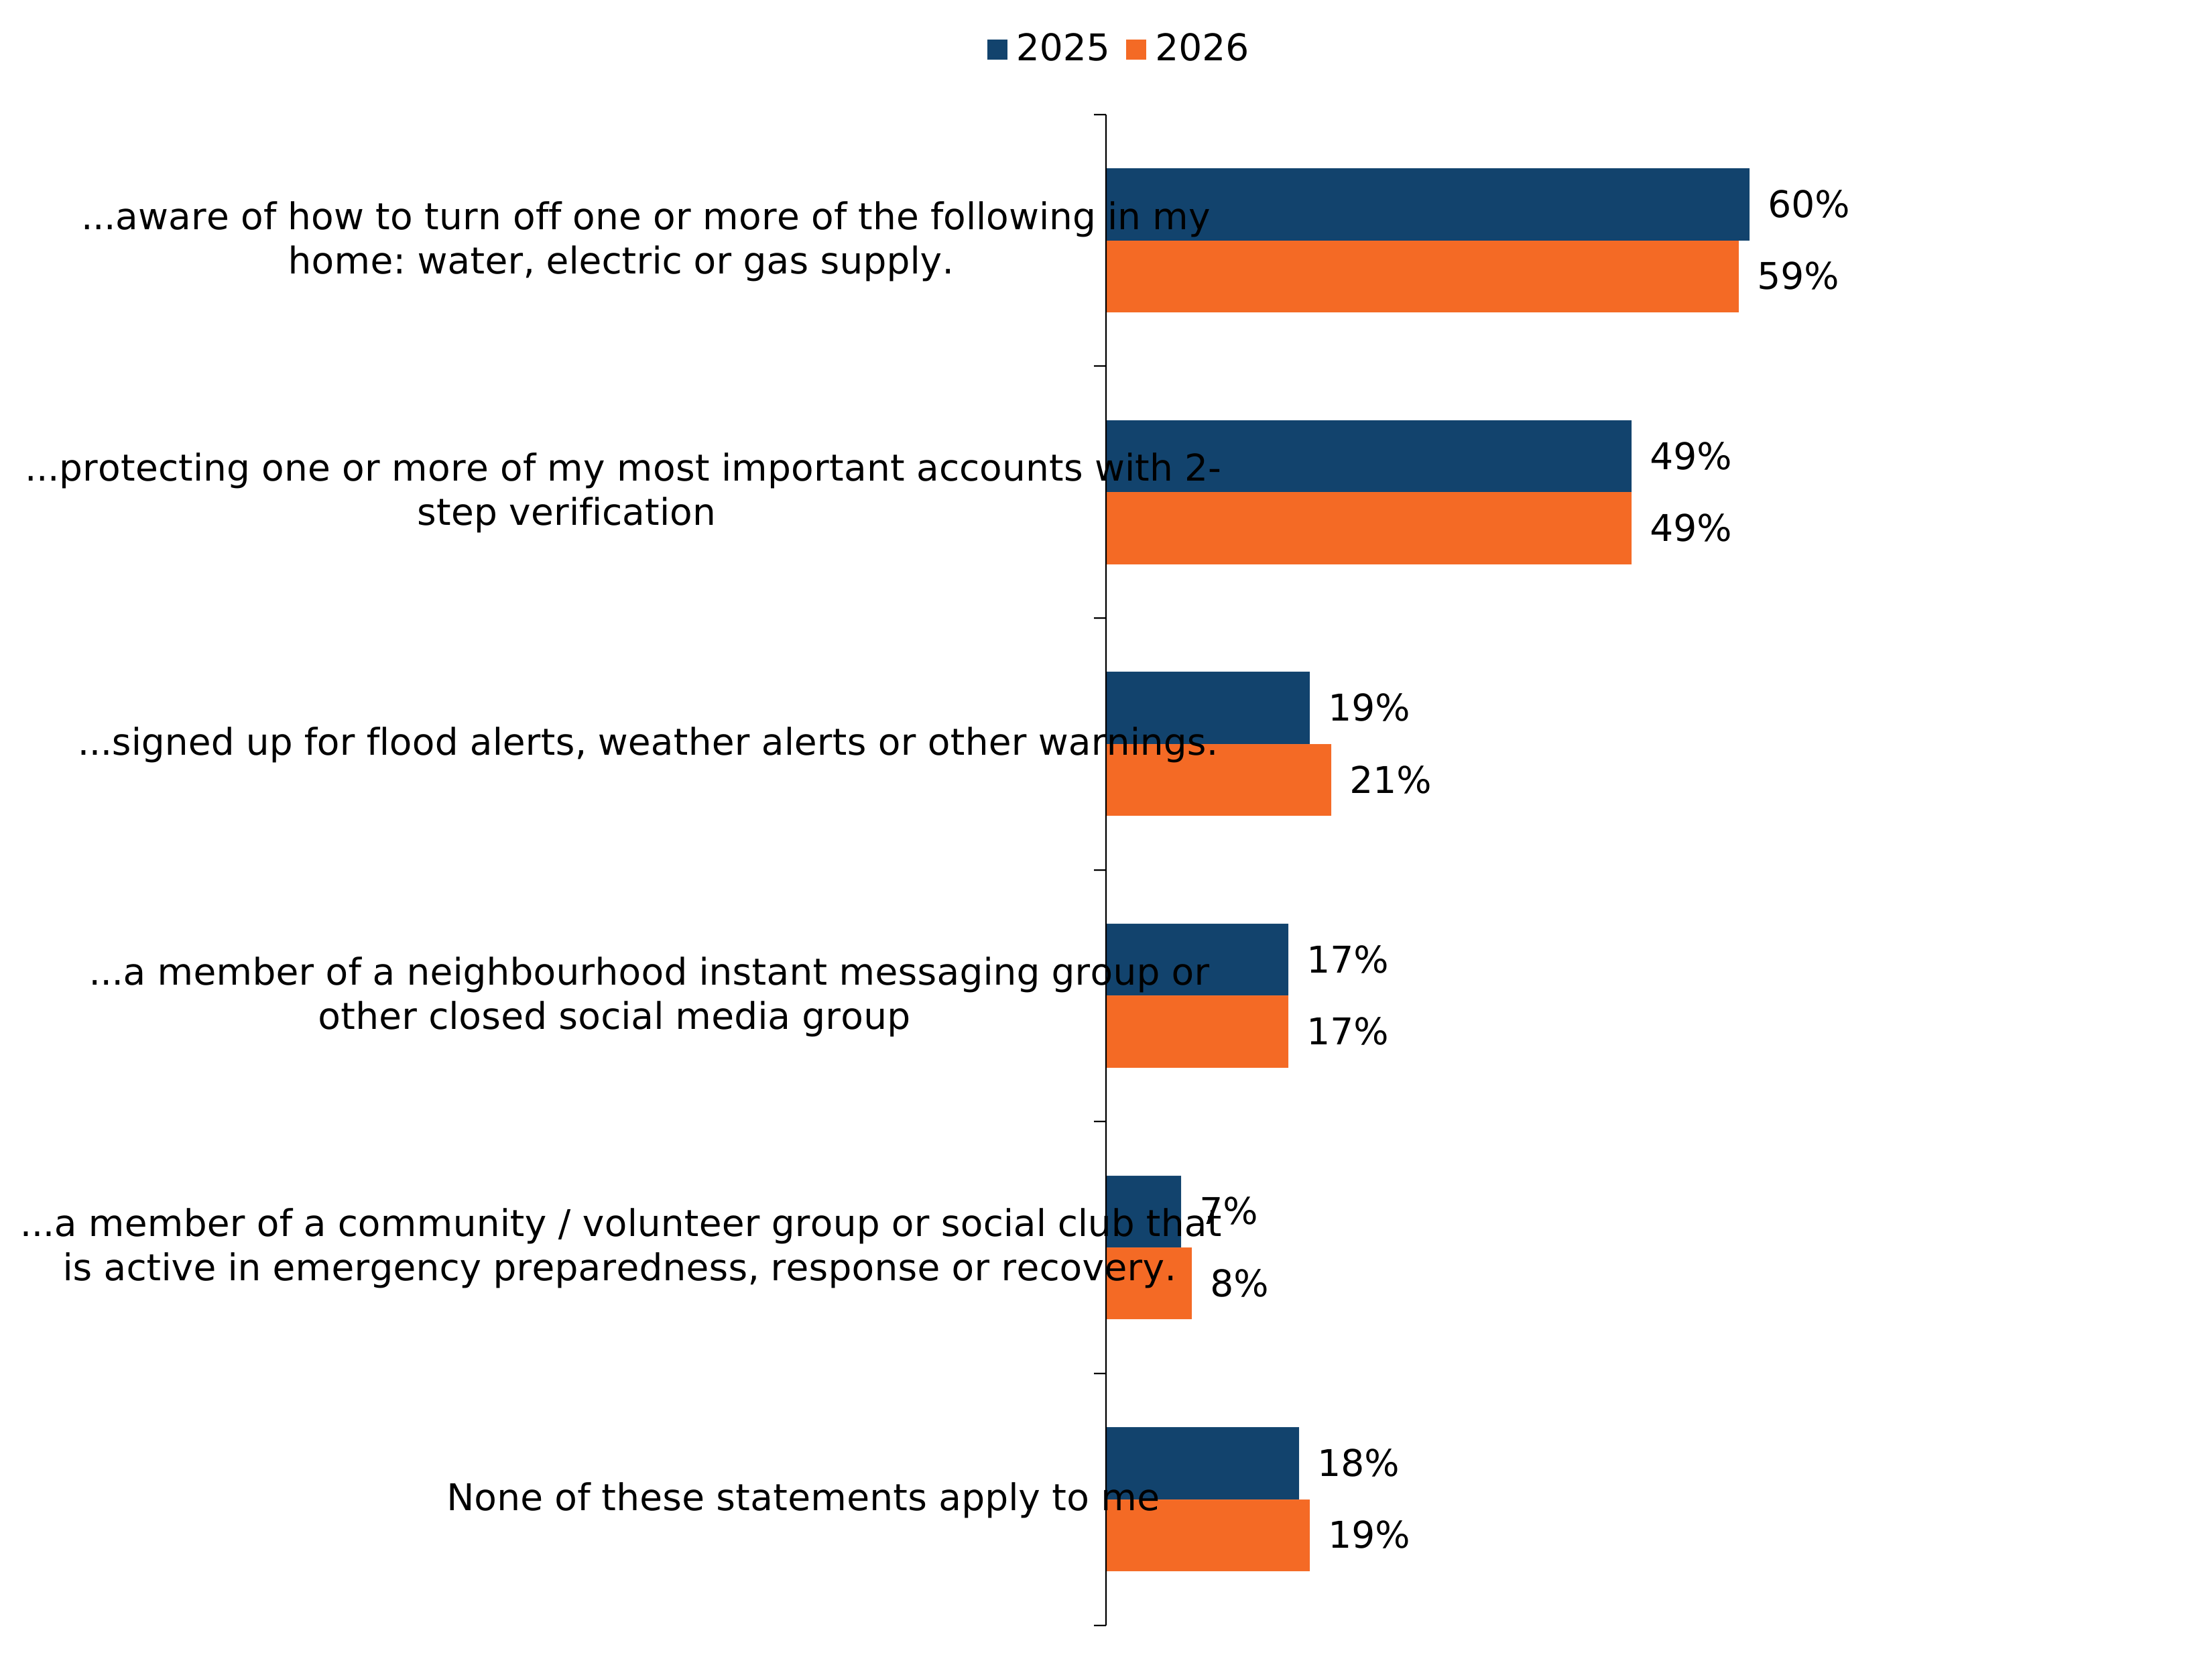
Figure note:
Source: Q24a. Please select as many of the following statements that apply to you. I am currently…
Base: All respondents in UK sample, 2025 (n=10,536); 2026 (n=10,791).
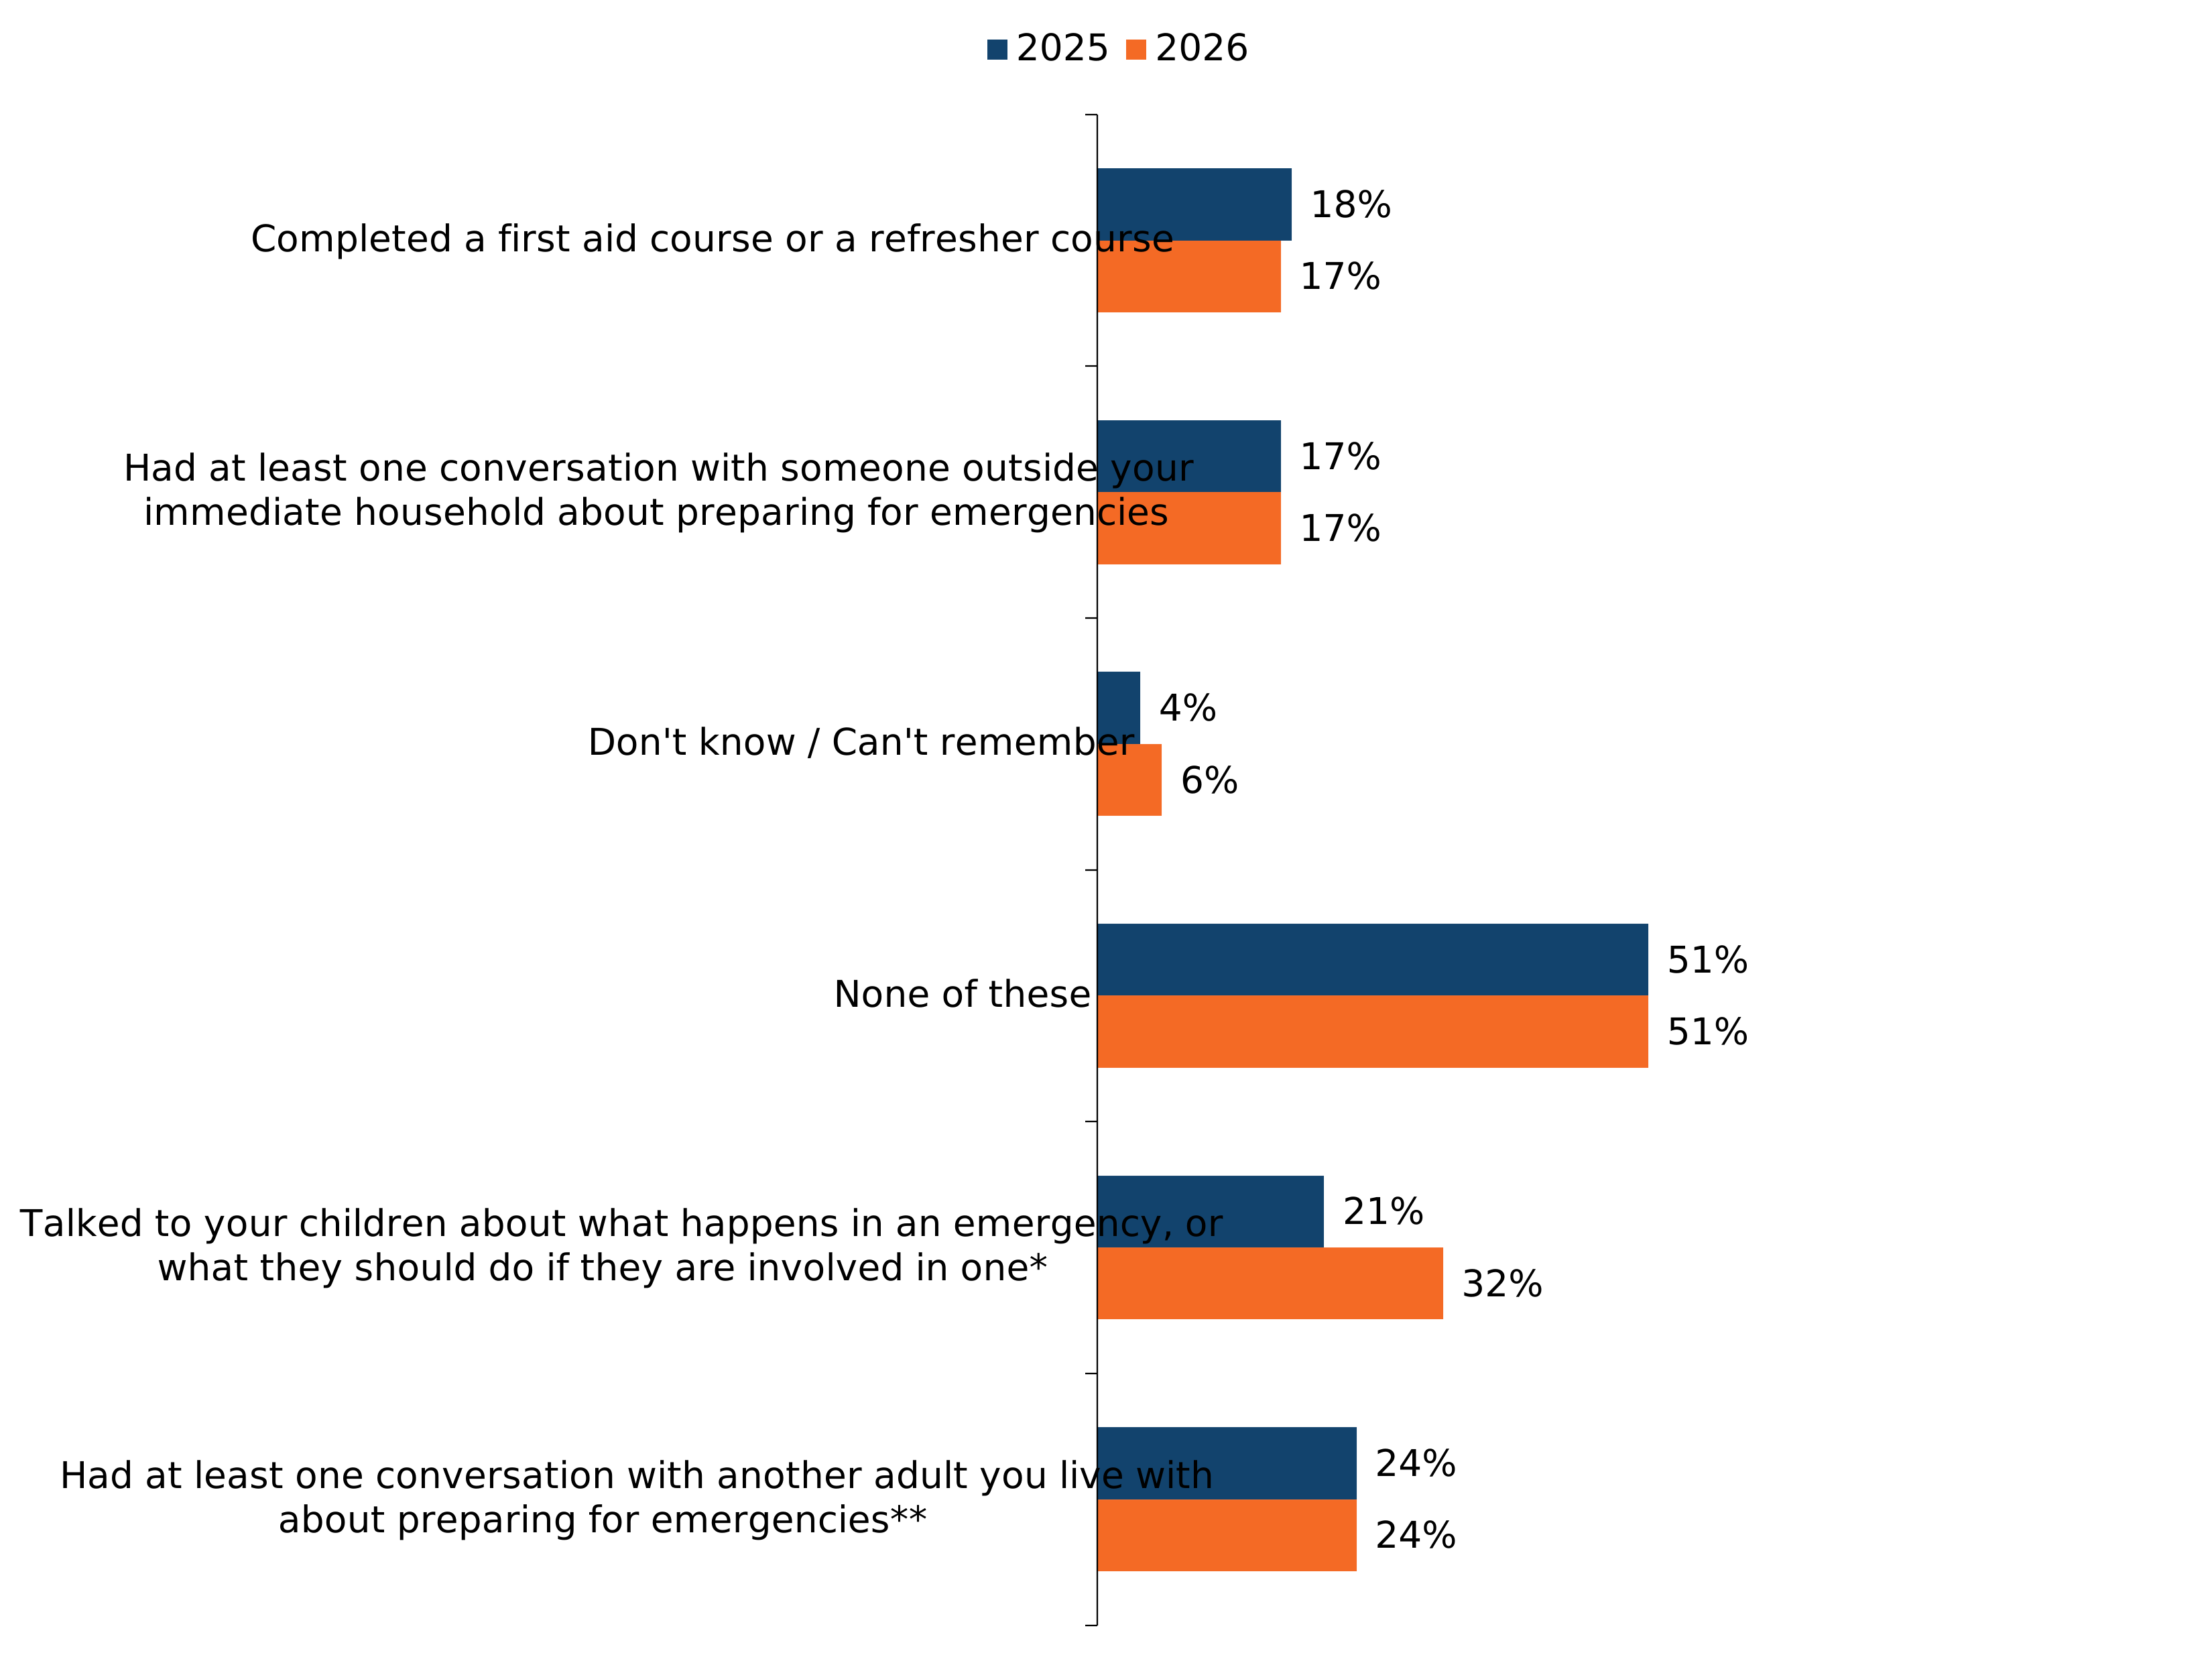
17% of survey respondents said they had completed a first aid course in the last 12 months and the same proportion reported having had at least one conversation with an adult living outside their household about preparing for an emergency. Out of the respondents who lived with children, 32% reported that they had spoken to their children in the last 12 months about what happens in an emergency or what they should do if they were involved in one.
Note: Since 2025 there was a rise in the proportion of respondents reporting that they had talked with their children about what happens in an emergency, from 21% to 32%. There was a change in the definition of who was shown this option in 2026. In 2025 parents without children, and parents of children aged 18 or over were not shown this option. However, this definition excluded parents who had children aged 18 or over and who also had children aged 17 or below. In the 2026 survey, the definition of who could see the question was changed, so that only parents where all their children were aged 18 and over were excluded. However, this definitional change does not appear to have had much impact. Filtering the question so that all parents with children aged 18 and above are excluded, as in 2025, changes the result from 31% to 32%.
Figure 4.3: 2025 to 2026 comparison of preparedness activities carried out by respondents in the last 12 months. (showing % of respondents) (see UK WoW table 74 (ODS, 1.47MB))
*Option only shown to respondents with children aged 17 or below living in their household (see figure note below)
**Option only shown to respondents who live with at least one other person (see figure note below)
Options with different base sizes are presented at the bottom of the chart as they cannot be directly compared with options seen by the full sample.
Figure note:
Source: Q24b. Have you done any of the following, in the last 12 months?
Some response options were only shown to certain respondents if they were applicable to their circumstances. This chart uses the following bases:
- All respondents in UK sample, 2025 (n=10,536); 2026, (n=10,791).
- Those with children aged 17 or below living in their household, 2025 (n=3,343); 2026 (n=3,244).
- Those who have at least one other person living with them in their household 2025 (n=8,178); 2026 (n=8478).
When asked about specific emergency-related items they might have at home, 78% of respondents reported having a smoke detector at home, 60% reported having some cash (£10 or more per person), the same proportion said they had spare batteries for a radio or torch (60%) and 58% said they had a carbon monoxide detector.
54% of respondents reported having a power bank to charge a mobile phone, while 53% said they had a torch powered by battery, solar or wind up. 23% reported having a FM radio powered by battery, solar or wind up (not including a car or mobile phone radio).
Compared to 2025, the proportion of respondents who reported having each item at home was broadly stable across most categories. The proportion who reported having a smoke detector at home increased marginally (77% to 78%), whilst those who reported having a carbon monoxide detector fell one percentage point (59% to 58%). The proportion who reported having a water or rain butt outside was unchanged (25%). The proportion who reported having a battery, solar or wind-up torch at home fell two percentage points (55% to 53%).
Note: In 2025, this question included more response options than in 2026, as some items were moved to Q42 in 2026. This may have affected responses, since participants in 2025 may have been less likely to select ‘None of these’ when presented with a longer list. This metric should therefore not be interpreted as a change over time, and the 2025 figure for ‘None of these’ is not shown.
Figure 4.4: 2025 to 2026 comparison of emergency/disaster-related items respondents have at home (showing % of respondents) (see UK WoW table 75 (ODS, 1.47MB))
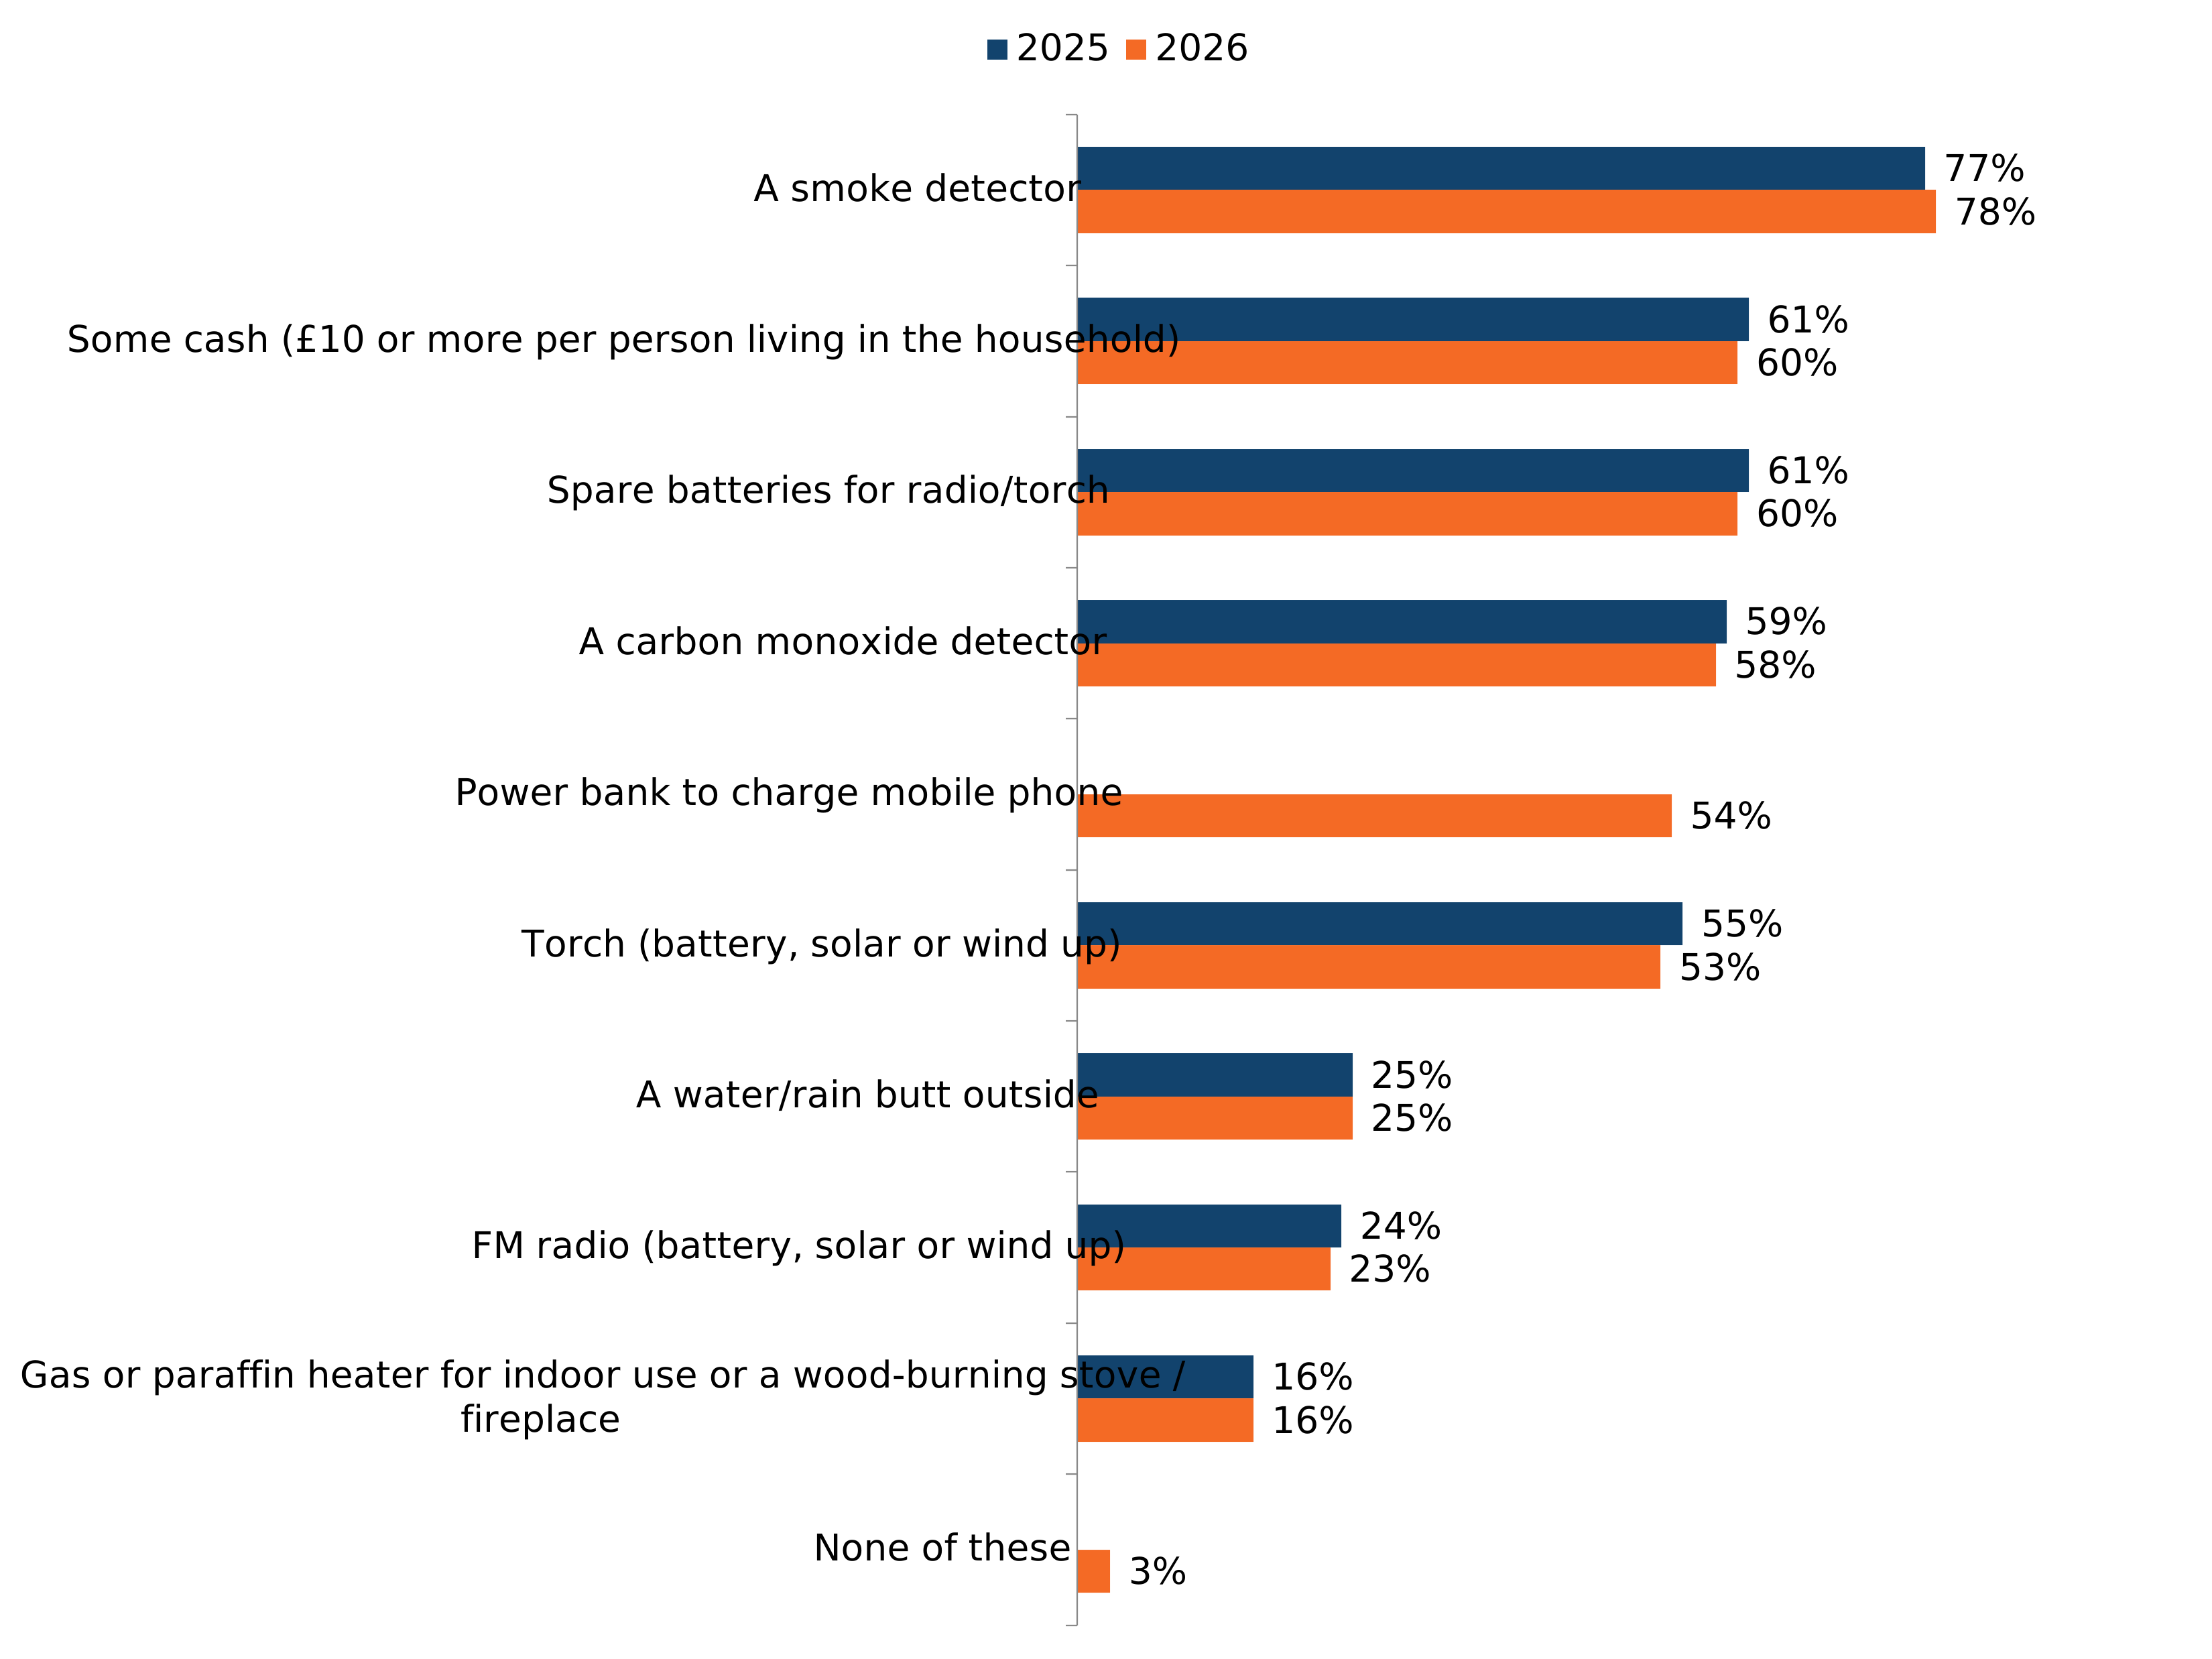
Figure note:
Source: Q25. Which of the following items (if any) do you have at home?
Base: All respondents in UK sample, 2025 (n=10,536); 2026 (n=10,791).
The statement “Power bank to charge a mobile phone” was not assessed in 2025.
“A first aid kit (or a selection of first aid items stored separately)” and “Supplies of any essential medicine that will last you at least 7 days” were included at Q25 in 2025 but were asked as part of Q42 in 2026. These items are therefore not included in the wave-on-wave comparison shown in this figure.
Of those who have a smoke detector in their home, 65% reported having tested it in the last month to make sure it worked, whereas 32% indicated that they had not tested it in the last month and 3% said they could not remember if they had.
Compared to 2025, the proportion of respondents who reported having tested their smoke detector in the last month remained broadly similar, with the proportion of those who reported having done so unchanged (65%) and those who reported not having done so down one percentage point (33% to 32%).
Data note:
Source: Q25b. Have you tested any of the smoke detectors in your home to see if they are working, in the last month?
Base: Those who reported having a smoke detector in their home, 2025 (n=8,276); 2026 (n=8,587).
The majority of survey respondents (60%) stated that they had non-perishable food (that did not require cooking) that would last their household approximately three days. 40% said they had enough non-refrigerated drinks (excluding water and alcohol) to last them three days, while 37% said they had enough bottled water to last three days.
Note: The results shown here for bottled water and non-perishable food differ from those reported at Q27 (Figure 4.7) and Q43 (Figure 4.10) later in the report. This is because these questions asked respondents specifically how many litres of bottled water and how many days’ worth of non-perishable food they had. It should be noted however that Q43 on non-perishable food did not include ‘doesn’t require cooking’ in the description, which provides an explanation for the higher percentage of respondents indicating they had 3 days’ worth or more (85%); respondents could have been including food such as dried pasta or rice which would could only be prepared by people with additional cooking equipment. The more specific question on bottled water (Q27, Figure 4.7) allowed respondents to think more carefully about their supplies and how many litres they had. Therefore, the results at Q27 (Figure 4.7) should be referred to when assessing household preparedness for bottled water. For non-perishable food either Q26 (Figure 4.5) or Q43 (Figure 4.10) can be used, but results for Q43 should include the caveat that ‘doesn’t require cooking’ was not part of the question.
Since 2025 the proportion of survey respondents who said they had three days’ worth of non-perishable food (that did not need cooking) decreased by six percentage points (from 66% to 60%). The proportion of respondents saying they have a camping stove was unchanged (19%), while the proportion saying they had fruit / vegetables that they grow themselves declined by two percentage points (19% to 17%).
Note: The 2025 figure for baby formula to last 3 days has not been included as changes to the child age-group question affected which parents were asked this question, meaning the 2025 and 2026 results are not directly comparable.
In 2025 the list of emergency supplies included in this question included more options than it did in 2026, for example, hand sanitiser and wet wipes. This may have had an influence on responses, as participants could be less likely to select ‘None of the above’ in 2025 compared to 2026 due to an increased number of response options. As a result, this metric should not be interpreted as a change over time, and subsequently, the 2025 proportion for ‘None of the above’ is not shown.
Figure 4.5: 2025 to 2026 comparison of emergency supplies respondents have at home (showing % of respondents) (see UK WoW table 77 (ODS, 1.47MB))
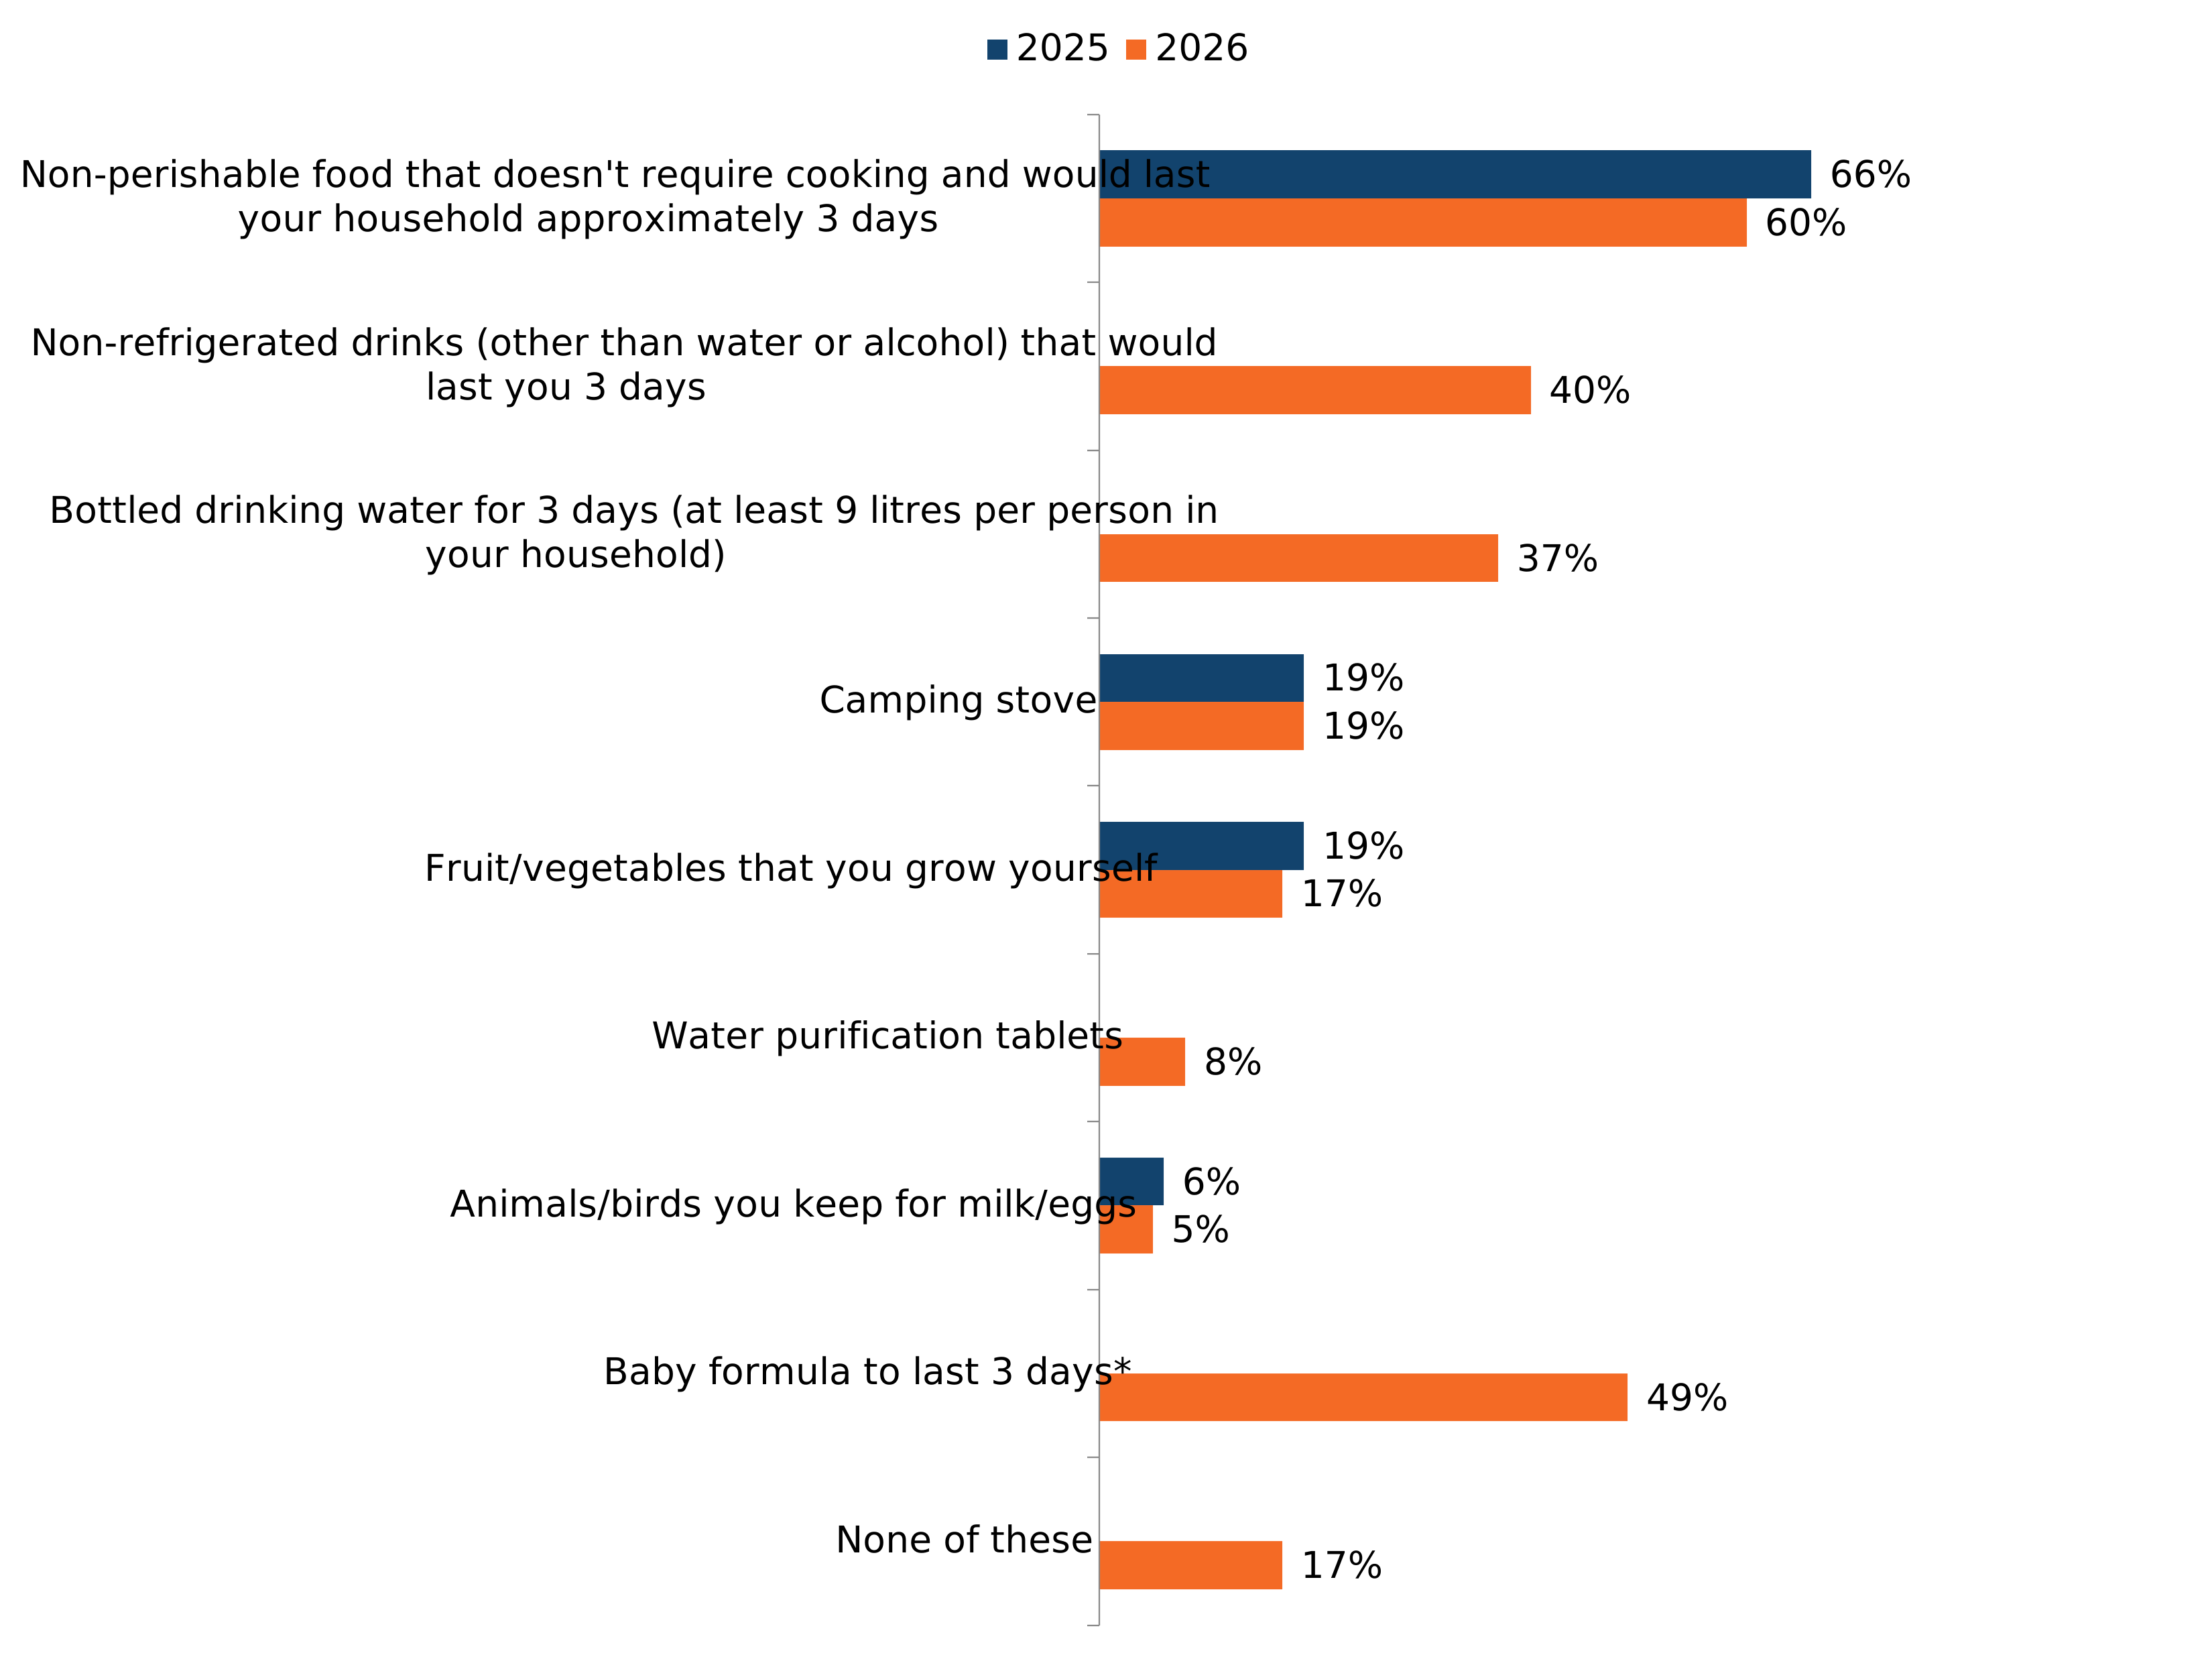
Figure note:
Source: Q26. Which of the following items, if any, do you have at home?
The following statements were not assessed in 2025: Non-refrigerated drinks (other than water or alcohol) that would last you 3 days, Bottled drinking water for 3 days (at least 9 litres per person in your household).
Some response options were only shown to certain respondents if they were applicable to their circumstances. This chart uses the following bases:
- All respondents in UK sample, 2025 (n=10,536); 2026, (n=10,791).
- Those with children aged 0-1, 2026 (n=300).
The majority (71%) of survey respondents reported having hand sanitiser at home. 68% said they had wet wipes at home, and 63% first aid supplies kit.
There was an increase in the proportion of respondents who have hand sanitiser (from 67% to 71%) and first aid supplies (from 57% to 63%).
76% of respondents who take medicine essential for managing ongoing health conditions said they had enough medicine to last them at least seven days.
Note: The proportion of respondents in 2025 who identified in answering Q25 that they had enough essential medicine to last seven days was excluded. This is because in the 2025 survey this option was shown to all respondents. The 2026 survey however includes a new question that asks respondents whether they are currently taking any essential medication, and so in 2026 this option was shown only to those respondents that indicated they needed this medication. As a result of this change in base size, change in this metric should not be interpreted as a change over time, and so the 2025 proportion that selected ‘supplies of essential medicine’ is not shown.
Figure 4.6: 2025 to 2026 comparison of health items respondents have at home (showing % of respondents) (see UK WoW tables 75, 76, 78 (ODS, 1.47MB))
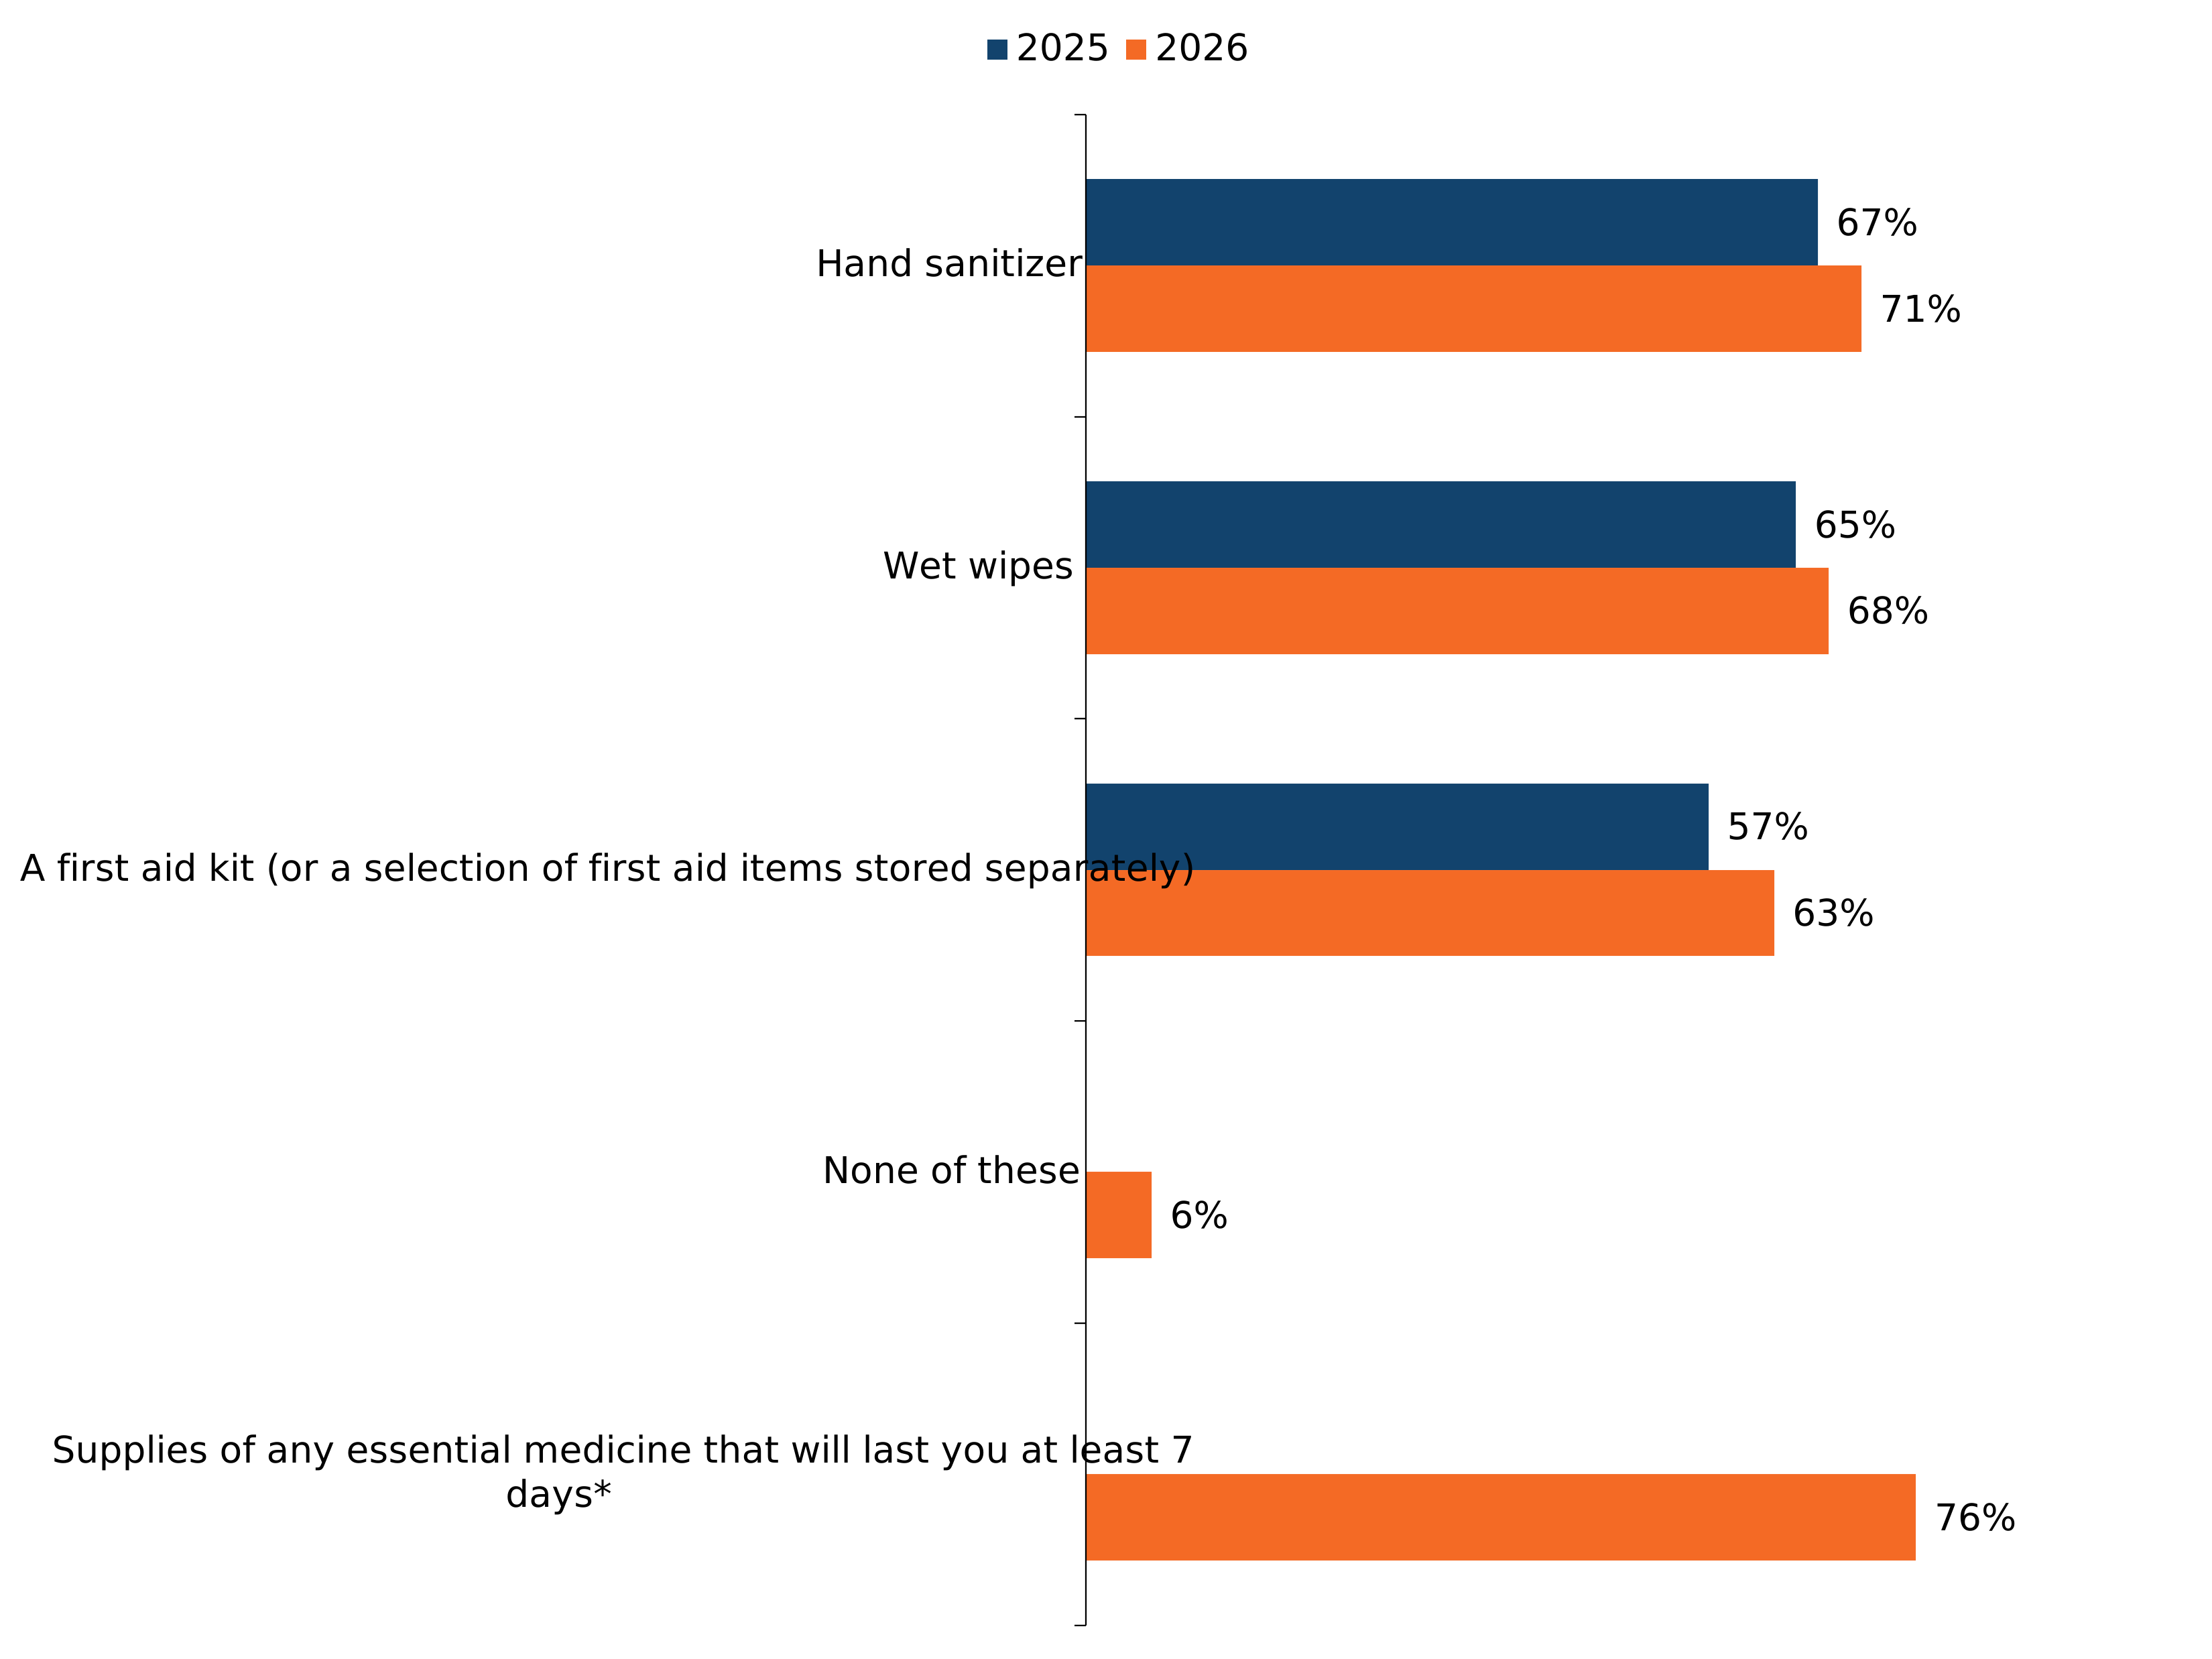
Figure note:
Source: Q42. Which of the following health items, if any, do you have at home? (2026 figures only).
Source: Q25. Which of the following items (if any) do you have at home? (2025 only, first aid kit).
Source: Q26. Which of the following items, if any, do you have at home? (2025 only, hand sanitiser and wet wipes).
Base: All respondents in UK sample, 2025 (n=10,536); 2026 (n=10,791).
35% of survey respondents reported having less than 1 litre of bottled drinking water in their home. 29% reported having between 1-2 litres, and 37% had 3 litres or more. 10% reported having between 6 and 10 litres.
Note: Results for 2026 are not directly comparable with 2025 as the question wording and response format were changed in 2026. As a result, a comparison between 2025 and 2026 has not been presented.
Figure 4.7: Amount of bottled drinking water respondents report having in their home (showing % of responses that fall within each of the following litre ranges) (see UK 2026 table 79 (ODS, 1.15MB))
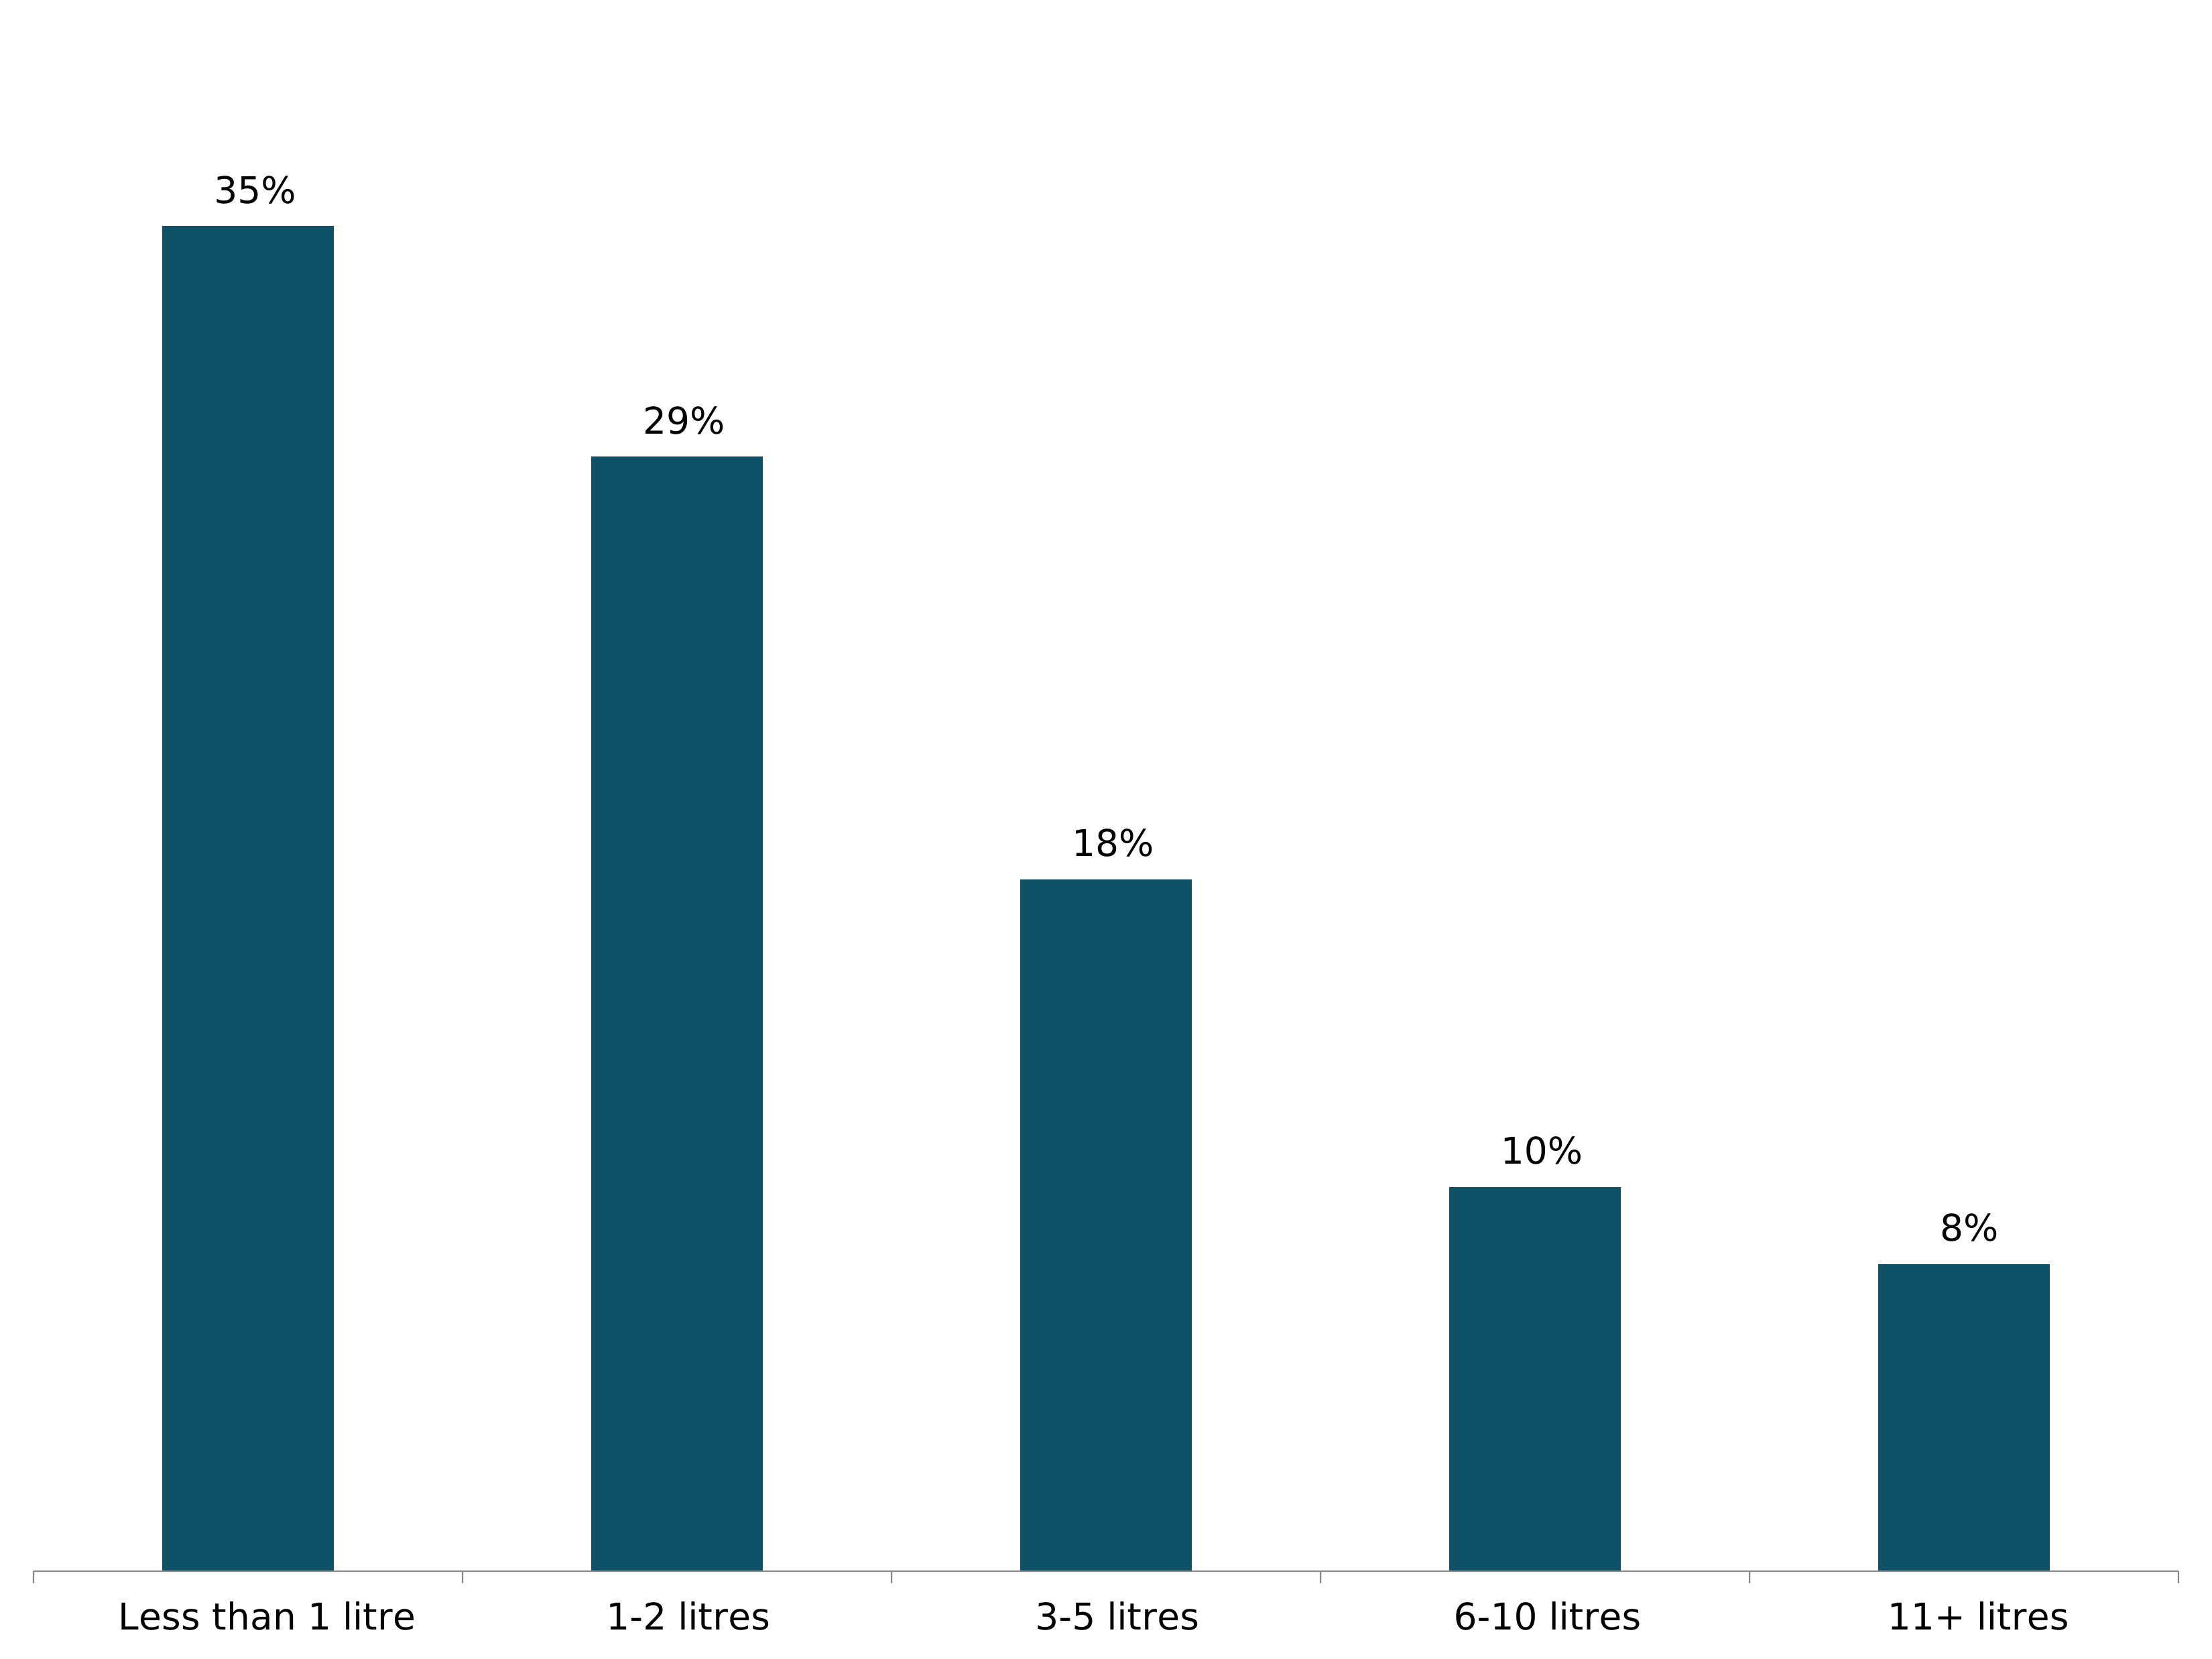
Figure note:
Source: Q27_2026. How many litres of bottled drinking water, if any, do you have at home? / Q27c. You have entered a large number of litres. Please restate your answer below. If you wish to change it, please enter the revised number of litres below.
Respondents were asked Q27c if they reported having more than 21 litres of water p/person in their household at Q27_2026. The data in the chart above uses the response at Q27c if the respondent had 21 litres p/person in their household. If the respondent reported having less than 21 litres p/person, their response to Q27_2026 was used.
The numerical ranges used are compound figures showing the percentage of respondents who stated they have a number of litres of bottled within the given range.
Decimal values were rounded down to the nearest whole litre for categorisation (i.e., 2.6 litres would fall within the 1-2 litres range)
Base: All respondents in UK sample (n=10,791).
Based on a recommended amount of 3 litres per person per day, 4% of respondents would have 3 or more days’ worth of bottled water for their household in an emergency. 10% would have enough for 1 day, and 82% would have less than 1 day.
Figure 4.8: Estimated number of days bottled drinking water would last in respondents’ households, based on 3 litres per person per day (showing % of respondents) (see UK 2026 table 81 (ODS, 1.15MB))
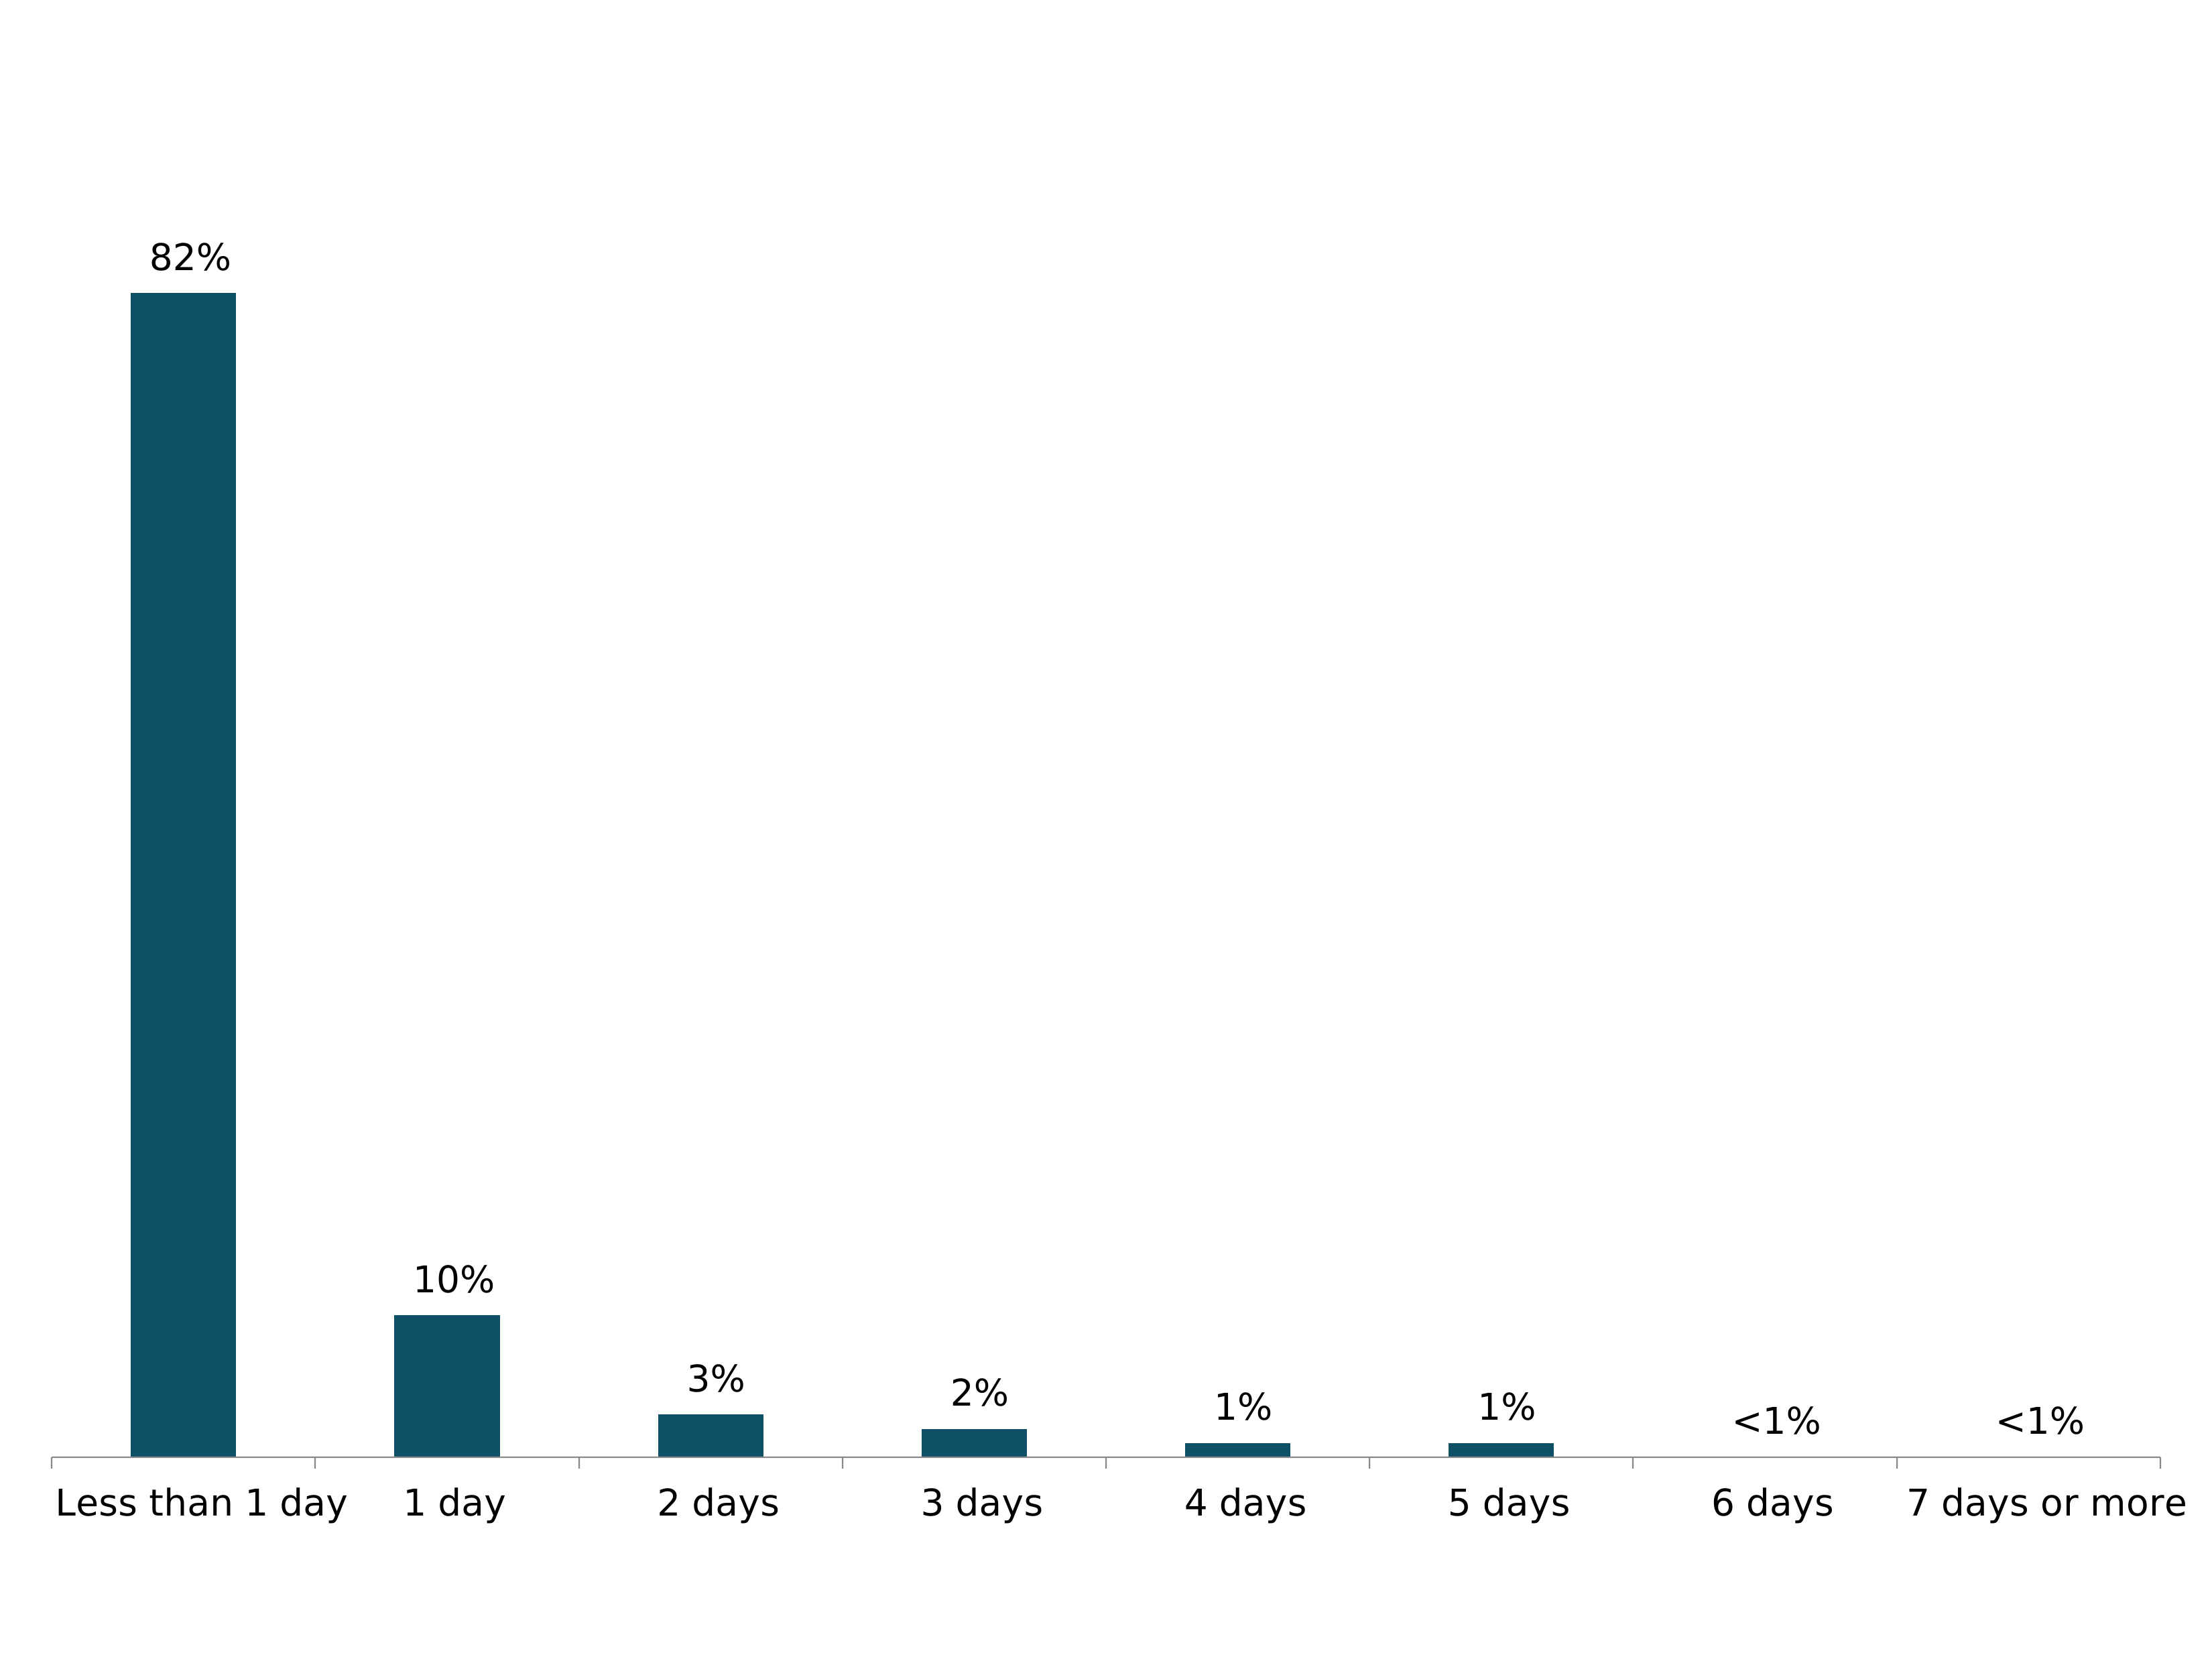
Figure note:
Source: Q27_WATER_SUPPLY
This figure is based on a derived measure showing the number of days respondents’ bottled water supplies would last their household in an emergency, calculated using the amount of bottled water reported, household size, and an allowance of 3 litres per person per day.
Of the small number of respondents who indicated they had a baby under the age of 12 months who needed formula (n=112), 57% reported having 7 days or more of baby formula at home. Just 2% reported having one day’s worth of baby formula. These results should be interpreted with caution due to the small sample size for this question.
Figure 4.9: Days’ worth of baby formula respondents with a baby aged less than 12 months, reported having in their home (showing % of responses) (see UK 2026 table 81 (ODS, 1.15MB))
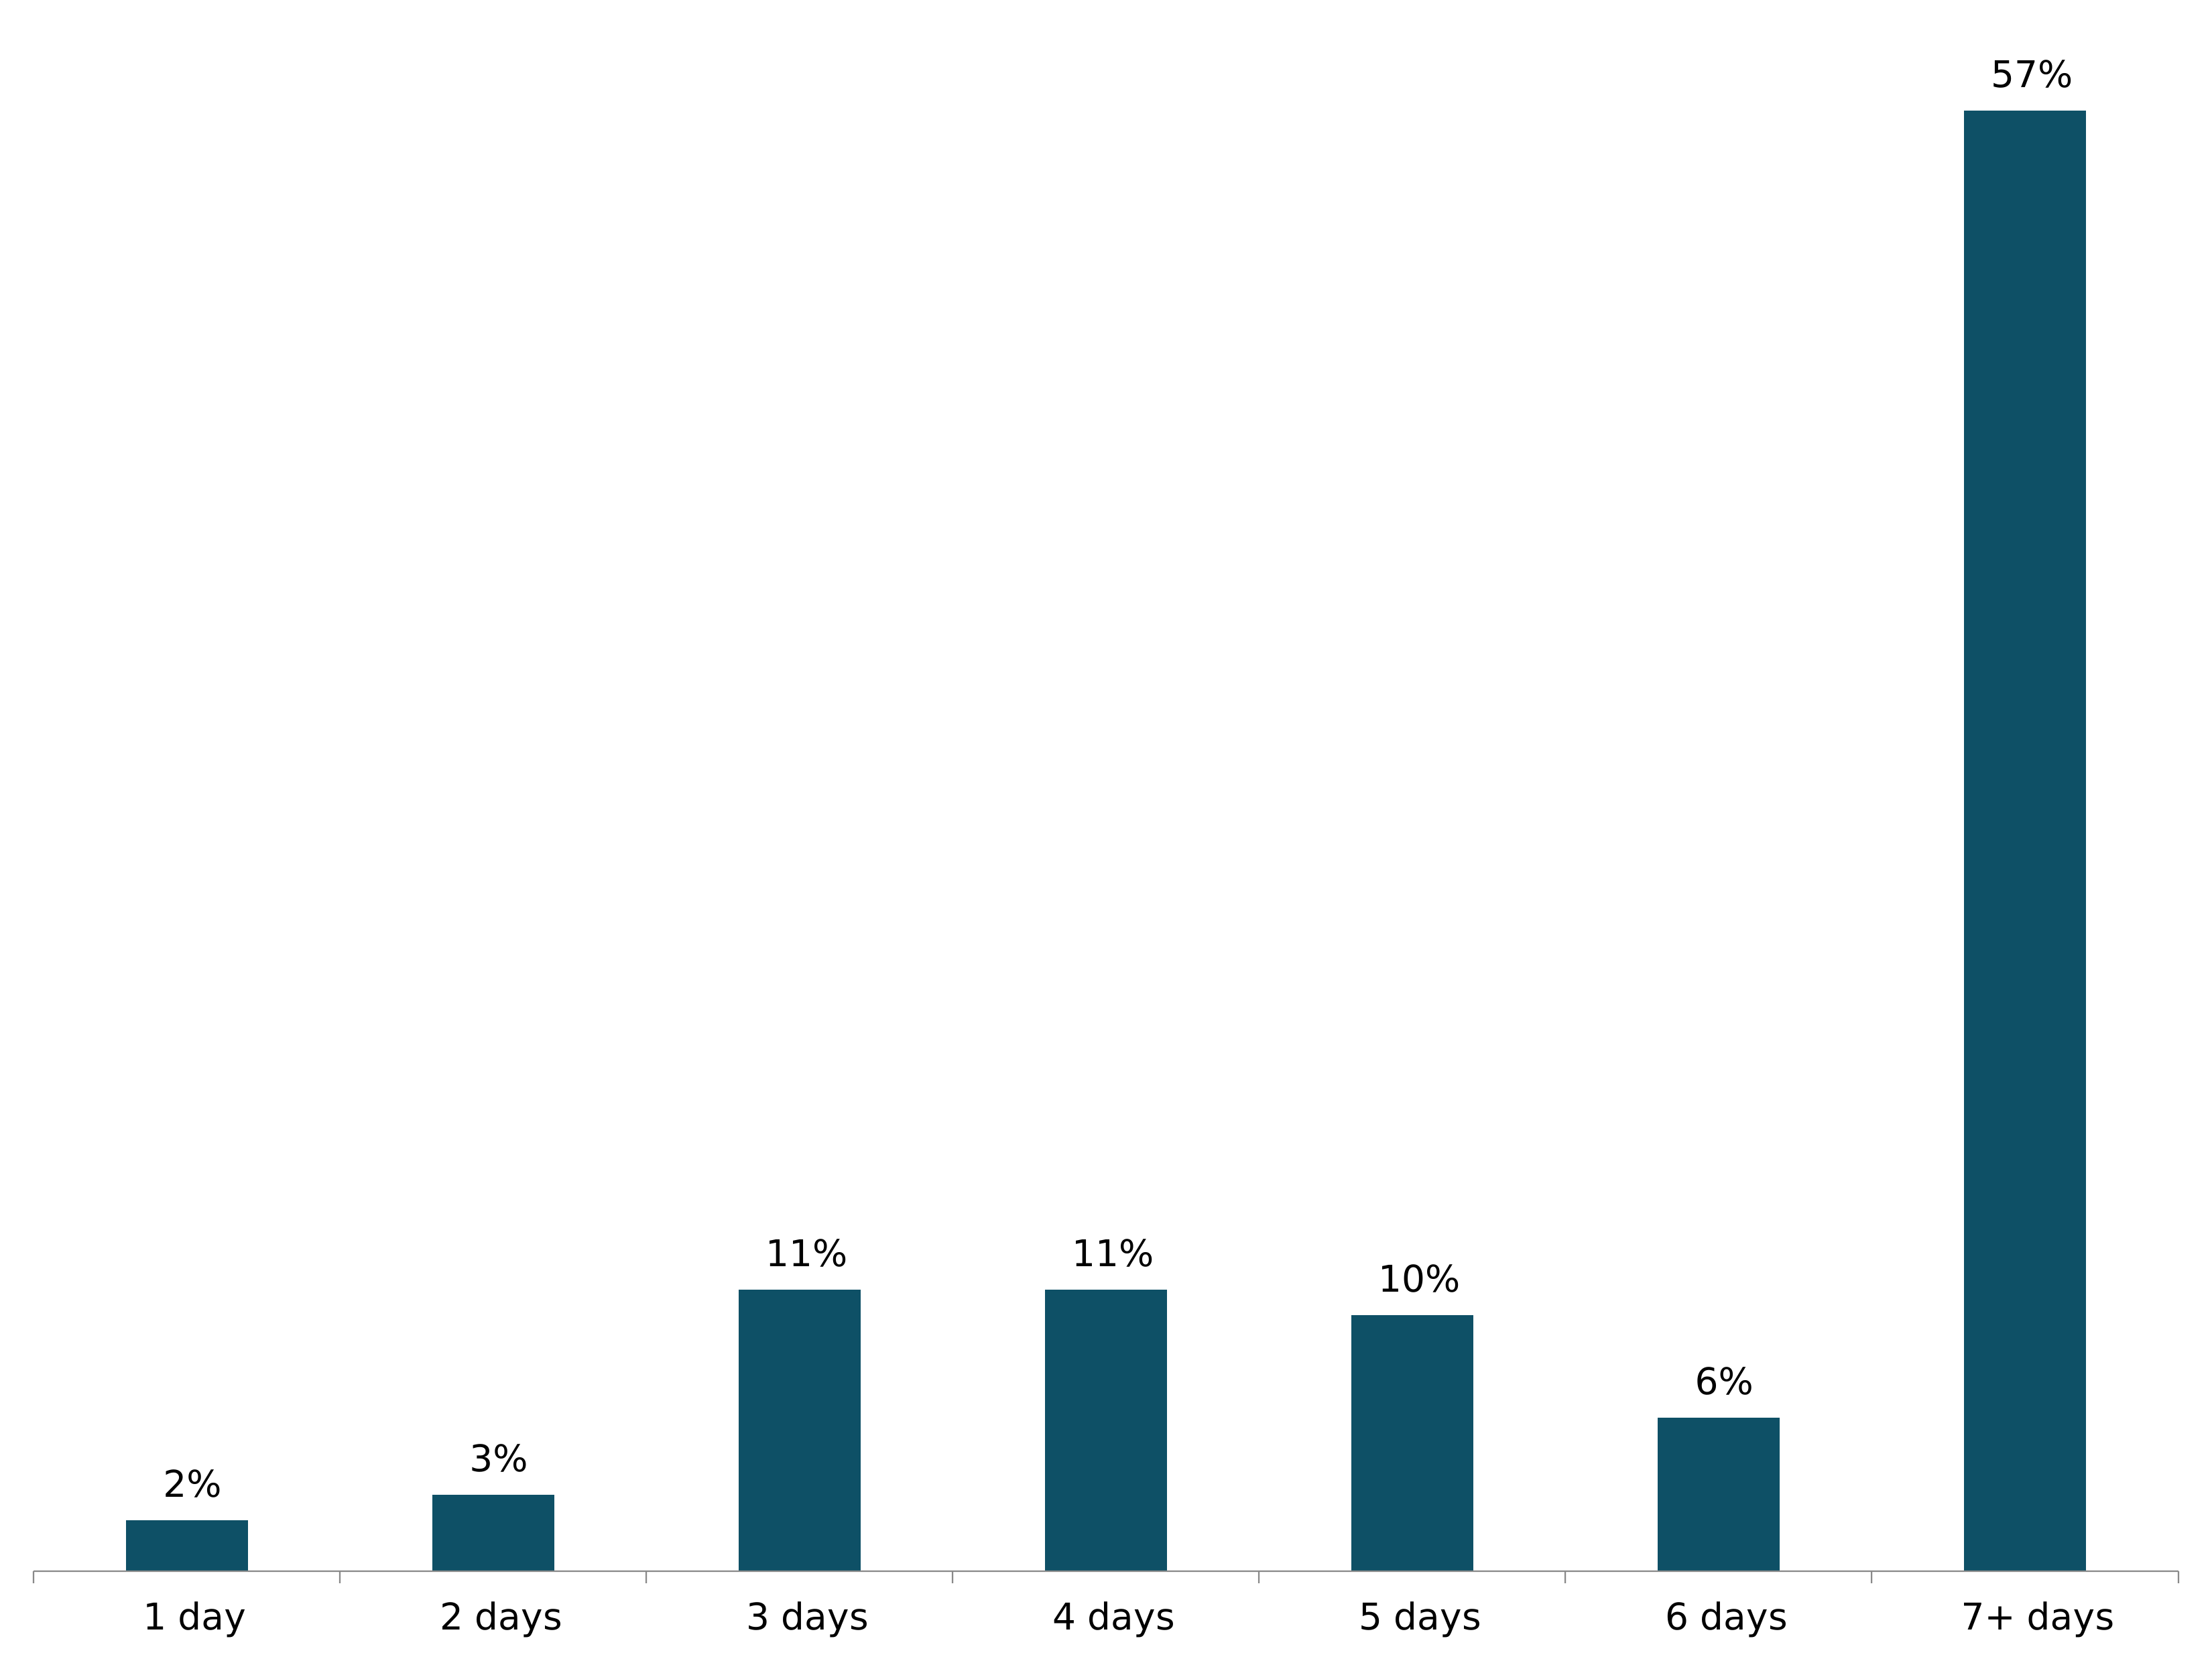
Figure note:
Source: Q29_2026. Approximately how many days’ worth of baby formula do you have at home?
Base: Those with a baby under the age of 12 months who need formula, 2026 (n=112).
25% of survey respondents reported having 7 or more days’ worth of non-perishable food at home. 85% reported having 3 or more days’ worth of non-perishable food. 7% reported having 1 days’ worth.
Figure 4.10: Days’ worth of non-perishable food respondents reported having in their home (showing % of responses) (see UK 2026 table 82 (ODS, 1.15MB))
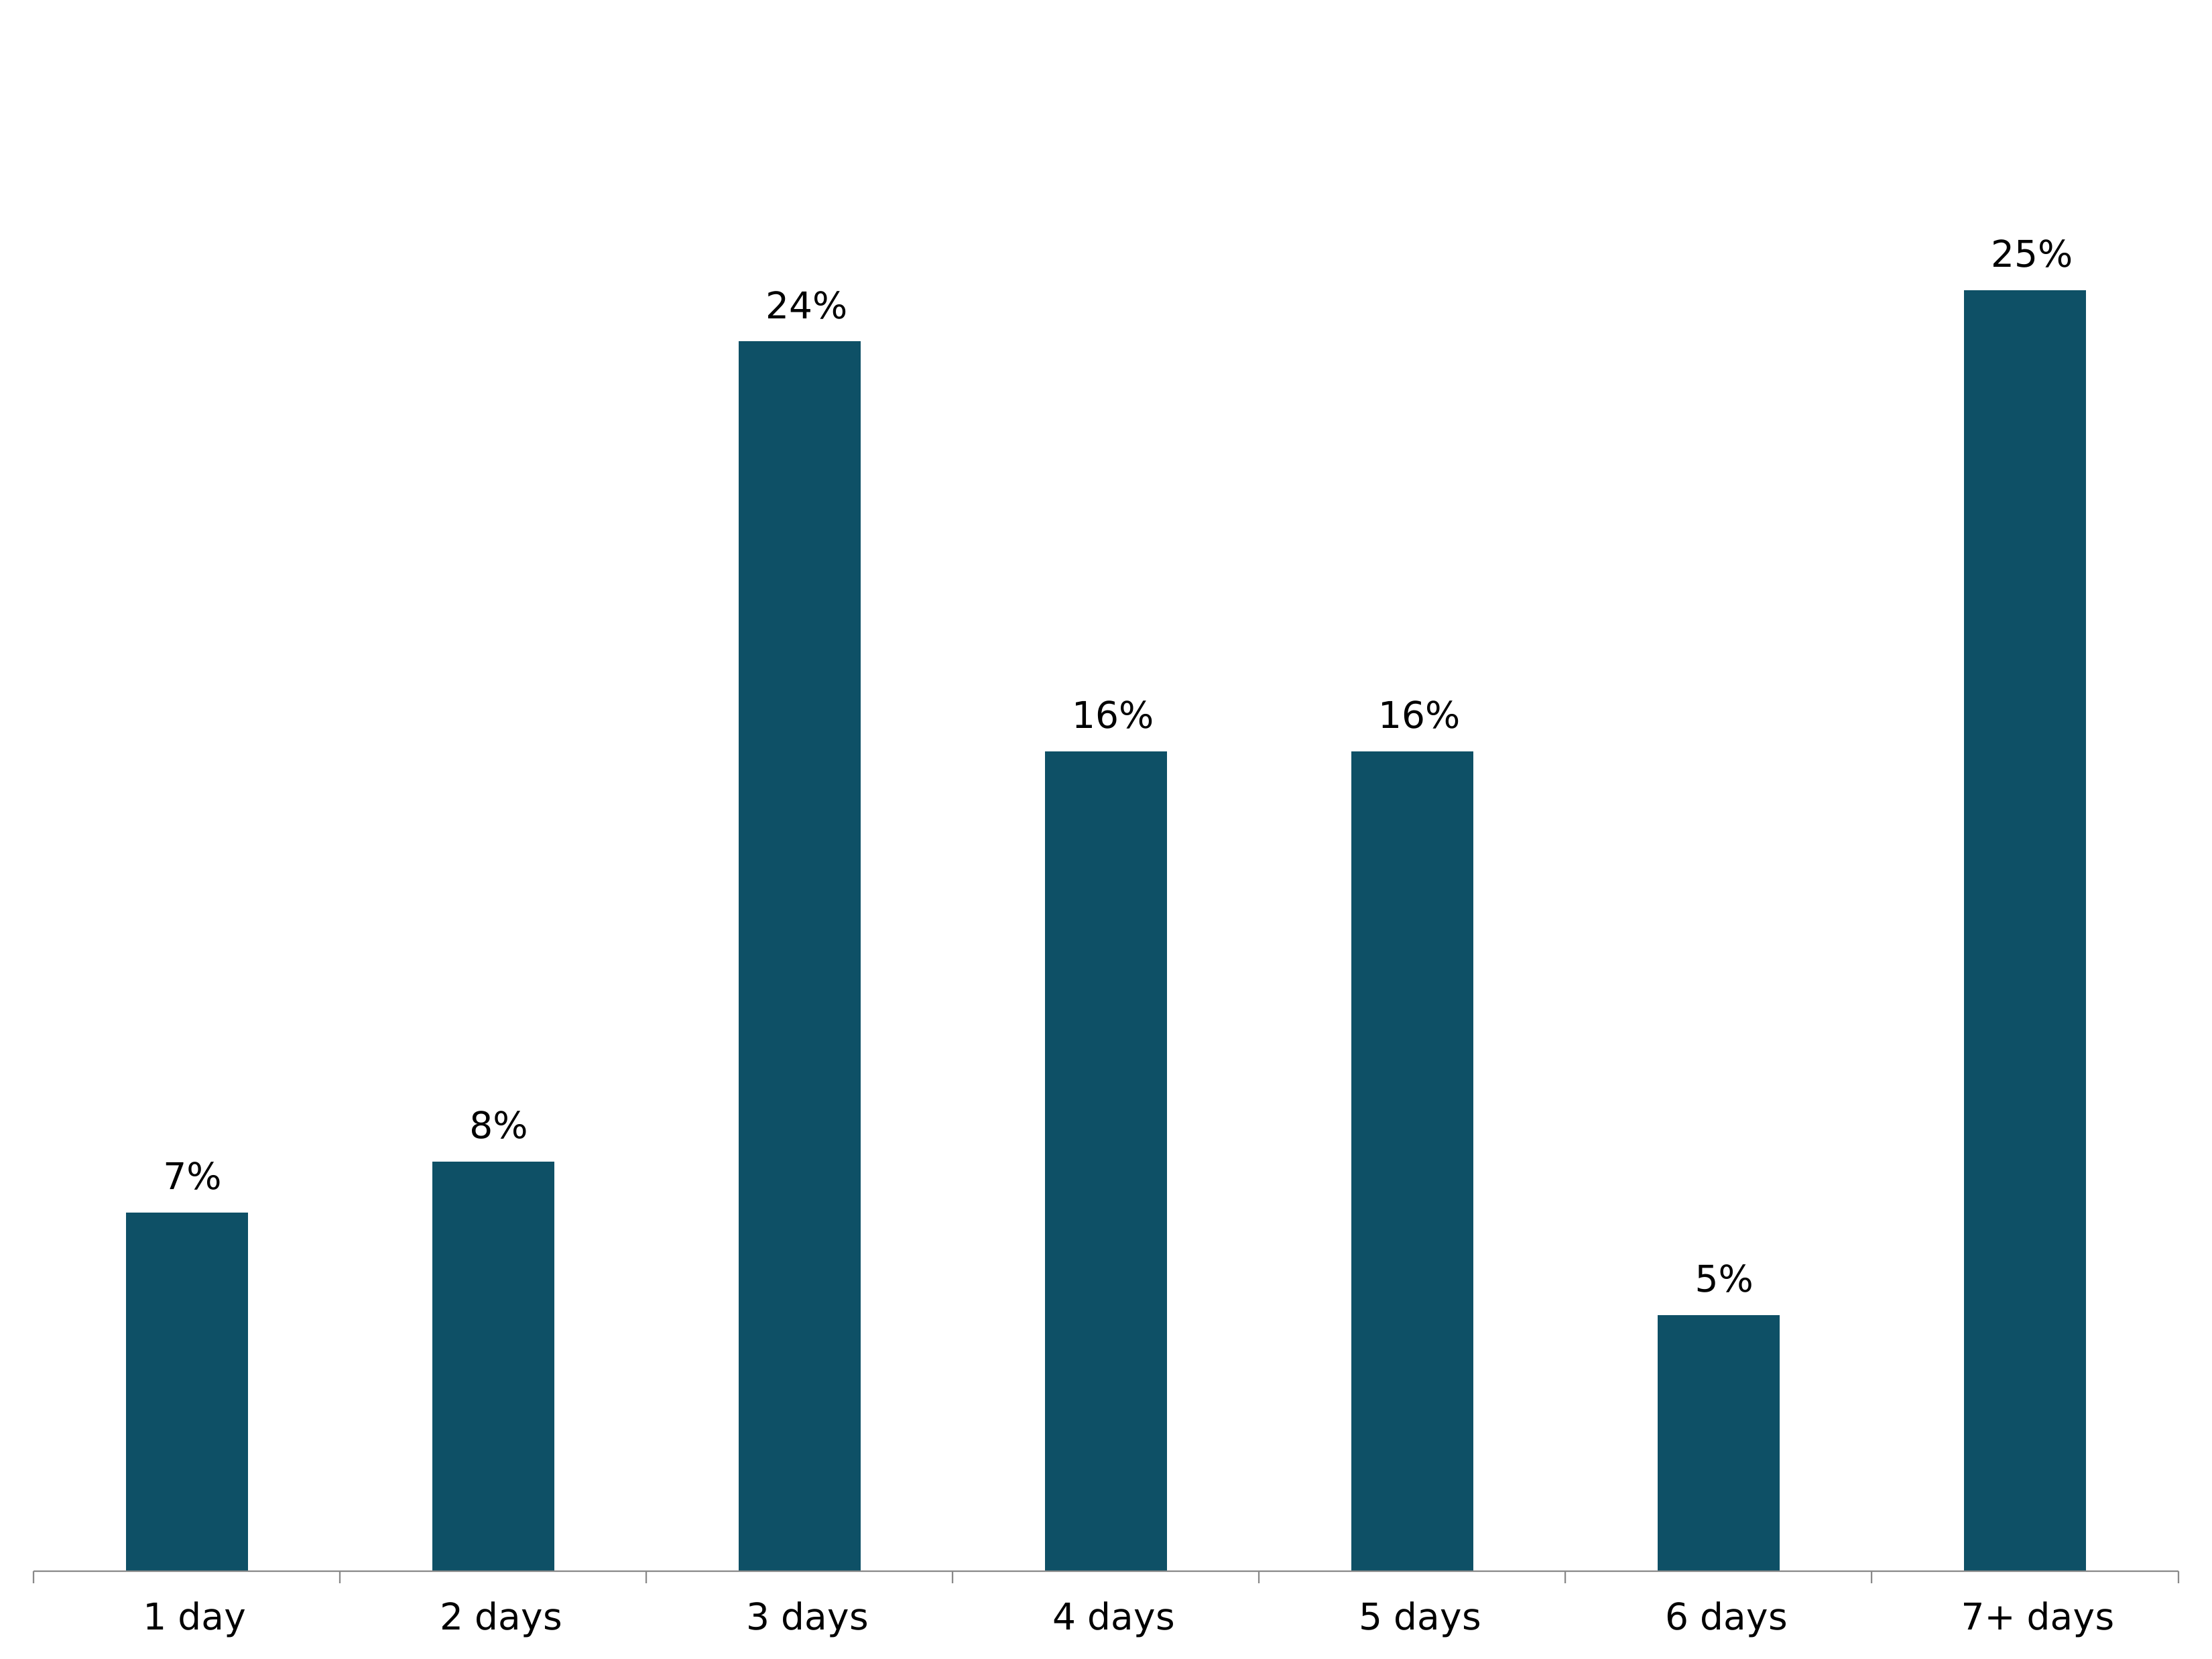
Figure note:
Source: Q43. Approximately how many days’ worth of non-perishable food (food that can be stored in a cupboard rather than a fridge) do you have at home?
Base: All respondents in UK sample, 2026 (n=10,791).
Due to rounding, the percentages for Q43 add up to 101%.
Barriers to preparedness
29% of survey respondents stated they had been prevented from taking further steps to prepare for emergencies by not having enough money, 25% said they were prevented because they did not want products to go out of date and have to be thrown away, and 23% said they were prevented because they did not know enough about what actions they could take to prepare for emergencies. 19% said they did not want to think about emergencies due to finding it stressful or worrying and 18% of respondents stated they did not have enough space to store supplies. 11% said they had not taken action because they did not have time.
Compared to 2025, the barriers cited by respondents were broadly stable. The most notable change was the three percentage point decrease in the proportion who reported not having space to store supplies (21% to 18%). There was also a two percentage point increase in the proportion saying they did not have enough money to spend extra on preparing for emergencies (27% to 29%). The proportion saying they did not know enough about what actions they could take to prepare for emergencies fell by two percentage points (from 25% to 23%).
For the 2026 survey an open response ‘other’ option was included to find out if any common barriers had been missed from the list. A total of 87 respondents provided a text response. The largest proportion of the responses have been grouped under a theme of ‘I haven’t thought about it’ (24%), followed by ‘I already have supplies / I’m already prepared’ (13%) and ‘I haven’t got round to it’ (7%). The remaining open responses where more than 5 respondents provided responses can be coded into the same theme were about thinking emergencies are unlikely, lack of knowledge and perceived external responsibility for preparing.
Note: In 2026 the response options included in this question differed from those used in 2025. This may have affected the proportion selecting ‘None of these’, as participants were presented with a different set of response options in each year. As a result, this metric should not be interpreted as a change over time, and the 2025 proportion for ‘None of these’ is not shown.
Figure 4.11: 2025 to 2026 comparison of barriers that prevent respondents from taking further steps to prepare for an emergency/disaster (showing % of respondents) (see UK WoW table 83 (ODS, 1.47MB))
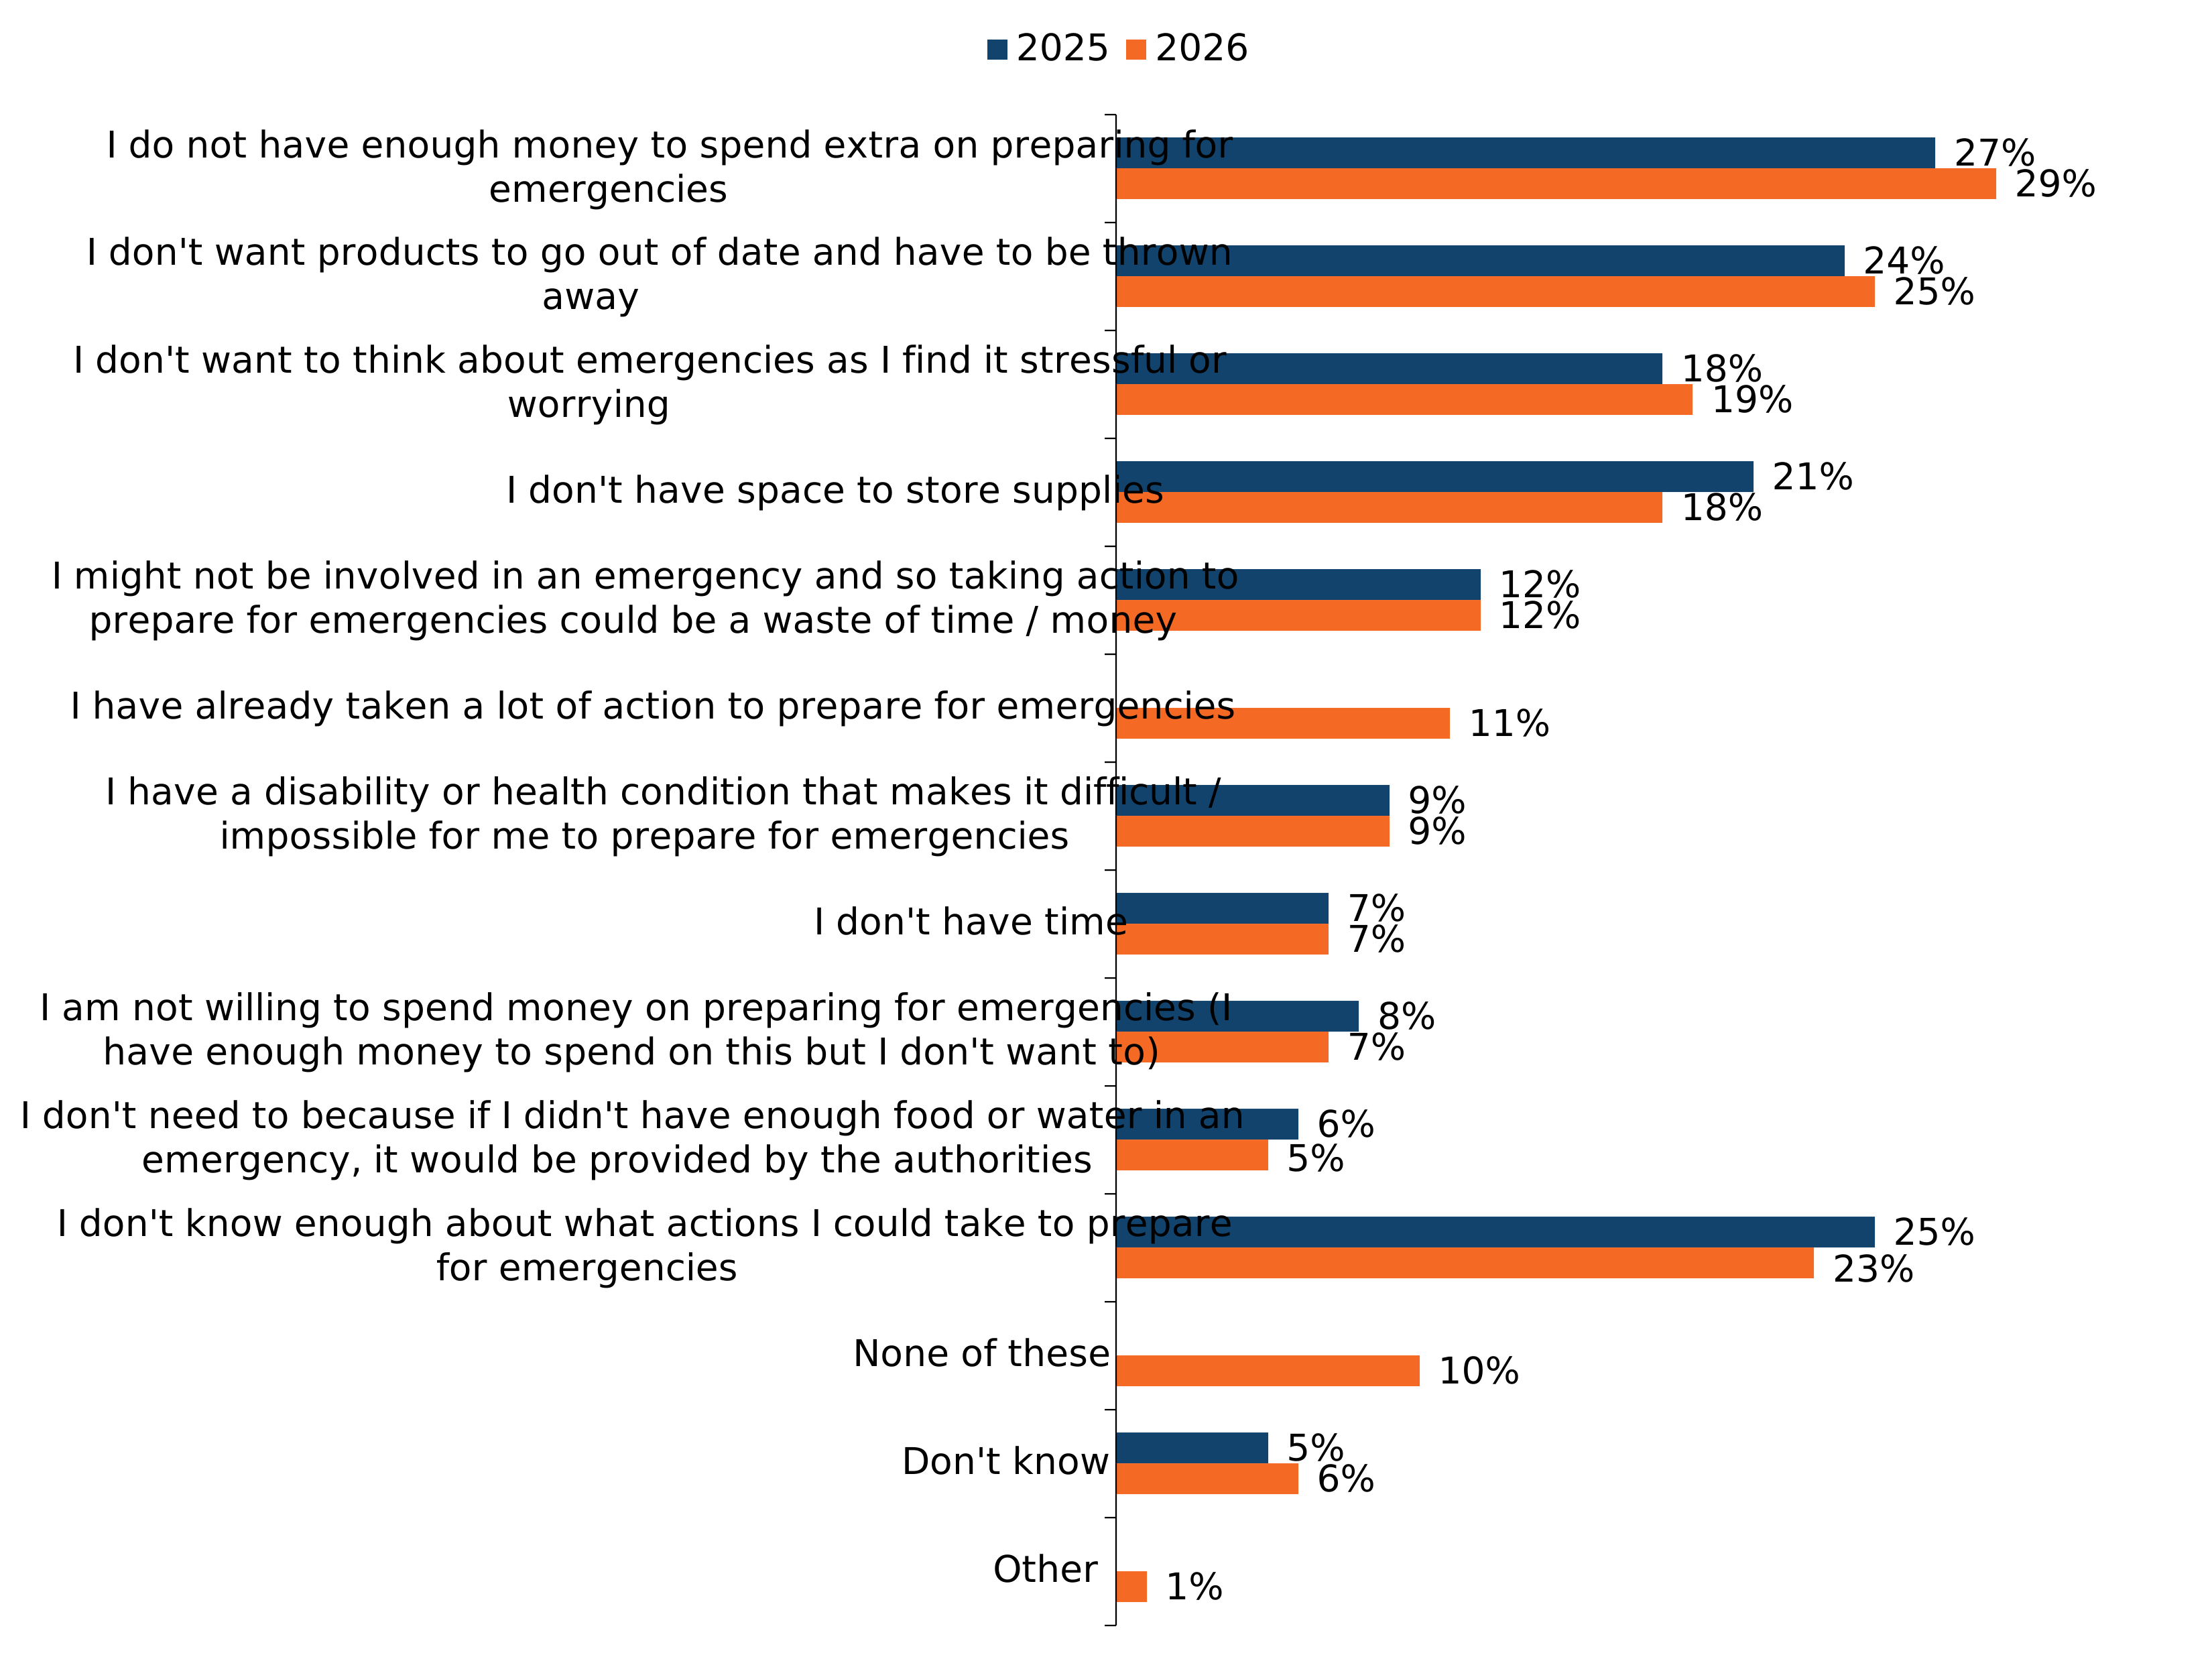
Figure note:
Source: Q30. Which, if any, of the following might prevent you from taking further steps to prepare for emergencies/disasters?
The statement “I have already taken a lot of actions to prepare for emergencies” was not assessed in 2025.
Base: All respondents in UK sample, 2025 (n=10,536); 2026 (n=10,791).
Local and communities
Attitudes towards volunteering and community
The majority (71%) of survey respondents either agreed or strongly agreed that they would be willing to volunteer in some way to help their neighbourhood recover from an emergency/disaster, if safe to do so. This was unchanged from 2025.
The majority (62%) of respondents either agreed or strongly agreed that people in their neighbourhood would pull together in an emergency/disaster. Compared to 2025, there was a two percentage point decline in those agreeing with the statement (from 64% to 62%).
The proportion that agree or strongly agree with each of these statements has remained broadly similar since 2025.
Figure 5.1: Level of agreement with each of the following statements (showing % of respondents) (see UK 2026 table 84 (ODS, 1.15MB))
“If safe to do so, I would be willing to volunteer in some way to help my neighbourhood recover from an emergency/disaster.”
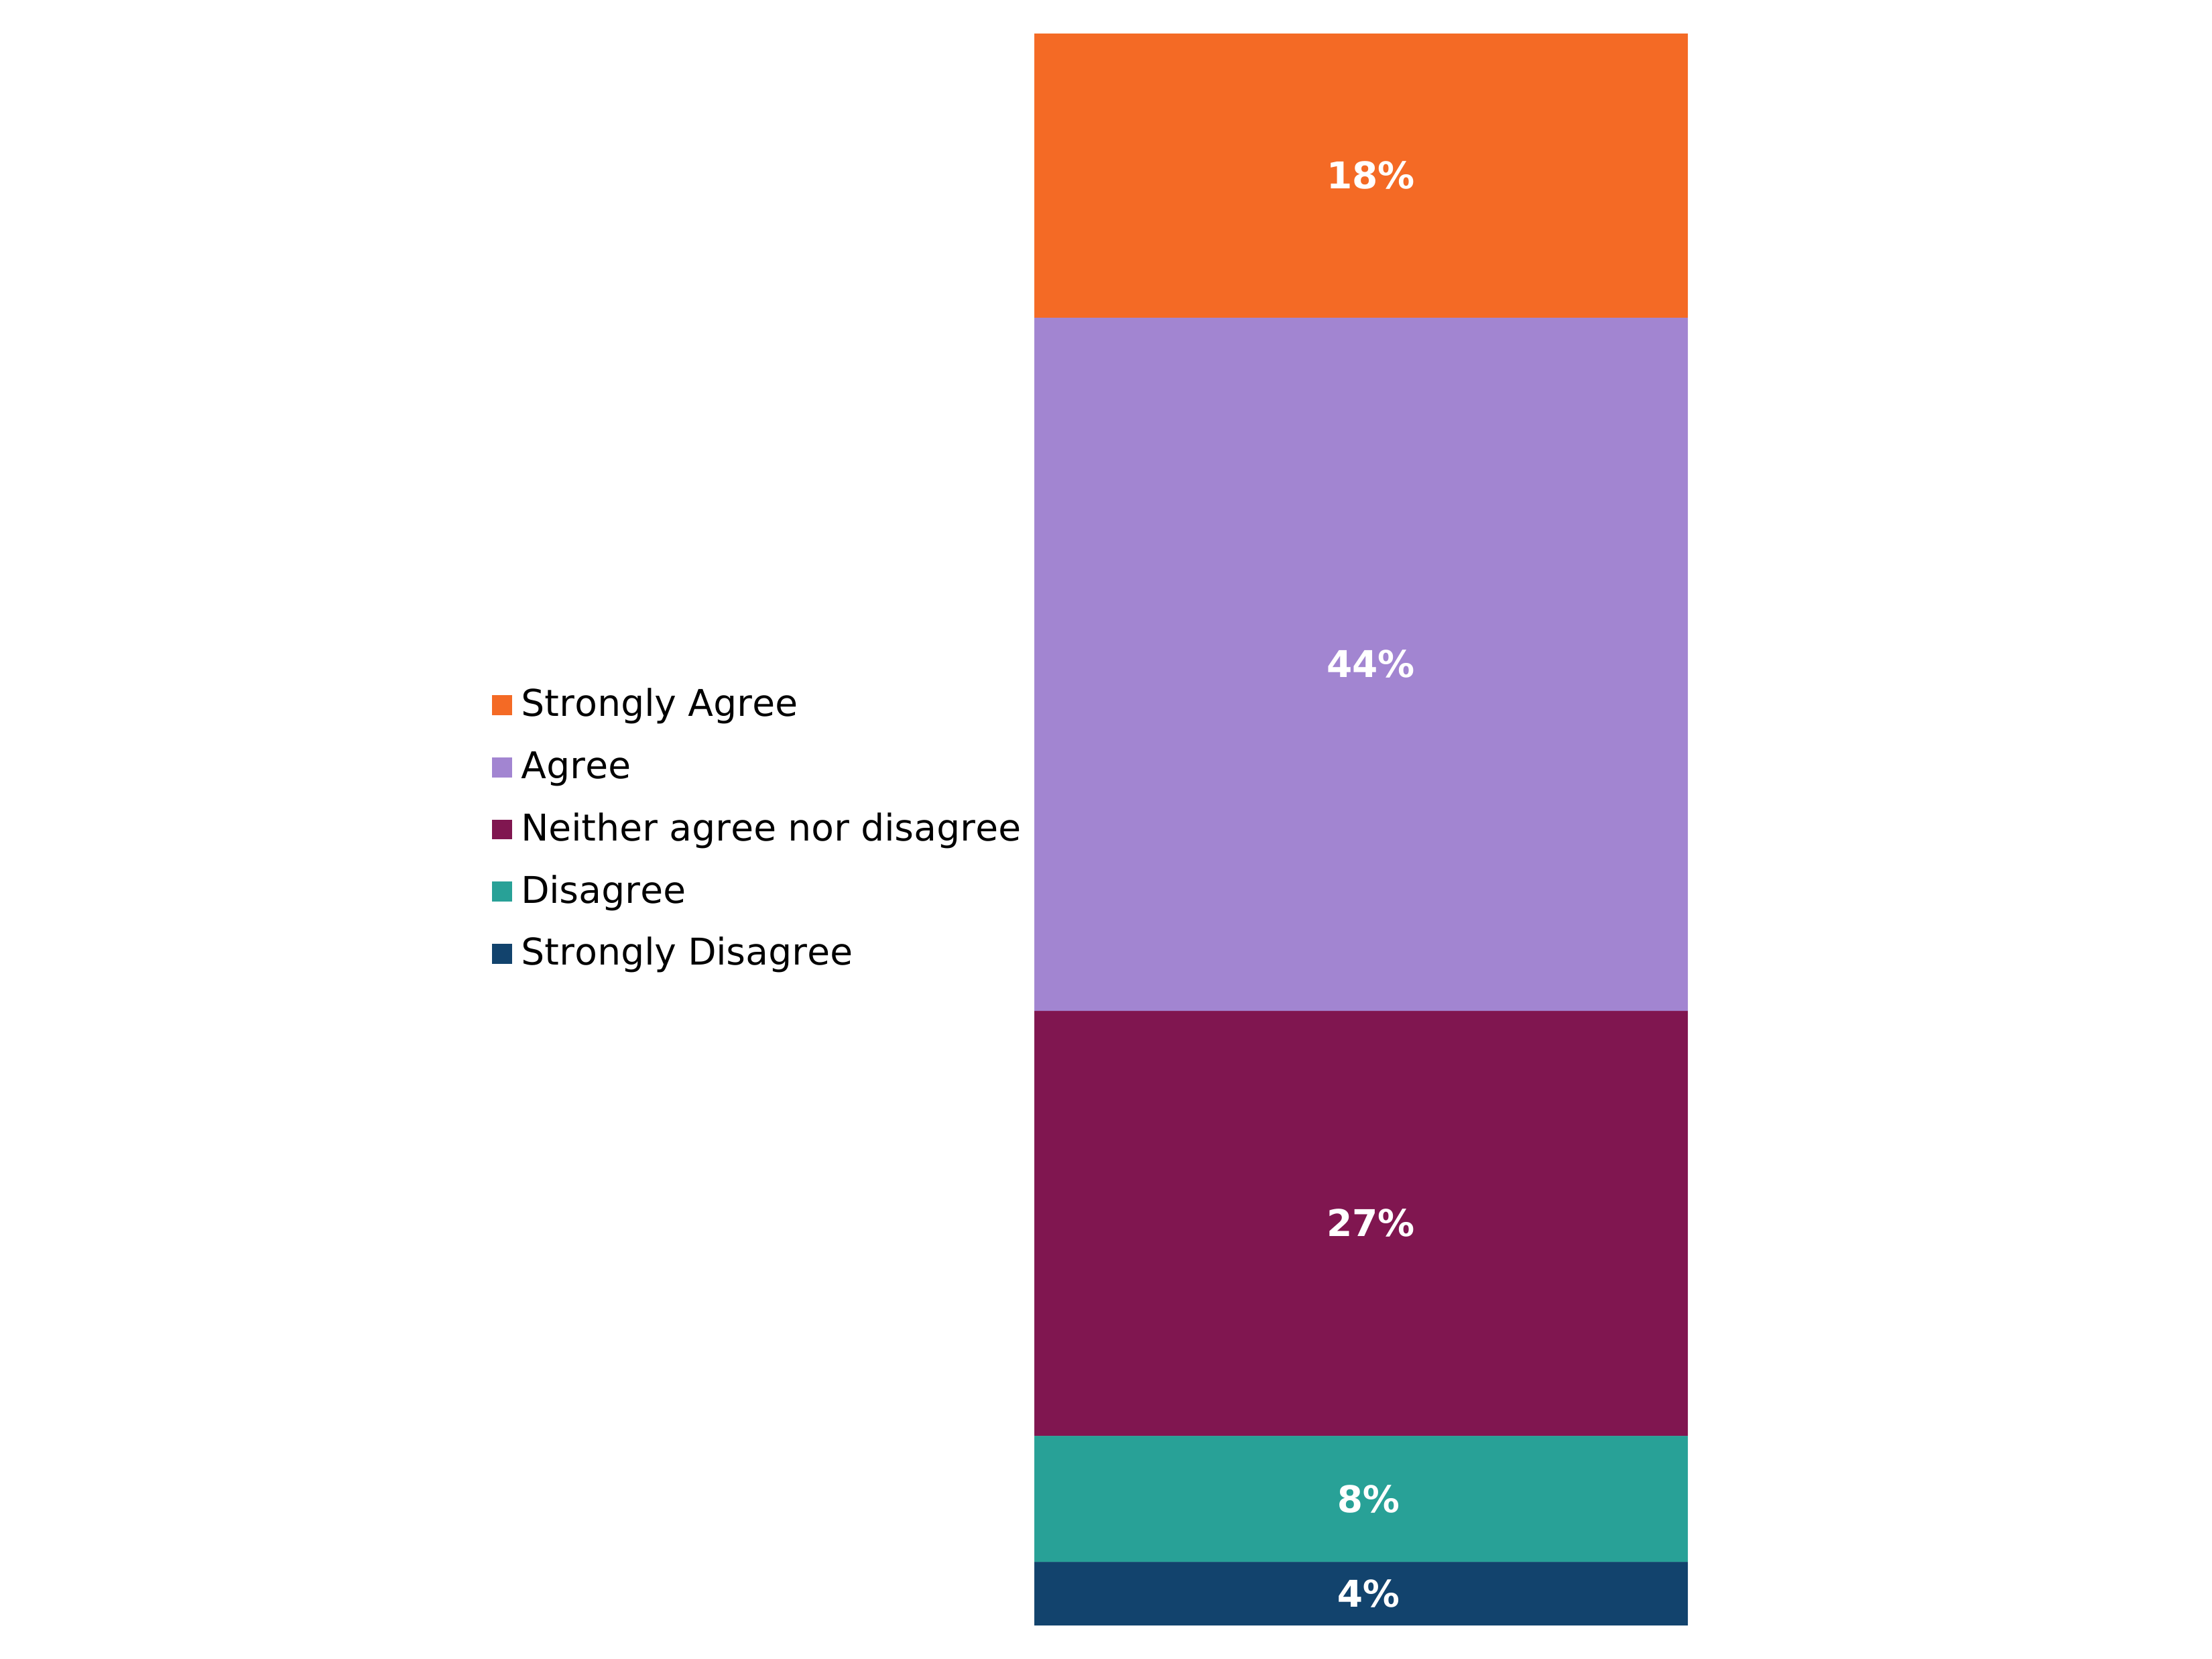
“People in my neighbourhood would pull together in an emergency/disaster.”
Figure note:
Source: Q31. How strongly do you agree or disagree with the following statements?
Base: All respondents in UK sample, 2026 (n=10,791).
Due to rounding, the totals will not always add up to 100%.
Figure 5.2: 2025 to 2026 comparison of level of agreement with each of the following statements (showing % of respondents who agree or strongly agree with each statement) (see UK WoW table 85 (ODS, 1.47MB))
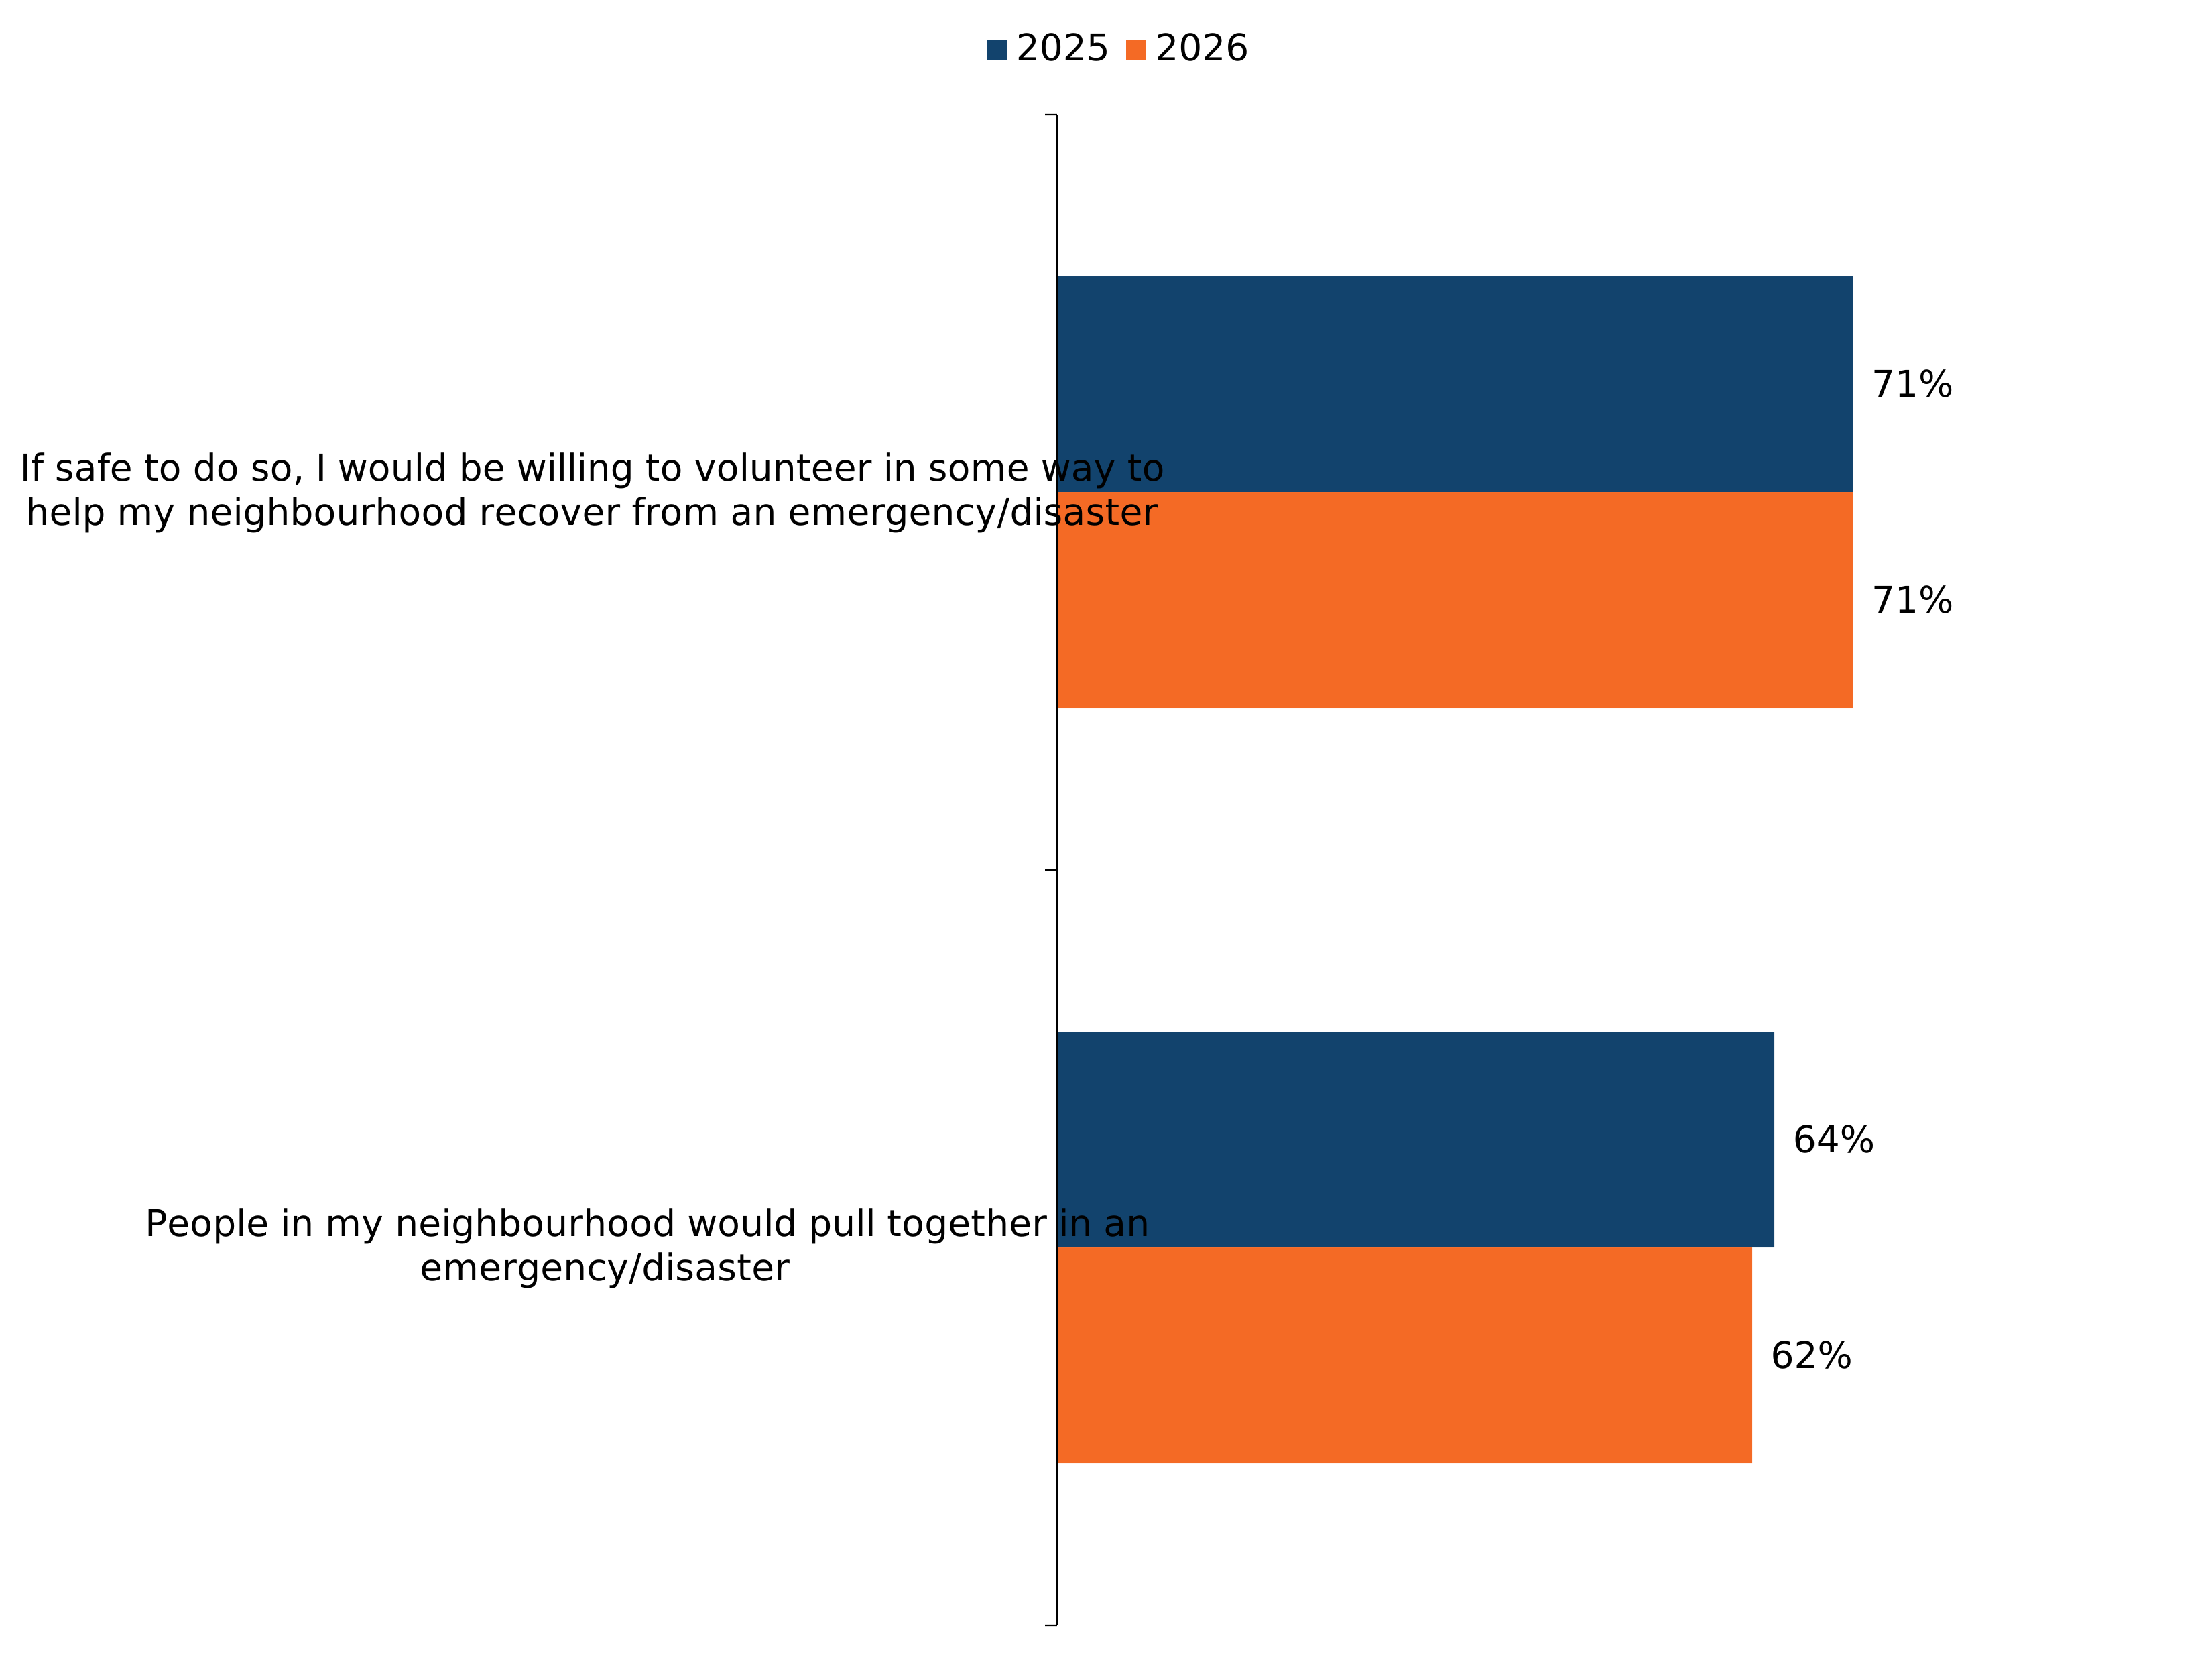
Figure note:
Source: Q31. How strongly do you agree or disagree with the following statements?
Base: All respondents in UK sample, 2025 (n=10,536); 2026 (n=10,791).
50% of survey respondents said that if they had to leave their home due to an emergency, there was someone in their local area they could go and stay with for a few days. 26% said that while there was no-one local they could stay with, there was someone outside their local area they could stay with. 20% said that there was no-one at all they could stay with and 5% said they did not know.
Data note:
Source: Q41. If you had to evacuate (leave) your home due to an emergency, do you have someone you could go and stay with in your local area for a few days? By ‘local area’ we mean the area within 15 to 20 minutes’ walking distance from your home.
Base: All respondents in UK sample (n=10,791). Base: All respondents in UK sample, 2026 (n=10,791).
19% of survey respondents reported knowing of a community group in their area that works on preparing for, responding to, or recovering from emergencies, 67% said they did not know of any such groups and 14% reported not being sure.
The proportion of respondents who reported knowing of a community group in their area in 2026 remained the same to that reported in 2025 (19%). However, the proportion of those who said they did not know of any groups declined by three percentage points (70% to 67%) while those saying they were not sure increased by three percentage points (11% to 14%).
Data note:
Source: Q32. Do you know of any community groups in your area that work on preparing for, responding to or recovery from emergencies? By community groups, we mean people in your local area who come together through a shared interest, identity or work to enhance life in your community, such as faith, social support, or flood warden groups.
Base: All respondents in UK sample, 2025 (n=10,536); 2026 (n=10,791).
Knowledge of local resilience structures
Across the UK, legislation has established multi-agency partnerships that focus on ensuring local areas are prepared for emergencies and disasters. In England and Wales these are called ‘Local Resilience Forums’ (LRFs), in Scotland they are called ‘Regional or Local Resilience Partnerships’ (RRPs/LRPs) and in Northern Ireland they are ‘Emergency Preparedness Groups’ (EPGs). The data for this item is presented separately below as respondents in each country were asked the question about the groups that were relevant to them.
15% of survey respondents in England and Wales reported knowing a great deal or a bit about LRFs. 17% of respondents in Scotland reported knowing a great deal or a bit about RRPs/LRPs and the same proportion of respondents in Northern Ireland (17%) reported knowing a great deal or a bit about EPGs. The majority of survey respondents living in each country had not heard of these groups (73% England and Wales, 69% Scotland, 71% Northern Ireland).
Compared to 2025, knowledge of local resilience structures is broadly unchanged across respondents living in each country. In England and Wales the proportion of respondents saying they know a great deal or a bit about LRFs increased marginally by one percentage point (from 14% to 15%), while the proportion of those saying they had not heard of them before the day of the survey remained unchanged (73%).
In Scotland the proportion saying they know a great deal or a bit about RRPs/LRPs and what they do declined by one percentage point (from 18% to 17%), while those saying they had not heard of them the day before the survey increased by one percentage point (from 68% to 69%).
In Northern Ireland the proportion of those saying they know a great deal or a bit about EPGs and what they do declined by one percentage point (from 18% to 17%), while the proportion who said they had not heard of them the day before the survey decreased by one percentage point (from 72% to 71%).
Figure 5.3: How much respondents in England and Wales knew about Local Resilience Forums (showing % of respondents) (see UK 2026 table 91 (ODS, 1.15MB))
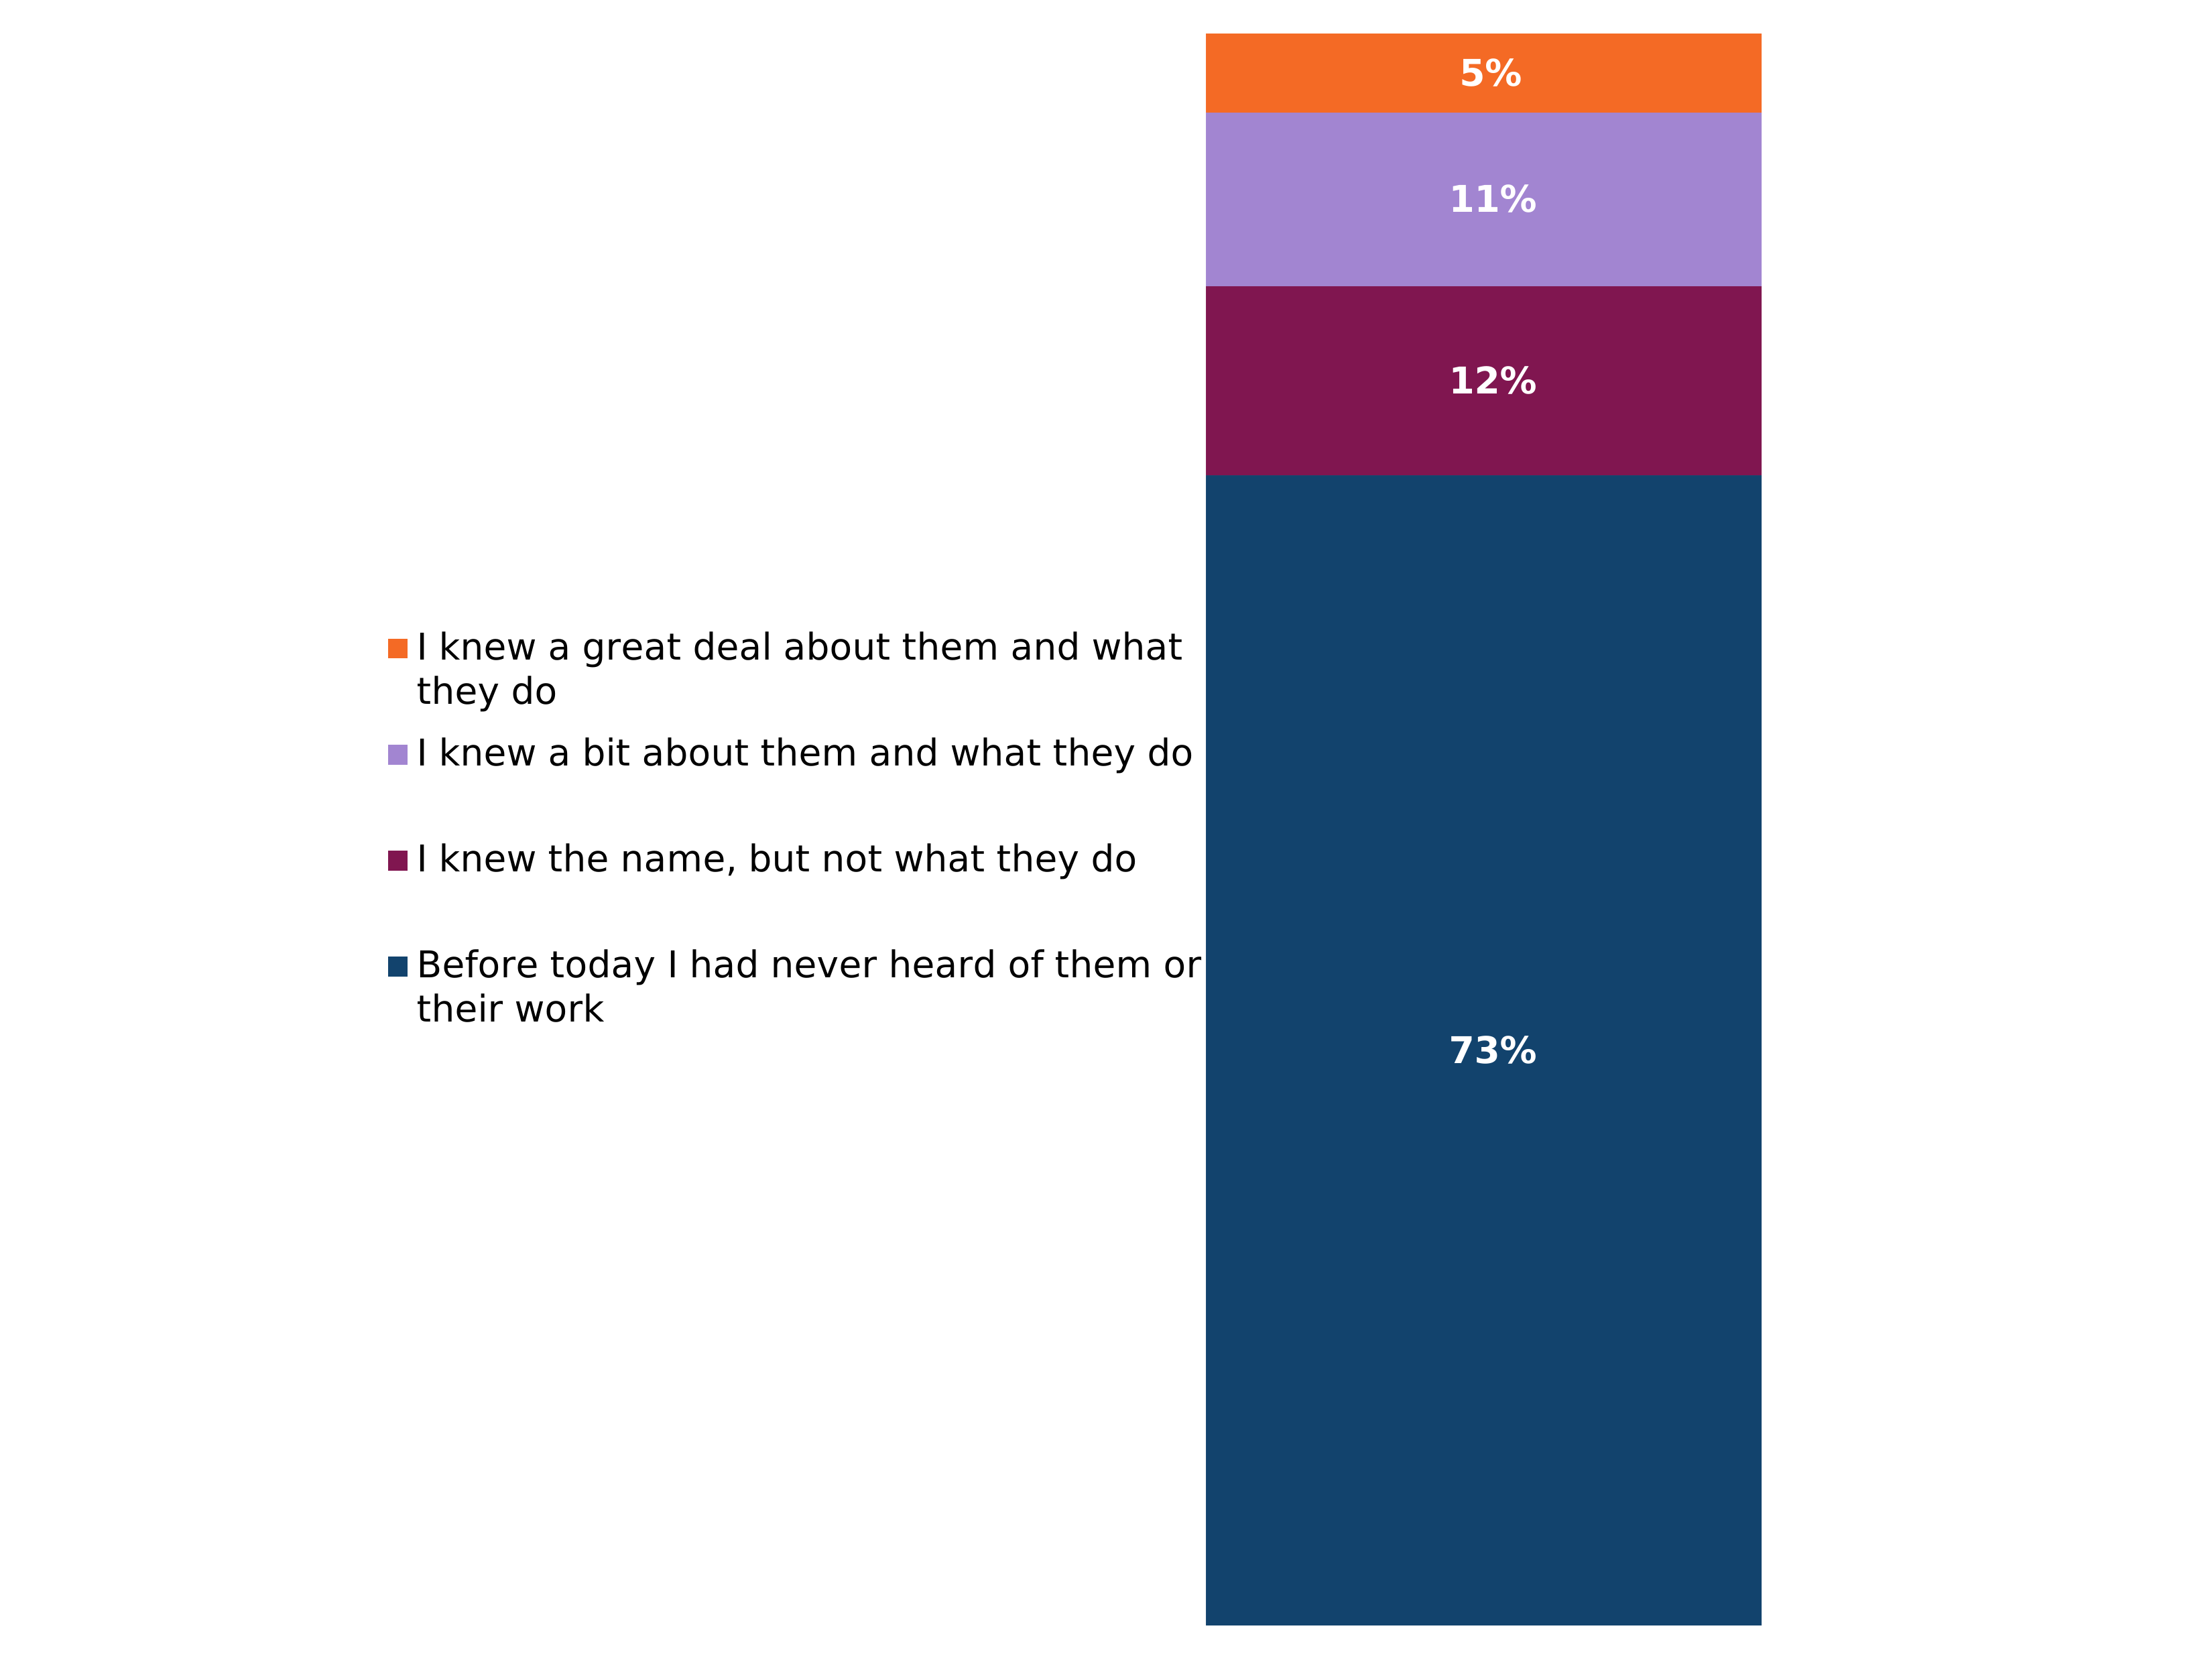
Figure notes:
Source: LRF. Local Resilience Forums (LRFs) are multi-agency partnerships that plan for emergencies that might affect your local area. They are made up of representatives from local public services, including the emergency services, health services, local authorities and other organisations. Before today, how much did you know about Local Resilience Forums?
Base: Those who live in England or Wales, 2026 (n=8,131).
Due to rounding, the percentages for LRF add up to 101% in 2026.
Figure 5.4: 2025 to 2026 comparison of how much respondents in England and Wales knew about Local Resilience Forums (showing % of respondents) (see UK WoW table 91 (ODS, 1.47MB))
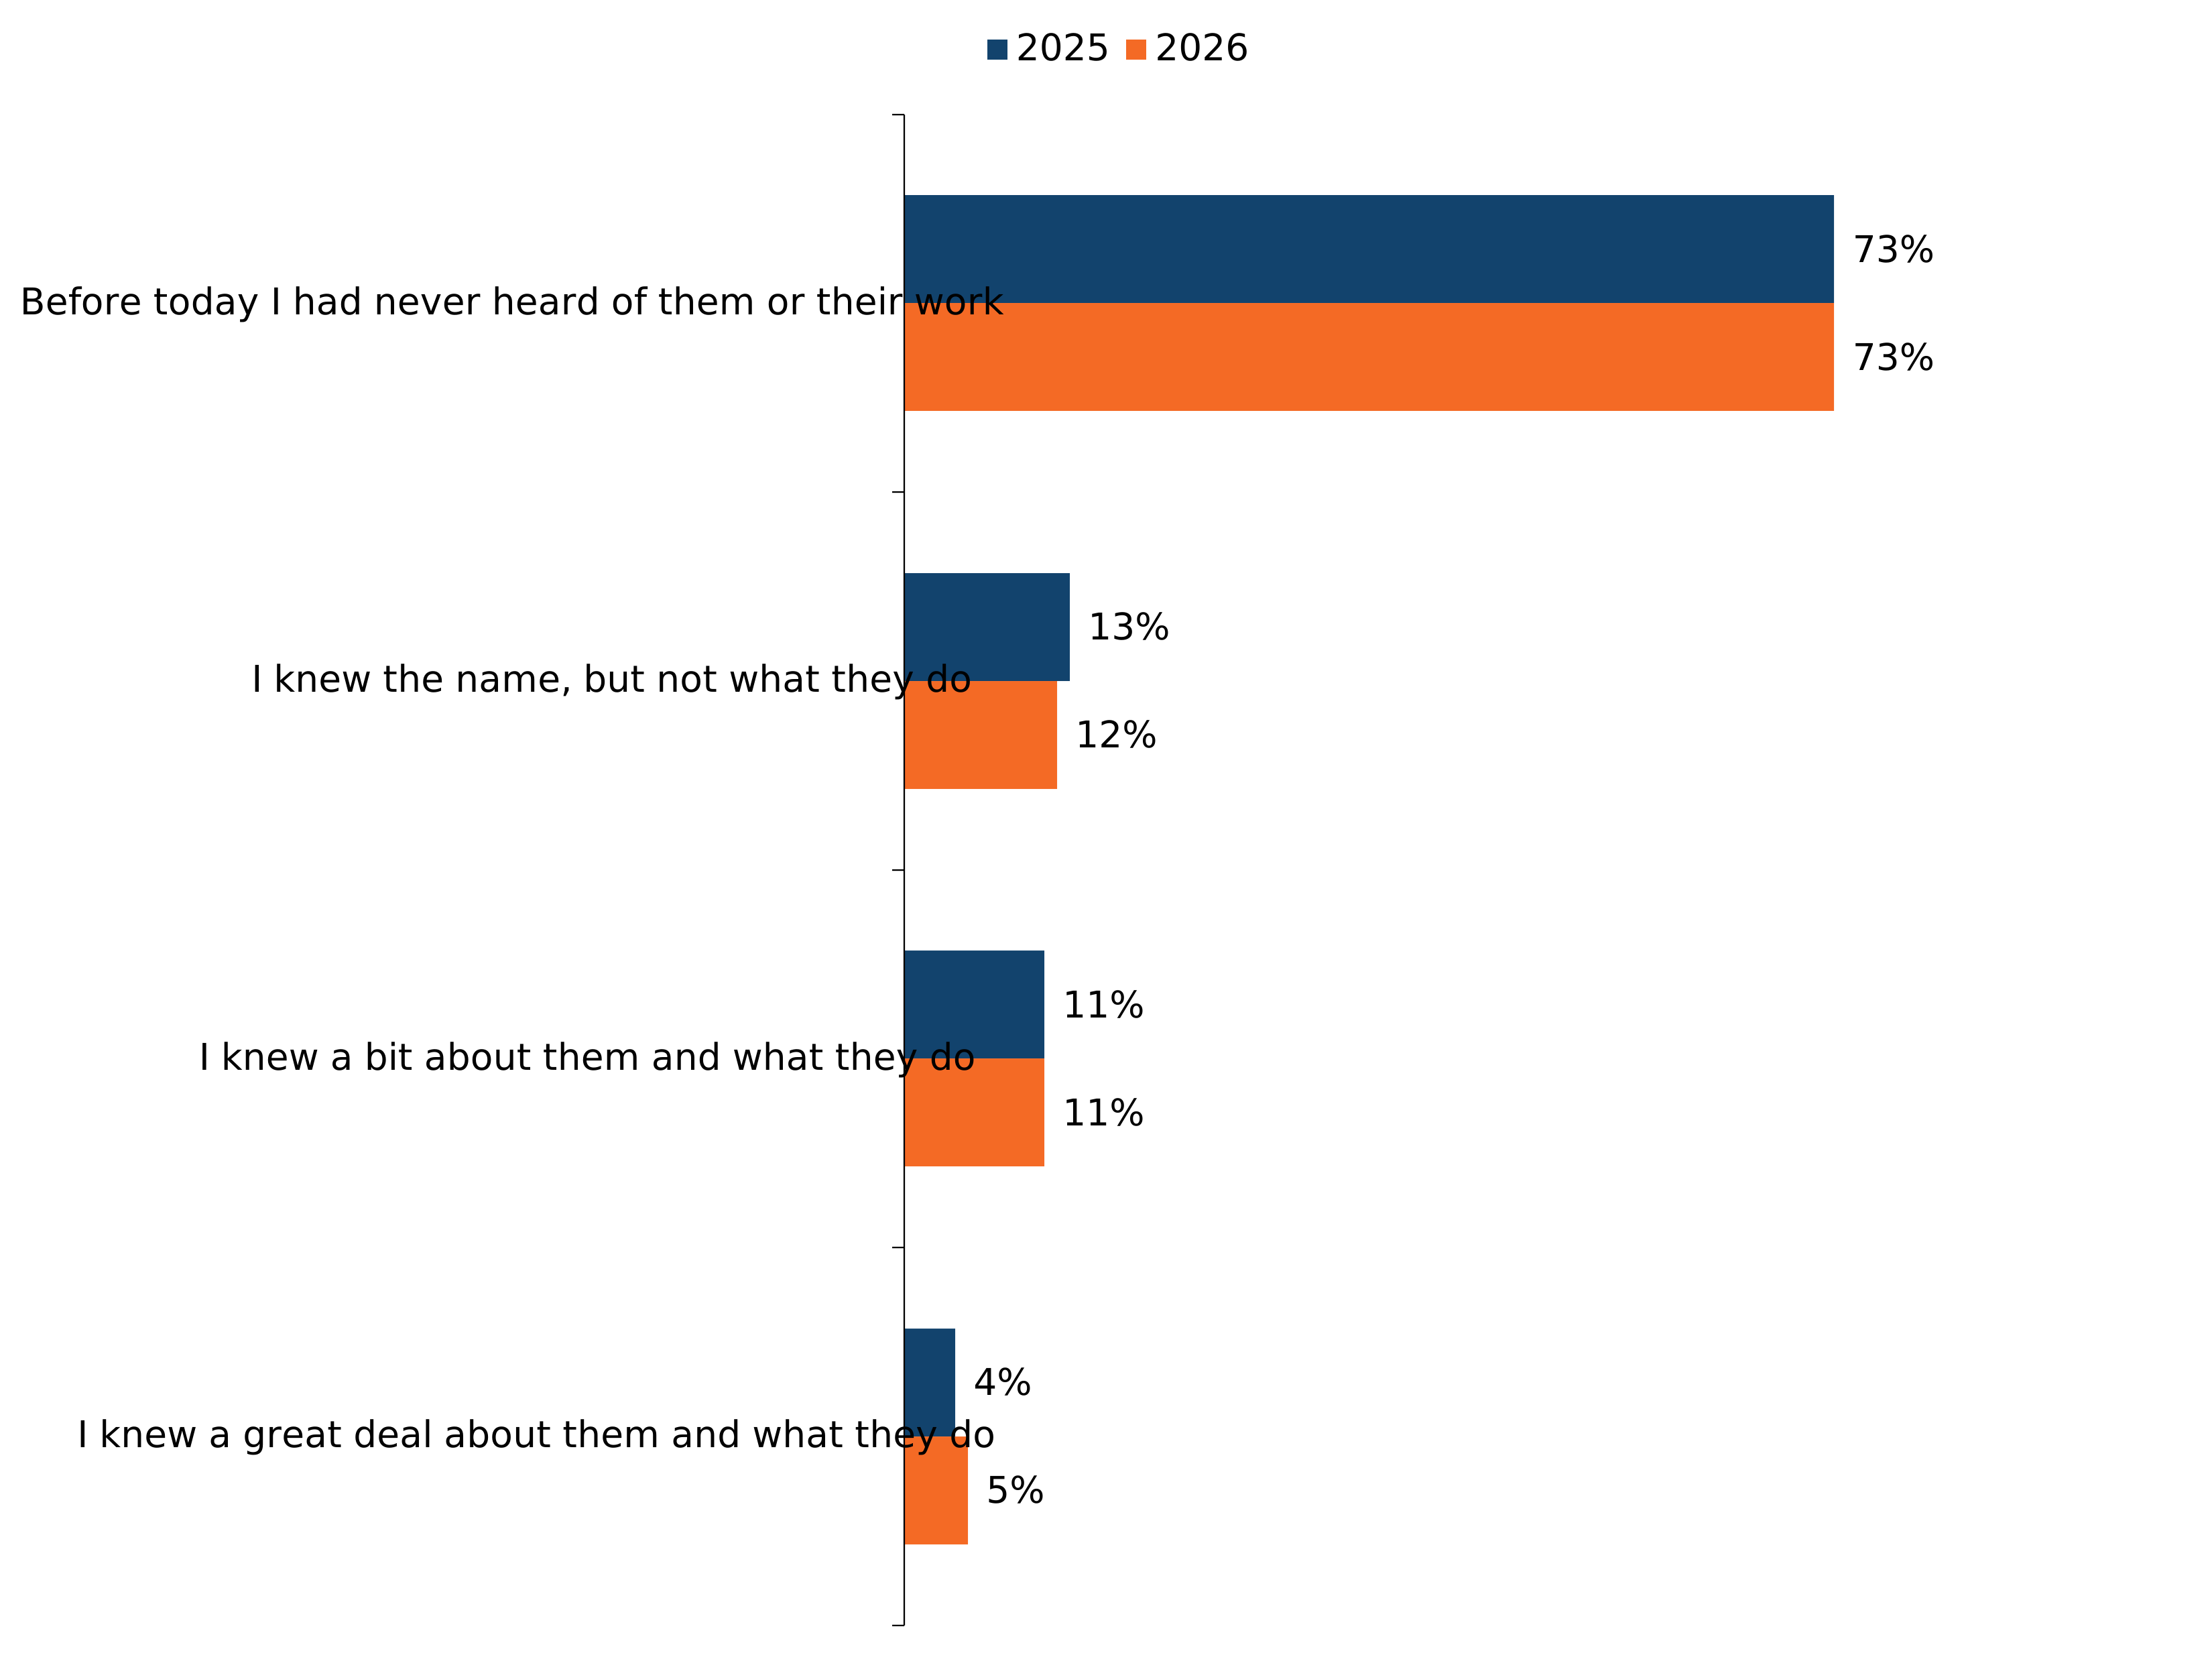
Figure notes:
Source: LRF. Local Resilience Forums (LRFs) are multi-agency partnerships that plan for emergencies that might affect your local area. They are made up of representatives from local public services, including the emergency services, health services, local authorities and other organisations. Before today, how much did you know about Local Resilience Forums?
Base: Those who live in England or Wales, 2025 (n=7,781); 2026 (n=8,131).
Due to rounding, the percentages for LRF add up to 101% in both 2025 and 2026.
Figure 5.5: How much respondents in Scotland knew about Regional and Local Resilience Partnerships (showing % of respondents) (see UK 2026 table 92 (ODS, 1.15MB))
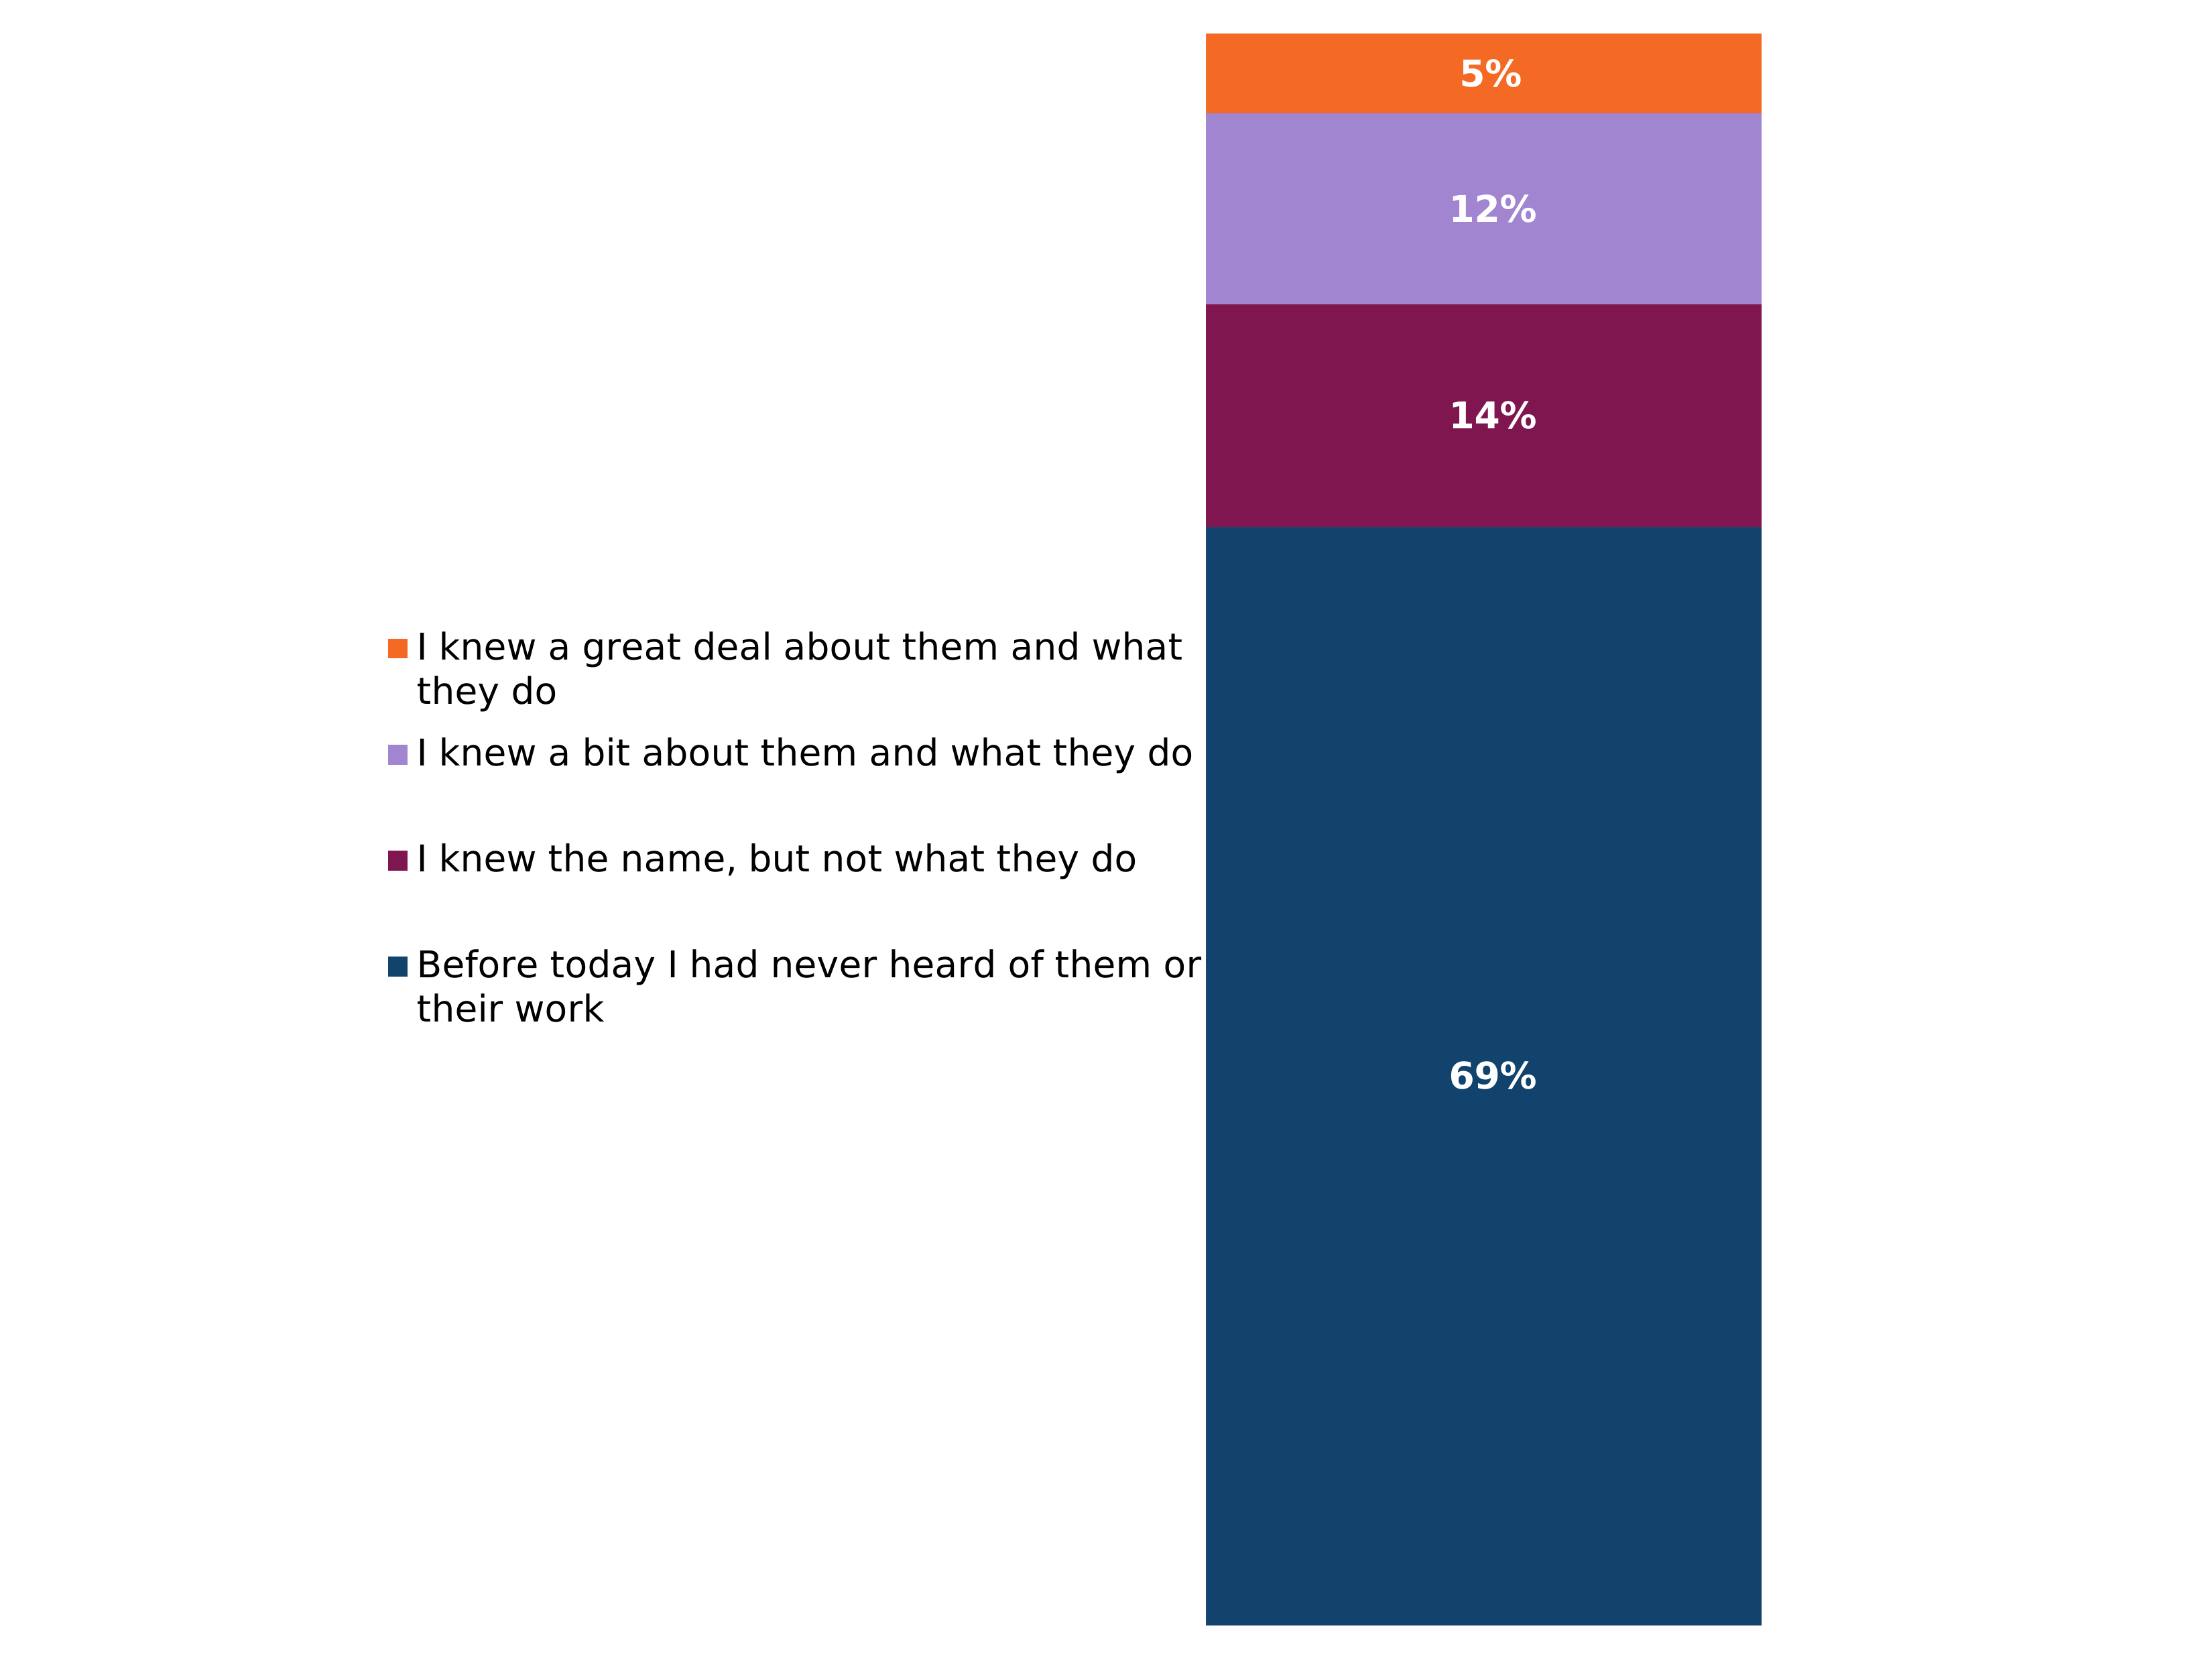
Figure note:
Source: RRP. Regional and Local Resilience Partnerships (RRPs/LRPs) are multi-agency partnerships that plan for emergencies that might affect your local area. They are made up of representatives from local public services, including the emergency services, health services, local authorities and other organisations. Before today, how much did you know about Regional and Local Resilience Partnerships?
Base: Those who live in Scotland, 2026 (n=1,578).
Figure 5.6: 2025 to 2026 comparison of how much respondents in Scotland knew about Regional and Local Resilience Partnerships (showing % of respondents) (see UK WoW table 92 (ODS, 1.47MB))
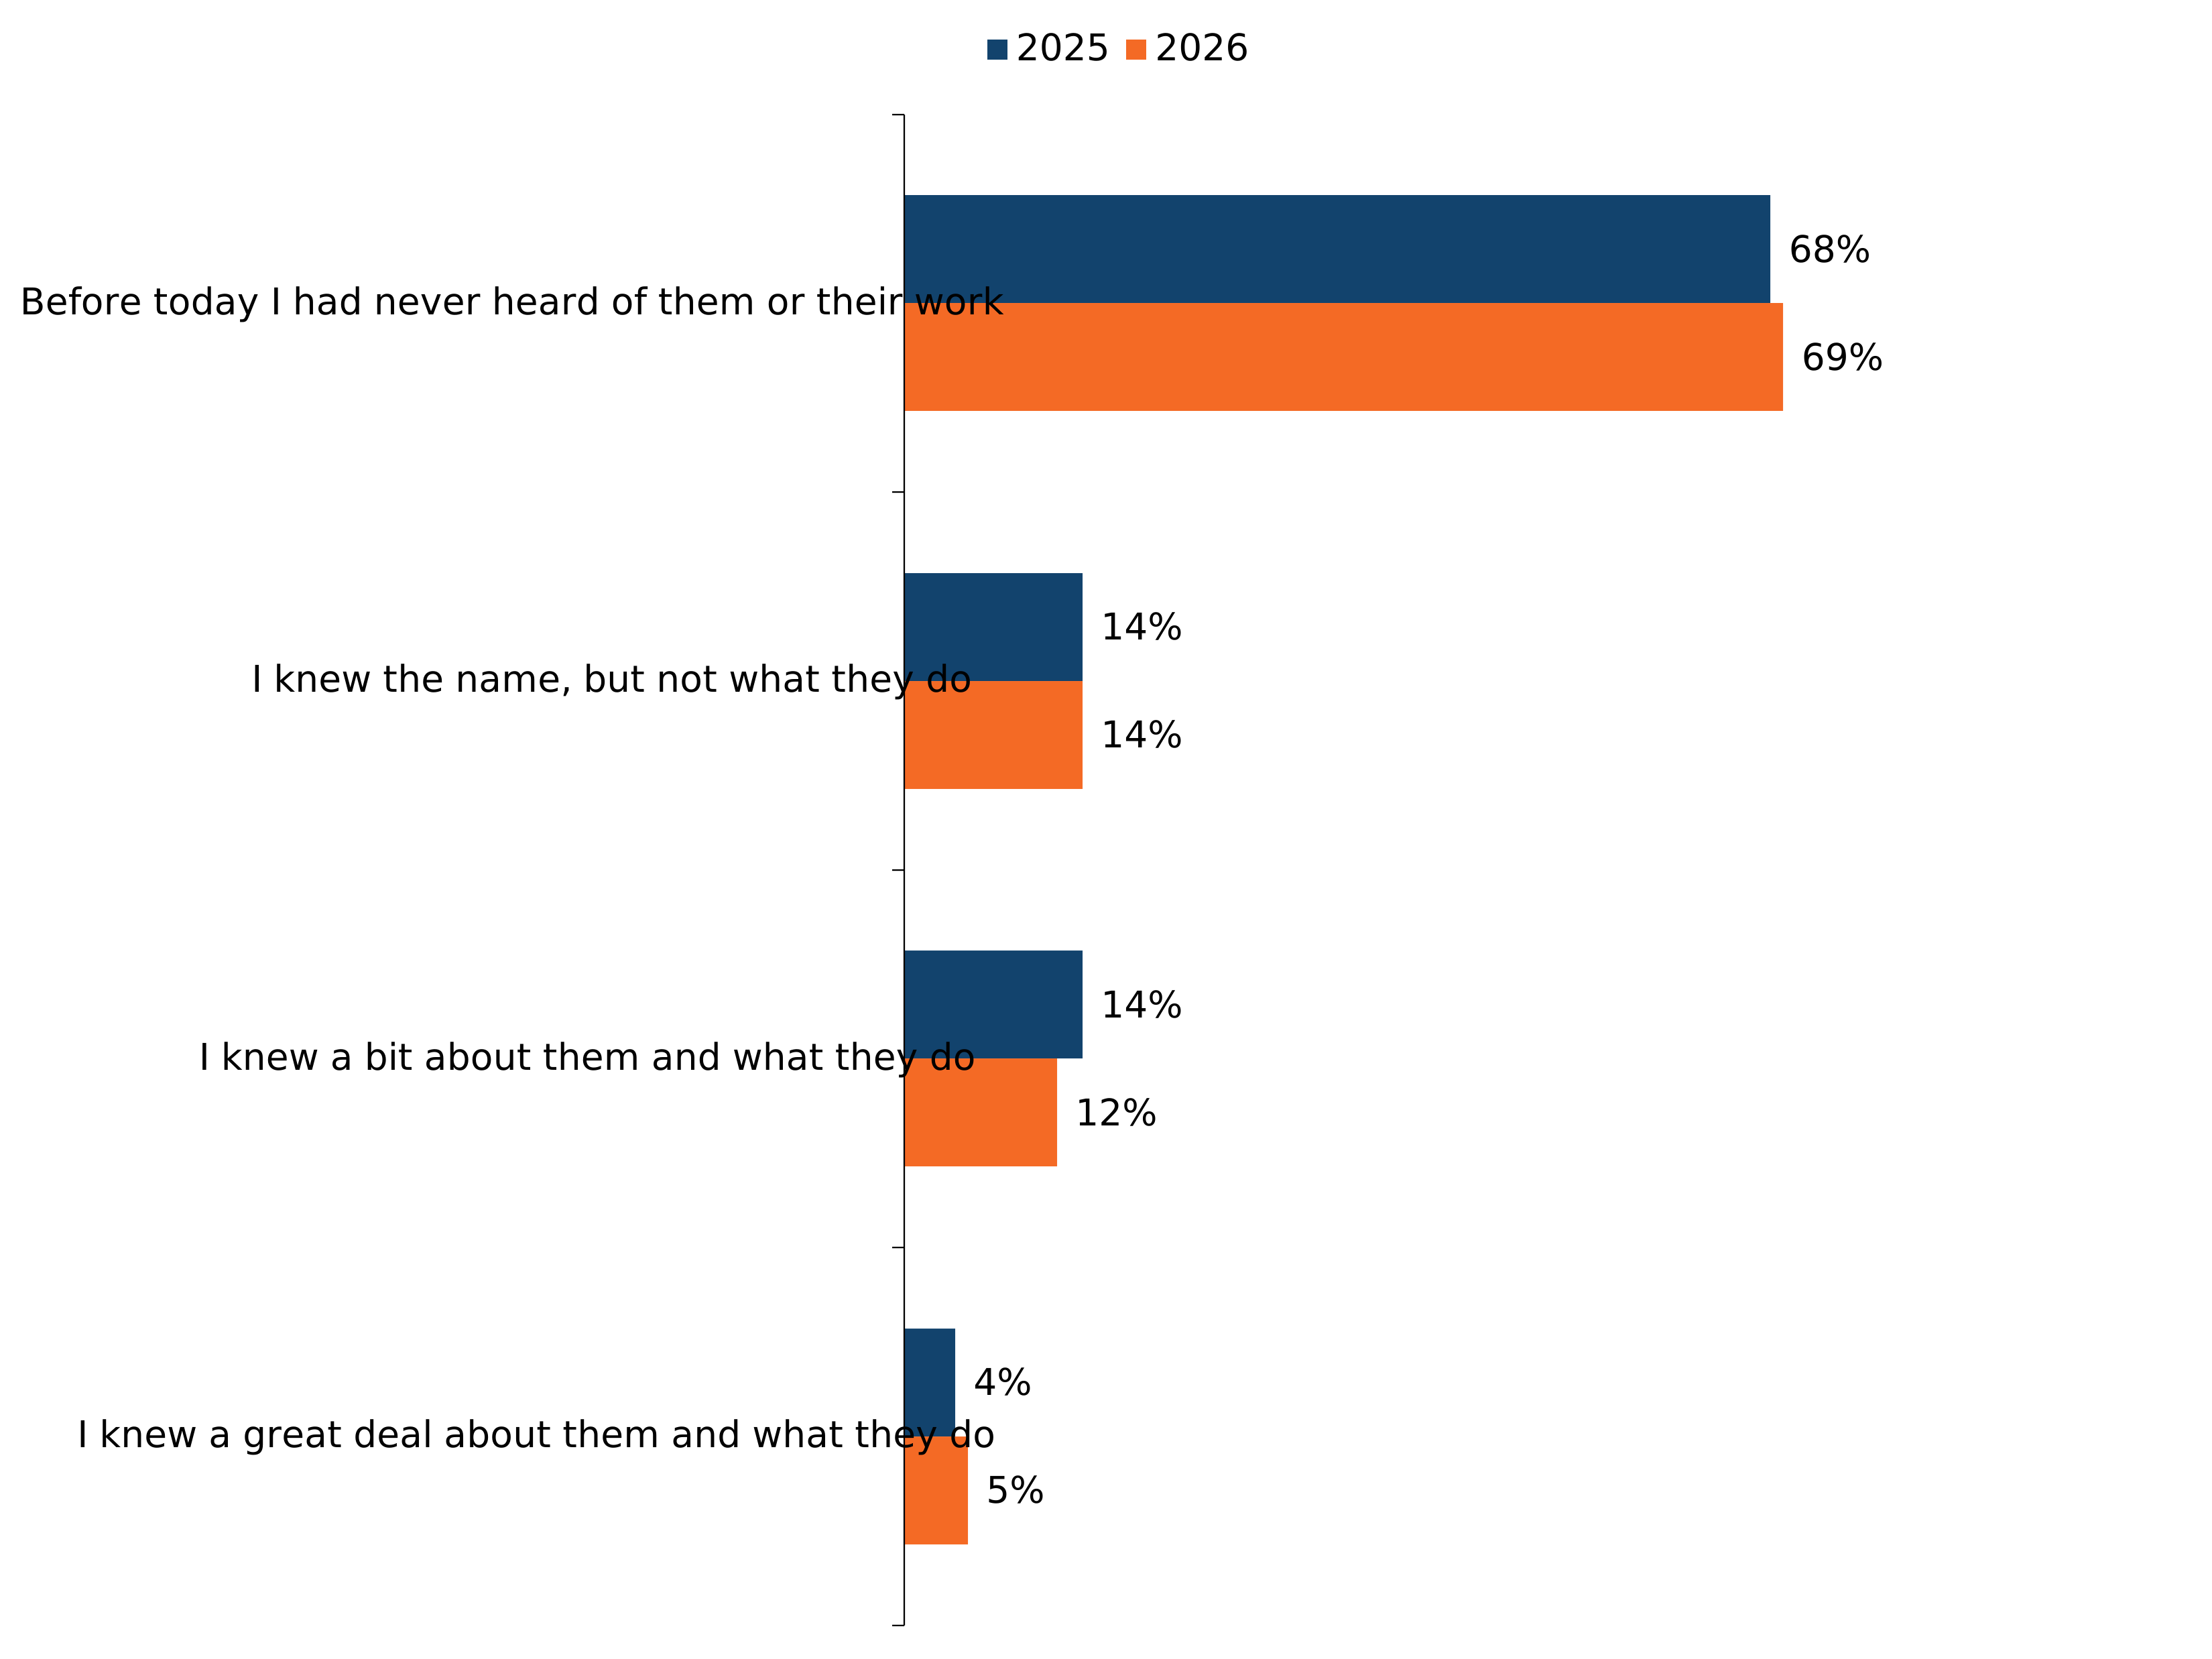
Figure note:
Source: RRP. Regional and Local Resilience Partnerships (RRPs/LRPs) are multi-agency partnerships that plan for emergencies that might affect your local area. They are made up of representatives from local public services, including the emergency services, health services, local authorities and other organisations. Before today, how much did you know about Regional and Local Resilience Partnerships?
Base: Those who live in Scotland, 2025 (n=1,671); 2026 (n=1,578).
Figure 5.7: How much respondents in Northern Ireland knew about Emergency Preparedness Groups (showing % of respondents) (see UK 2026 table 93 (ODS, 1.15MB))
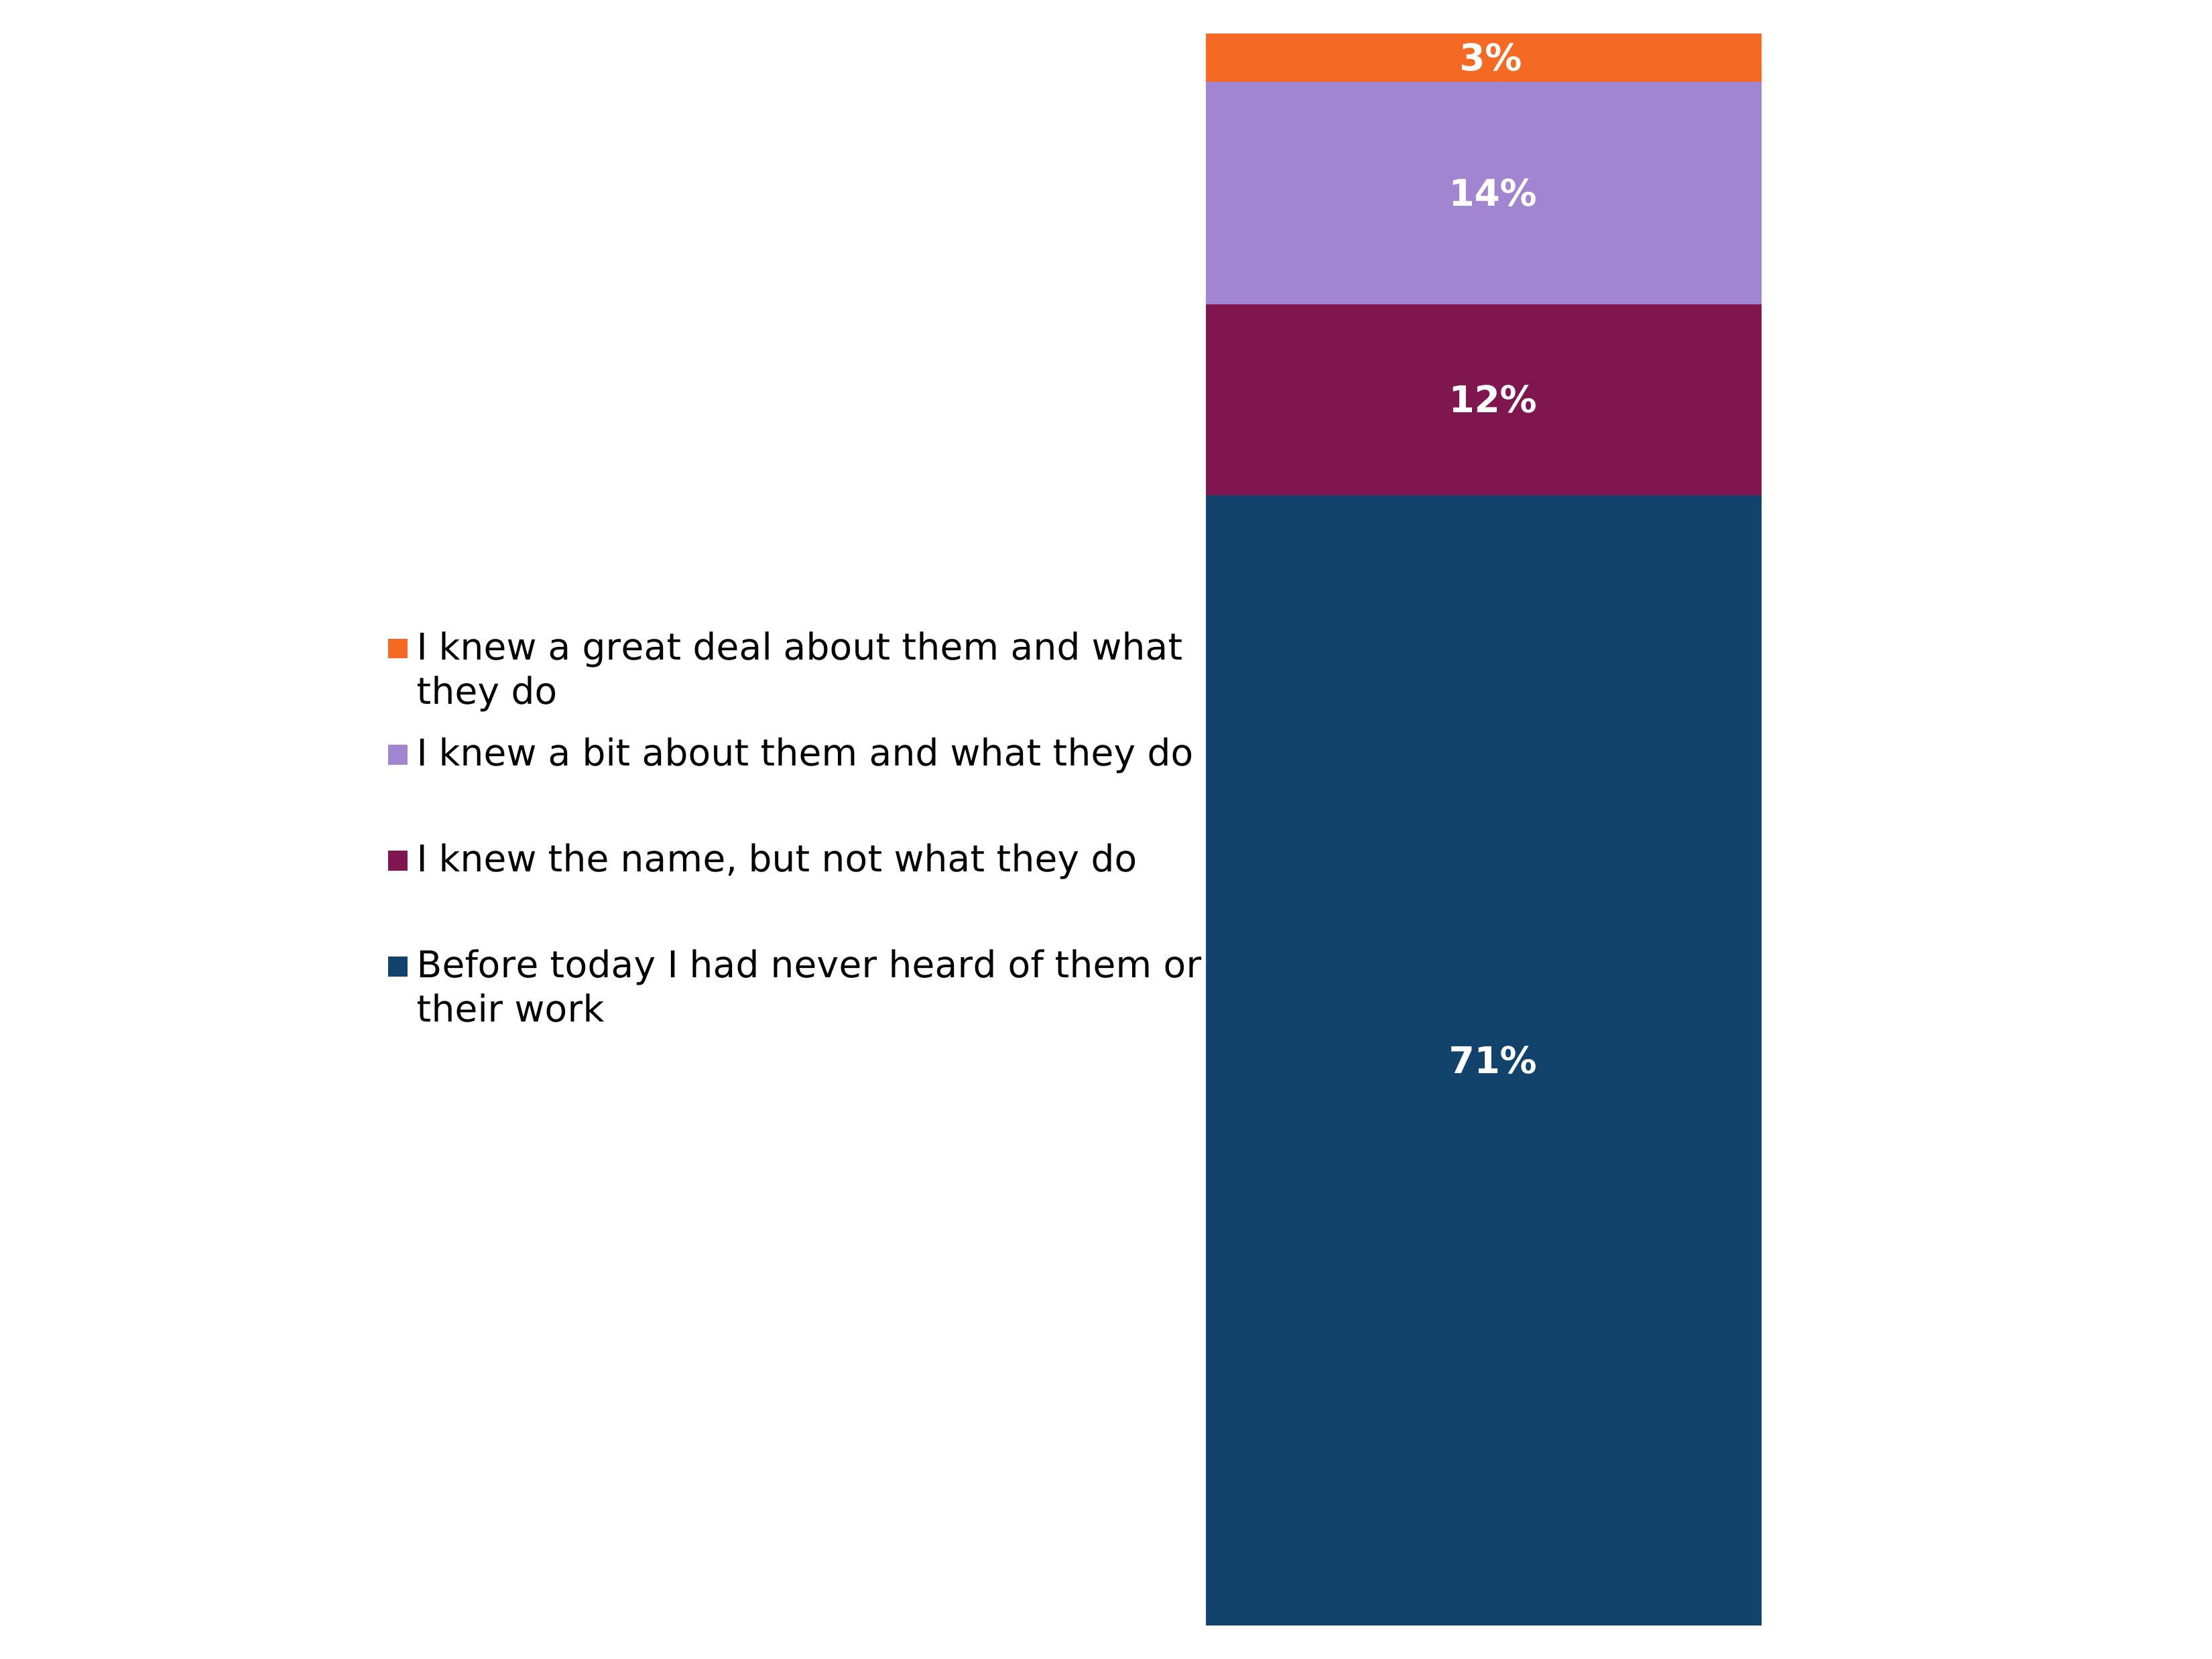
Figure note:
Source: EPG. Emergency Preparedness Groups are multi-agency partnerships that plan for emergencies that might affect your local area. They are made up of representatives from local public services, including the emergency services, health services, local authorities and other organisations. Before today, how much did you know about Emergency Preparedness Groups?
Base: Those who live in Northern Ireland, 2026 (n=1,082).
Figure 5.8: 2025 to 2026 comparison of how much respondents in Northern Ireland knew about Emergency Preparedness Groups (showing % of respondents) (see UK WoW table 93 (ODS, 1.47MB))
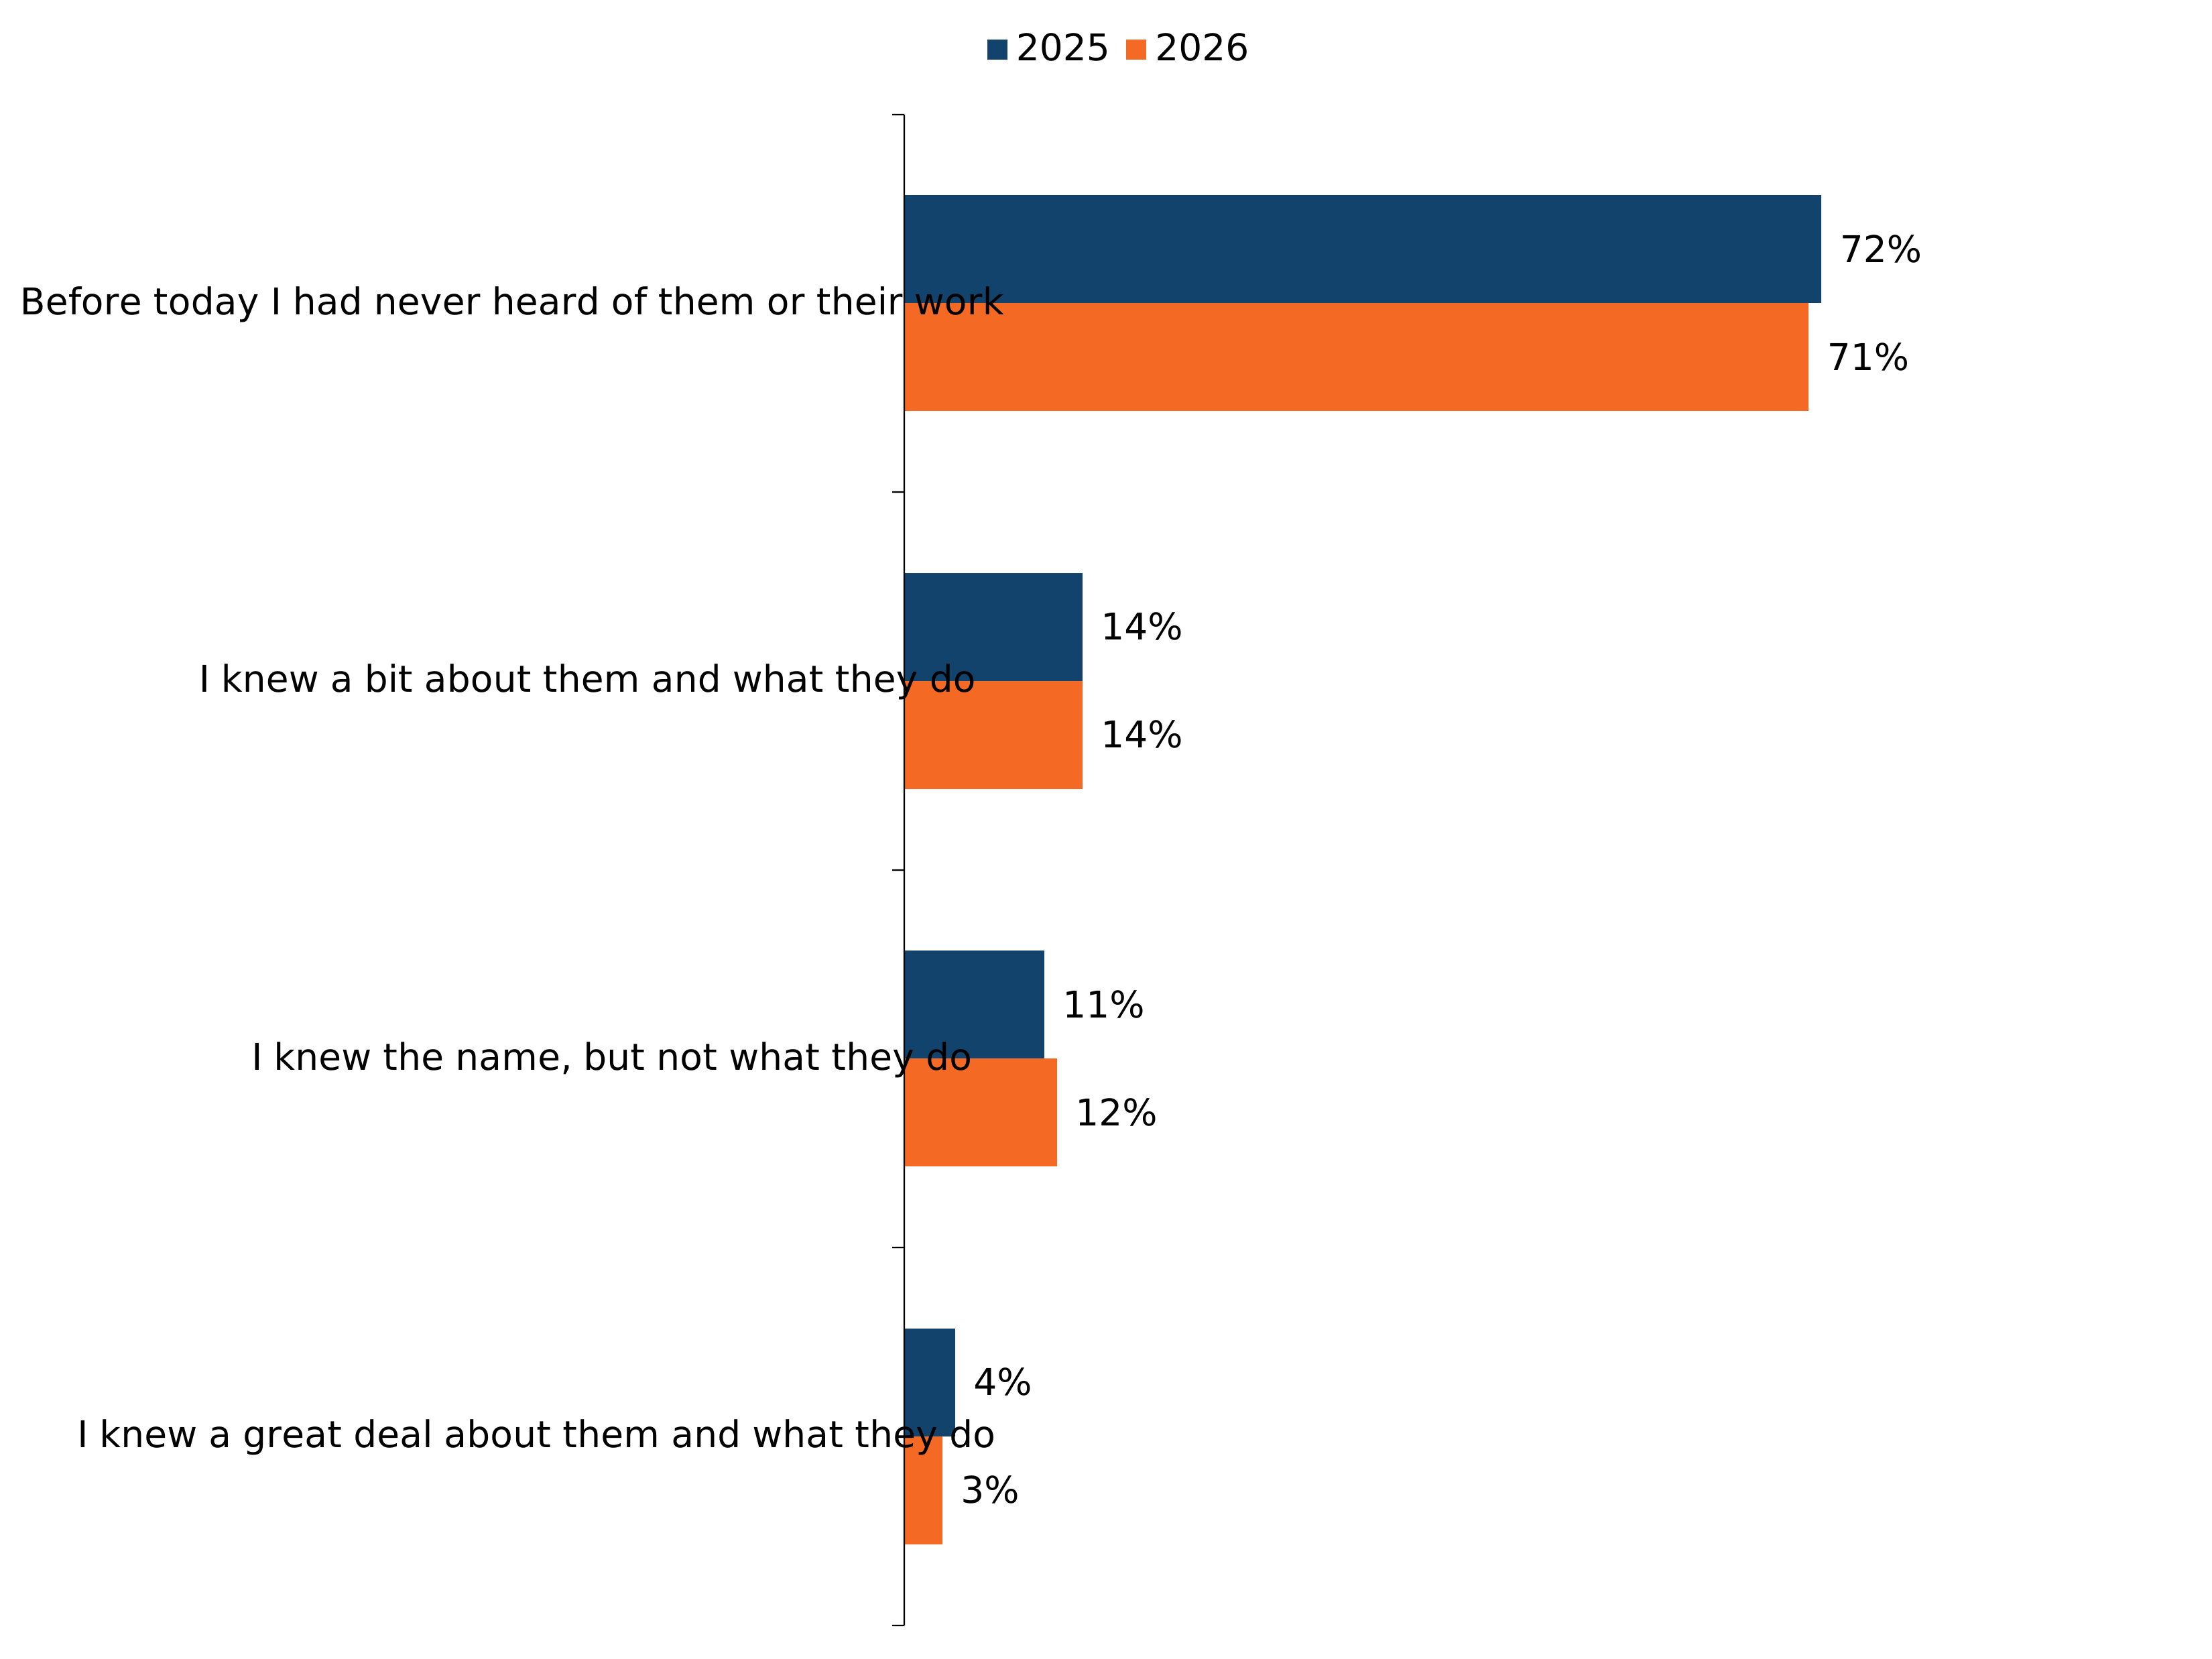
Figure note:
Source: EPG. Emergency Preparedness Groups are multi-agency partnerships that plan for emergencies that might affect your local area. They are made up of representatives from local public services, including the emergency services, health services, local authorities and other organisations. Before today, how much did you know about Emergency Preparedness Groups?
Base: Those who live in Northern Ireland 2025 (n=1,084); 2026 (n=1,082).
Due to rounding, the percentages for EPG add up to 101% in 2025.
Additional support needs
People who have specific needs can register with their utilities providers for additional support such as priority in power cuts, bottled water in water outages and receiving bills in an accessible format. This is called a Priority Service Register in England, Scotland and Wales and a Customer Care Register in Northern Ireland.
44% of survey respondents reported that they were aware of Priority Service Registers/Customer Care Registers before the day of the survey, and 56% stated that they were not aware.
Compared to 2025, awareness of Priority Service Registers/Customer Care Registers was stable, with the proportion who indicated they were aware rising one percentage point (43% to 44%) and those who indicated they were not aware falling one percentage point (57% to 56%).
Note: Prior to answering the question, survey respondents were shown an information screen which contained a description of the service.
Data note:
Source: Q33. Before today were you aware of this service?
Base: All respondents in UK sample (n=10,791).
38% of respondents indicated that they or someone in their household was registered with at least one utilities company for additional priority support, through either the Priority Services Register in England, Scotland and Wales or the Customer Care Register in Northern Ireland. Registration was most commonly reported with an electricity company (29%), followed by a gas company (23%) and a water company (23%). Just over half (53%) indicated they were not registered for additional priority support and 9% said they did not know.
Note: The format of this question changed between waves. In 2025, respondents were asked whether they were registered for additional priority support with a yes, no or don’t know response, without specifying individual utility providers. As a result, no year-on-year comparison is provided for this question.
Figure 5.9: Level of registration for additional priority support, and the utilities respondents are registered with (showing % of respondents) (see UK 2026 table 95 (ODS, 1.15MB) & UK WoW table 95 (ODS, 1.47MB))
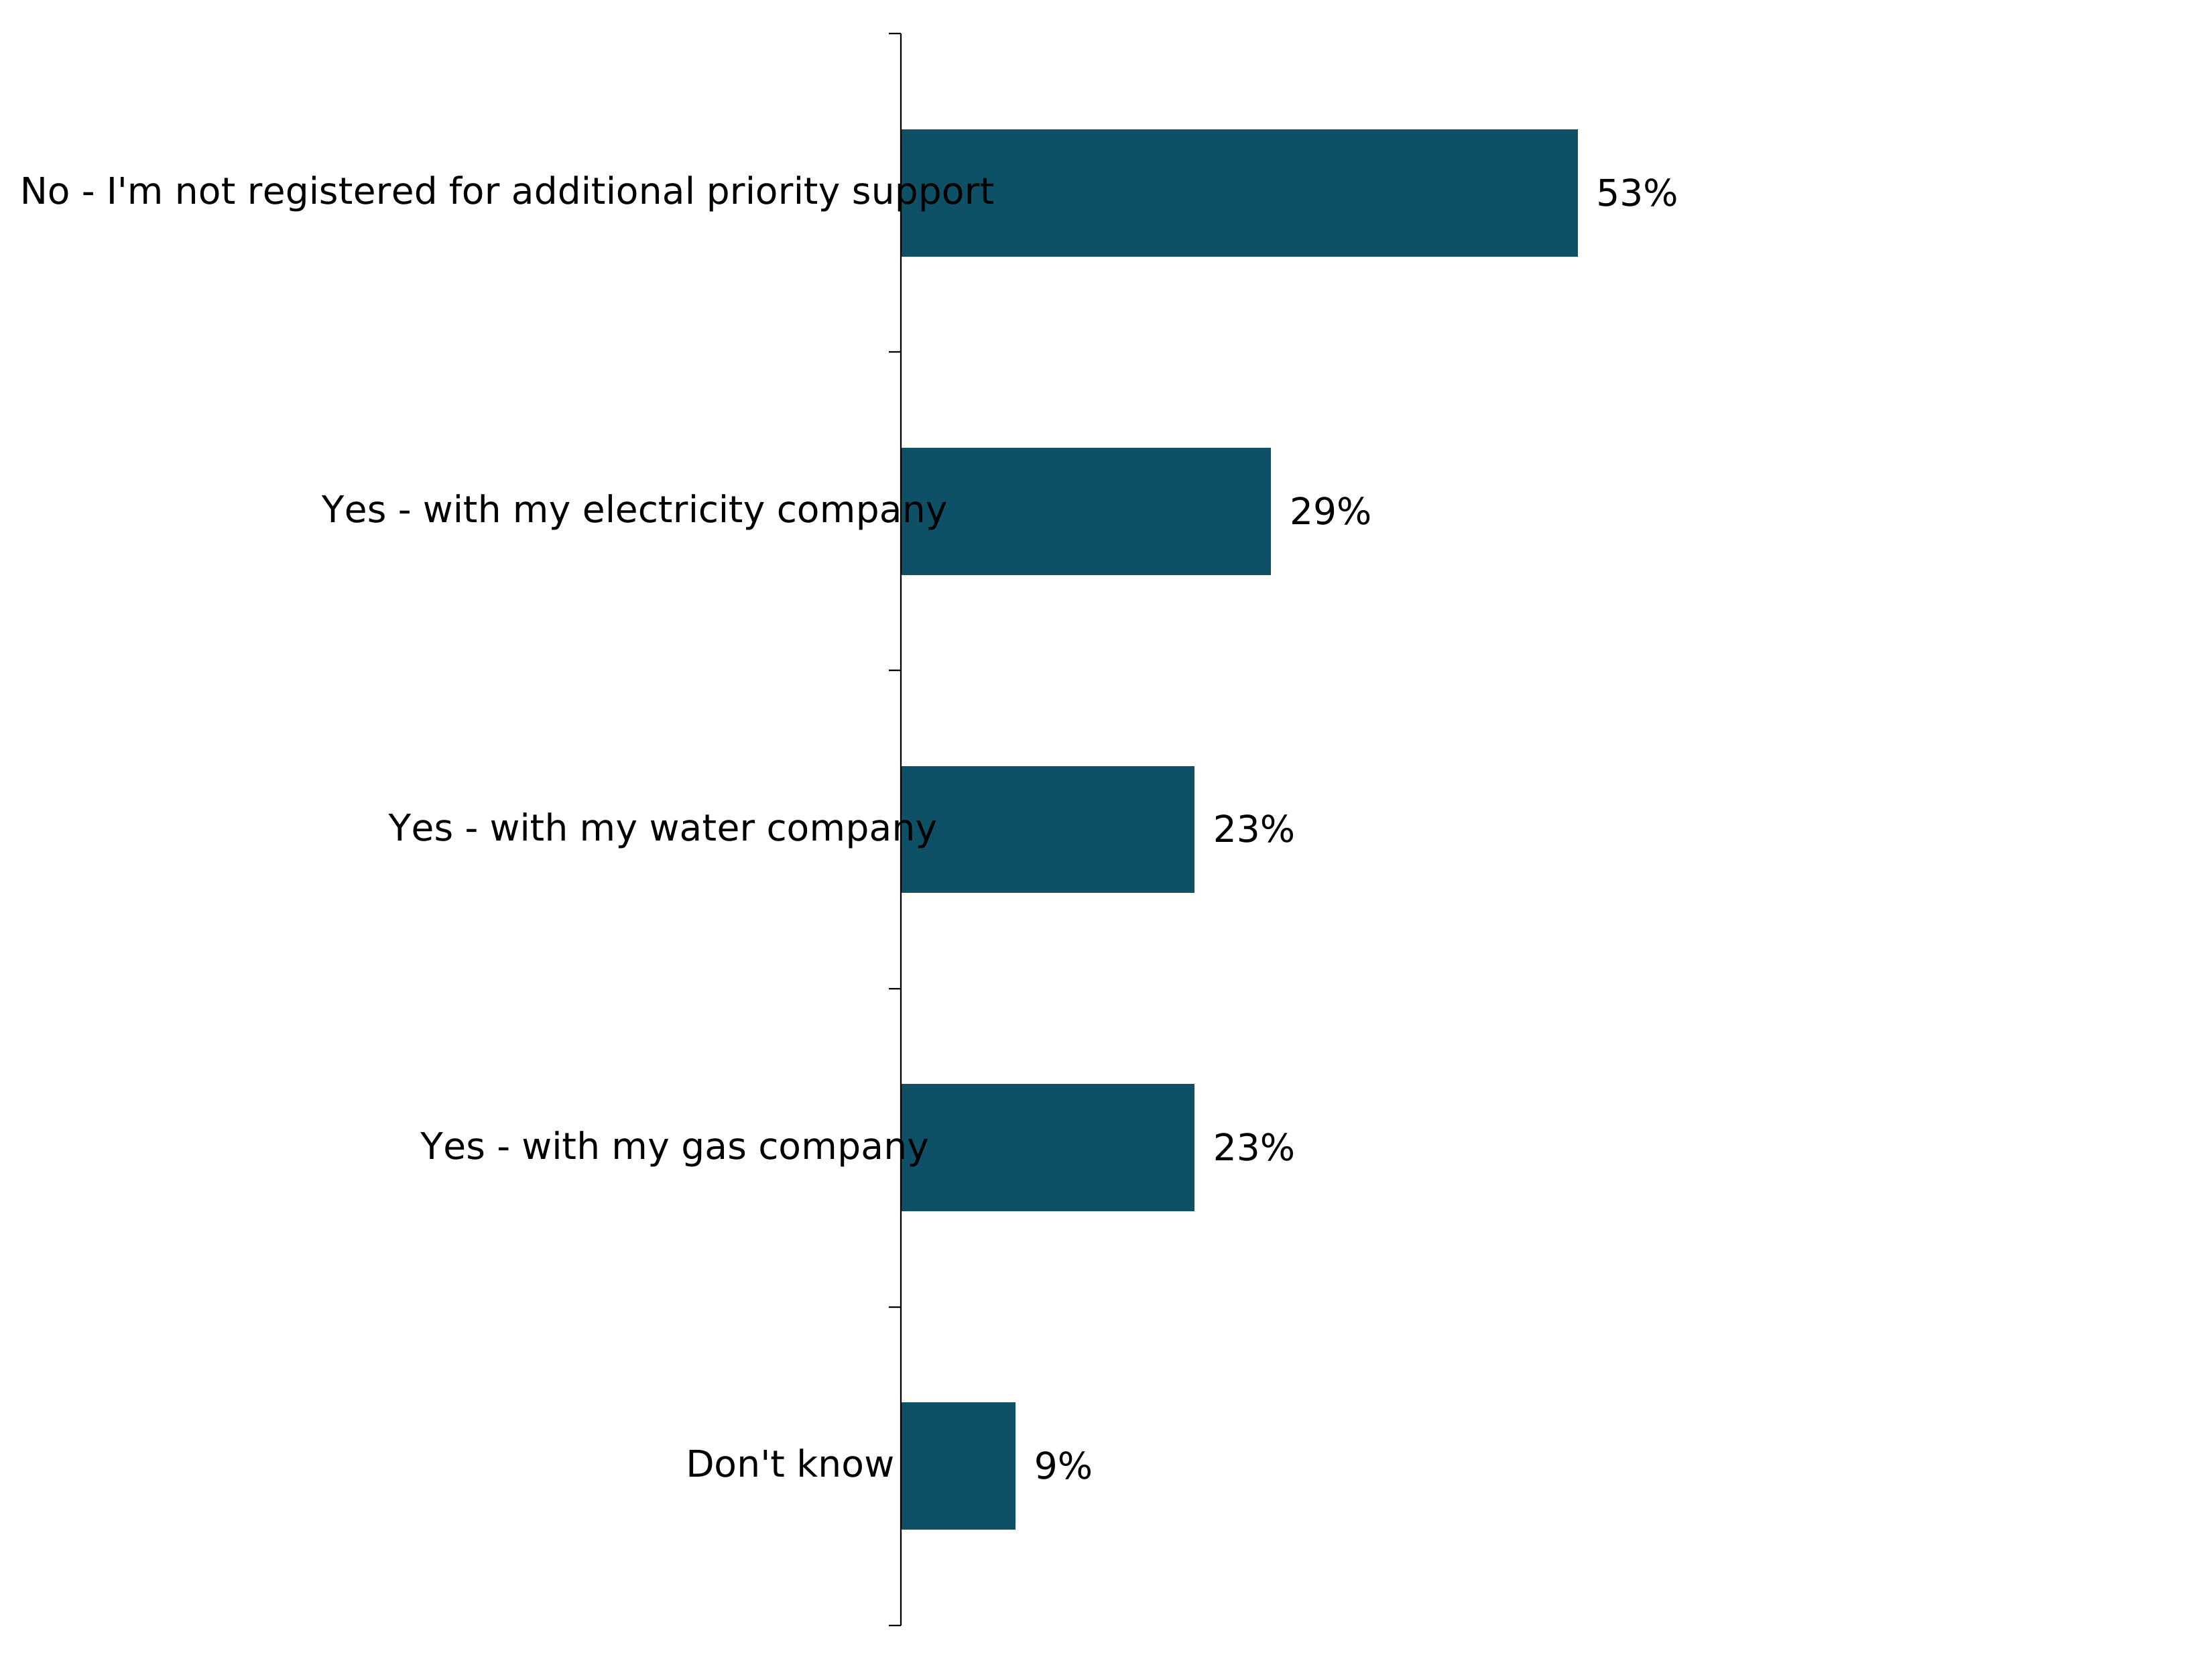
Data note:
Source: Q34_2026. Are you, or is anyone in your household, registered with any of the following utilities companies for additional priority support? This is called a Priority Services Register in England, Scotland and Wales and a Customer Care Register in Northern Ireland.
Base: All respondents in UK sample (n=10,791).
48% of survey respondents reported having a neighbour who they thought could need additional support from others during an emergency. 32% said they did not think they had any neighbours who could need this, 20% did not know if they had neighbours that could need support and 1% selected the option for ‘I do not have any neighbours’.
Compared to 2025, there was an increase in the proportion of respondents who thought they had neighbours who could need additional support during an emergency or disaster, rising seven percentage points from 42% to 48%. Correspondingly, the proportion who did not think they had such neighbours fell two percentage points (34% to 32%), and those who did not know fell four percentage points (24% to 20%).
Note: Support examples provided in the question included giving or lending supplies, shopping for food, passing on updates or simply checking in on them to see if they are OK.
Data note:
Source: Q35. Do you have any neighbours you think could need additional support from others during an emergency or disaster? This could include giving or lending supplies, shopping for food, passing on updates or simply checking in on them to see if they are OK.
Base: All respondents in UK sample (n=10,791).
41% of survey respondents reported providing a neighbour with additional support during a previous emergency, disaster or crisis (including the COVID-19 pandemic), 47% said they had not done this, 10% reported not knowing/remembering if they had, and 3% said that at that time they did not have any neighbours.
Compared to 2025, the proportion who reported having provided support to neighbours declined by one percentage point (42% to 41%), whilst those who reported not having done so remained unchanged (47%). The proportion who could not remember rose two percentage points (8% to 10%).
Note: Support examples provided in the question included giving or lending supplies, shopping for food, passing on updates or simply checking in on them to see if they are OK.
Data note:
Source: Q36. In a previous emergency, disaster, or crisis (including the COVID-19 pandemic) have you provided any of your neighbours with additional support? This could include giving or lending supplies, shopping for food, passing on updates or simply checking in on them to see if they are OK.
Base: All respondents in UK sample (n=10,791).
Development plan
Official statistics in development designation
Official statistics are regulated by the Office for Statistics Regulation (OSR). OSR sets the standards of trustworthiness, quality and value in the Code of Practice for Statistics that all producers of official statistics should adhere to. This publication is an official statistic in development.
Official statistics in development are official statistics that are undergoing a development; they may be new or existing statistics, and will be tested with users, in line with the standards of trustworthiness, quality, and value in the Code of Practice for Statistics.
Details of how we plan to develop these statistics are laid out below. We particularly welcome feedback from users on the survey items and presentation of the statistics set out in this release. The development of the statistics will be guided by feedback from users, while we also plan to address the areas mentioned below.
Summary of feedback for the 2025 survey
Following publication of the 2025 statistics, feedback was sought from users to inform the design of the 2026 questionnaire. A link to a short user feedback survey was included at the top of the headline findings report on GOV.UK. The user feedback survey was also sent via email to known users of the statistics such as communications professionals in Local Resilience Forums and relevant policy and communications teams in government departments. The questions covered thematic content (including suggestions for amendments), value add, accessibility of the charts, the level of detail in the technical report and any further suggestions or ideas for future iterations. A total of 27 users filled in the feedback survey between July and October 2025 and below is a brief summary of the feedback:
22 out of 25 respondents said the main reason they had viewed the results was because of their work, whereas 5 users said this was due to general/personal interest. 6 respondents were from a national government department or agency, 6 respondents were from a Local Resilience Forum, 6 were from a category 1 responder organisation, 2 were from local government, 2 were from a voluntary, community or faith sector organisation and 1 answered ‘other’ and gave ‘corporate’ as the type of organisation they worked for.
The majority (59%) of respondents said the results were useful or very useful for their work. 32% said they were somewhat useful and 9% (n=2) said they were not very useful. 52% said the survey results add value over and above existing research on this topic, 44% said they were nice to have but not essential, 1 respondent said they did not add additional value. 56% of respondents said they had either shared the results with someone else or were planning to, the remaining 44% had not.
On topic coverage, a third (33.3%) of respondents selected ‘the topics included are great and nothing else is needed’, 59% selected ‘the topics included are good but could cover other areas’, two respondents (7%) said ‘the topics do not cover many areas I’m interested in’ and no respondents selected ‘the topics do not cover any of the areas I’m interested in’.
In terms of suggestions for amendments, the ideas provided in the open text boxes were varied and each one unique with no clear themes emerging. Suggestions covered: evacuation and shelter, civil unrest, pandemic preparedness, understanding of capabilities and responsibilities of blue light response teams, expectations of government, conflict, healthcare reform, AI risk, alerts, enablers of resilient behaviours and small business preparedness.
When asked specifically whether charts with only three options should be included there were mixed views: 41% said they would be helpful, 37% said they were not needed and 22% said they did not mind either way. Only six respondents answered a question about whether they found the charts difficult to interpret. Five out of the six indicated they did not find them difficult to interpret and one respondent mentioned they had found the coloured bar chats slightly difficult to interpret. 78% thought there was sufficient detail in the technical report, 11% (n=3) wanted more detail and 11% (n=3) said they didn’t know or hadn’t read it. The two suggestions for more detail provided in the open text box regarding the technical report were a suggestion for open text boxes for the public survey respondents to add their own ideas about raising awareness of public preparedness, and for more information on how the results are being used to make decisions.
At the end of the survey respondents were asked for feedback on general areas of improvement. The comments covered more localised / Local Resilience Forum area data, more detailed questions and breakdowns for demographic groups.
In addition to the survey, feedback was gathered during user engagement sessions with resilience practitioners. A summary of the feedback from these sessions is presented below:
As with the user feedback survey, suggestions around adding new questions to the survey were often unique, reflecting the broad topics that make up risk perception, resilience and preparedness. The suggestions were most frequently about adding new questions to the existing topics, for example asking about barriers to volunteering or what would motivate people to volunteer in the future, or people’s views on different information sources. A few users asked for the addition of food supply disruption and radiation emergency to be added to the list of emergencies included in the risk perception questions, and for water purification tablets to be added as a preparedness item people could select. Some users suggested changing the period of water and power outages from 12 hours to 3 days to align with international standards.
For the question on perceived responsibility for preparing for emergencies, users indicated that the most useful parts of this question were ‘you’, local government and national government. For the question asking about whether people had acted on the advice in a previous Emergency Alert, some users felt this finding might be misrepresented without further explanation being sought from the respondent, as people might have not needed to act or had already acted before the Alert was received.
One user group was concerned about not including an income related to measure and wanted this added in addition to social grade. There were further suggestions on releasing the data down to a Local Resilience Forum area as well as the urban vs rural breakdowns.
A concern was raised about the lack of data collected on this topic from people who are digitally excluded and several requests were made for sociodemographic analyses to be published.
Changes made to the 2026 statistics in response to user feedback
Additional sociodemographic analyses of the 2025 data were released in April 2026. This was conducted by analysts in the UK Health Security Agency (UKHSA) Behavioural Science and Insights Unit to identify sociodemographic factors (gender, age, social grade, ethnicity, household factors and disability/chronic health conditions) that were associated with key outcomes related to preparedness, including attitudinal measures and behaviours.
Changes to questions in response to user feedback include:
- A new question was added related to income (INCOME).
- Additional postcode data was collected so that urban and rural areas could be captured (POSTCODE_2026)
- Food supply disruption and radiation release were included in the risk perception questions (perceived likelihood and perceived impact (Q2 and Q3)
- The power and water outage options in the risk perception questions were amended to include ‘3 days’ instead of ‘12 hours’ (Q2 and Q3).
- Water purification tablets were added to the list of supplies people might have (Q26).
- The options in the perceived responsibility for preparing question (Q9) were reduced.
- The question from last year about whether people had acted on Emergency Alerts was removed.
Additional data tables have been released that provide the survey results for each Local Resilience Forum (LRF) area in England. It is important to note that these results should just be seen as indicative and areas cannot be compared using this data.
User engagement ahead of 2027 survey
We would like to understand whether these statistics are valuable to users, and if there are any improvements we should make to them for future releases. We are interested in views on the content and on the presentation of the statistics.
Users can be involved in the development of this statistical series by completing this short survey. The survey is anonymous and we are not collecting any personal data as part of this exercise. The user feedback survey will close on 30th September 2026. We are keen to receive as many views on this as possible from individuals who plan to use, or have used, the statistics to inform their work or study.
Any feedback provided will help inform the future design and development of this statistical release. Thank you for your input.
We also plan to host discussion sessions with a selection of our primary users - national and local officials responsible for communicating with the public about risks and preparedness.
The outcomes of this user feedback and its impact on the development of the statistics will be published in 2027.
Timeline for development
The Cabinet Office will undertake this first phase of development, including user engagement, between August and November 2026 before finalising the 2027 version of the UK Public Survey of Risk Perception, Resilience and Preparedness. The user feedback survey will close on 30th September 2026 and discussion sessions with primary users will be completed in the Autumn.
Areas of improvement under consideration
Based on the analysis conducted so far, we are planning to develop these areas for the next statistical release to be published in 2027:
Although the average interview length in 2026 was 15 minutes 23 seconds, which was close to the agreed target, there may still be value in reviewing whether any questions are overlapping or could be simplified in order to reduce questionnaire length. In particular, the 2026 wave could be used to review the relationship between SEG and NS-SEC and agree which measure should be used for social grade going forward, with a view to keeping one approach. It may also be worth considering whether the NS-SEC question could be streamlined, and whether any reduction in complexity might help improve the respondent experience particularly for groups that were harder to recruit.
Analysis of exit pages suggests that the points with dropout rates above 2% were concentrated largely in the early part of the questionnaire (see Table 1.1), rather than in the later preparedness sections. This suggests there may be value in reviewing the introduction, profiling questions and postcode-related processes. In particular, it may be worth looking more closely at intro1, where a 10-second timer was used alongside a relatively long block of text. This may have contributed to the high level of dropout at that stage and should be reviewed to get the balance right between allowing respondents enough time to read the information and avoiding unnecessary drop-off.
Table 1.1. Number of participants that exited the survey per page
| Exit Page | Counts |
|---|---|
| Intro1 | 866 |
| POSTCODE | 277 |
| HOUSEHOLD_2026 | 146 |
| MEDICATION | 121 |
| PCLookupValues | 106 |
| SEX | 86 |
| Profiling1 | 83 |
The survey remained open for longer than expected as there were some challenges around filling some of the quotas. This included some nation-level quotas, 75+ age groups, parts of the ethnicity quota structure such as Asian and Other groups and the non-degree side of the education quota. There was also a need to rebalance parts of the sample in Northern Ireland during fieldwork. We will discuss with Savanta if there is anything that can be done to address these issues and shorten the data collection period.
Online surveys exclude adults who do not have regular access to, or confidence using, the internet. We are exploring options for collecting data from a digitally excluded sample of the UK population. Due to the high costs associated with this type of data collection, this would be planned as a standalone research project to supplement the 2027 survey.
-
The quotas used in this survey ensure that the sample recruited reflects the population of each constituent country, with a focus on those demographics which are most likely to have an association with peoples’ attitudes. Northern Ireland differs from the rest of the United Kingdom in that being Protestant or Catholic, whether by personal religiosity or by heritage, is strongly correlated with a number of other social and political attitudes, a result of the region’s distinctive history. ↩