Soil nutrient balances England, 2022 - statistics notice
Updated 1 March 2024

© Crown copyright 2024
This publication is licensed under the terms of the Open Government Licence v3.0 except where otherwise stated. To view this licence, visit nationalarchives.gov.uk/doc/open-government-licence/version/3 or write to the Information Policy Team, The National Archives, Kew, London TW9 4DU, or email: psi@nationalarchives.gov.uk.
Where we have identified any third party copyright information you will need to obtain permission from the copyright holders concerned.
This publication is available at https://www.gov.uk/government/statistics/uk-and-england-soil-nutrient-balances-2022/soil-nutrient-balances-england-2022-statistics-notice
Soil nutrient balances provide a method for estimating the annual nutrient loadings of nitrogen and phosphorus to agricultural soils. They give an indication of the potential risk associated with losses of nutrients to the environment; losses which can impact on air and water quality and on climate change. The nutrient balances are used as a high-level indicator of farming’s pressure on the environment and of how that pressure is changing over time. The balances do not estimate the actual losses of nutrients to the environment, but significant nutrient surpluses are directly linked with losses to the environment.
Nutrient balances are of direct relevance to policies relating to agriculture and the environment including climate change, air quality, water quality, and habitats and biodiversity.
Note: This statistics release was revised in December 2023 to make the 2022 estimates for ‘inorganic fertiliser’ consistent with the British Survey of Fertiliser Practice (BSFP). More information about this revision can be found in section 3.2 below.
Key messages
-
Estimates for 2022 show that the England nitrogen balance was a surplus of 74.4 kg/ha of managed agricultural land. This represented a decrease of 13.5 kg/ha (-15.3%) compared to 2021, and a decrease of 30.0 kg/ha (-28.8%) compared to 2000.
-
Estimates for 2022 show that the England phosphorus balance was a surplus of 0.5 kg/ha of managed agricultural land. This represented a decrease of 3.0 kg/ha (-87.0%) compared to 2021, and a decrease of 8.0 kg/ha (-94.6%) compared to 2000.
-
The 2022 estimate for the England phosphorus balance was the lowest since the annual time series began in 2000. The 2022 estimate for the England nitrogen balance was the lowest since the annual time series began in 2000 in tonnage terms, but not on a per hectare basis due to changes in farmed areas. The low balances were driven by record low inputs from inorganic fertilisers, likely to be a response to high purchase prices.
1. England nitrogen balance
Figure 1. Summary of nitrogen balance for England, 2000 to 2022 (kg N per hectare of managed agricultural land)
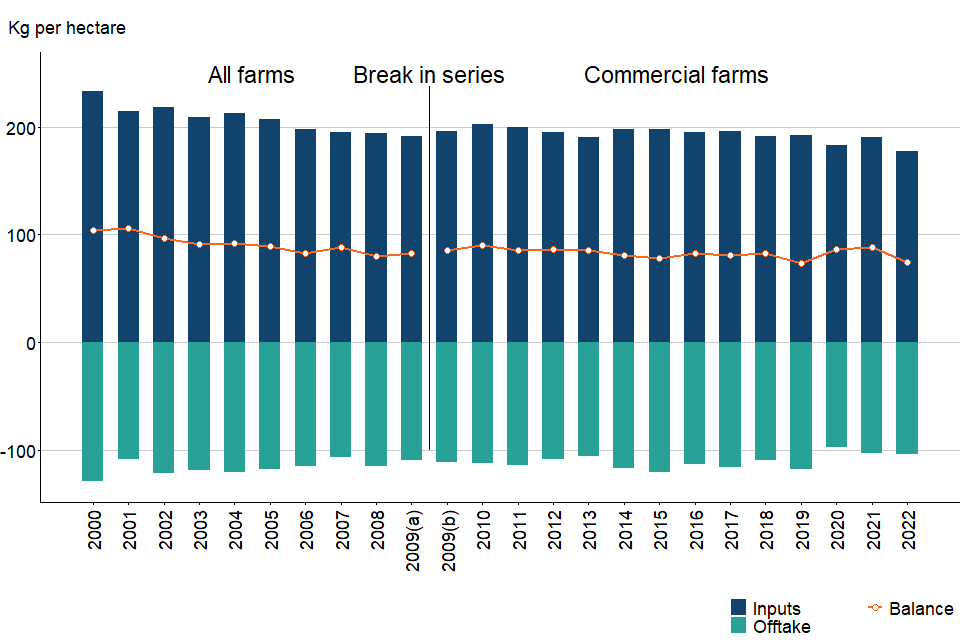
(a) Estimates for 2009 have been produced using June Survey data representing both ‘all farms’ (a) and only ‘commercial farms’ (b).
For the period 2021 to 2022 the key points are:
The overall England nitrogen balance in 2022 was a surplus of 74.4 kg/ha, which represented a decrease of 13.5 kg/ha (-15.3%) compared to 2021.
This was driven by a decrease in Total Inputs of 12.6 kg/ha (-6.6%) (mainly from reduced use of inorganic manufactured fertiliser) coupled with an increase in Total Offtake of 0.9 kg/ha (+0.9%) (mainly from increased cereal and oil crop production) over the same period.
Farmers cut back on the application of inorganic manufactured fertiliser, likely as a result of extremely high prices. Further details can be found in the 2022 British Survey of Fertiliser Practice report (https://www.gov.uk/government/collections/fertiliser-usage). Production of wheat, winter barley and oilseed rape were all up in 2022, but estimated Total Offtake from crops was still lower than any year in the period 2014-19.
For the period 2000 to 2022 the key points are:
The overall England nitrogen balance remained in surplus throughout the period but decreased by 30.0 kg/ha (-28.8%) from 104.5 kg/ha in 2000 to 74.4 kg/ha in 2022.
The 2022 estimate for the England nitrogen balance was the lowest since the annual time series began in 2000 in tonnage terms, but not on a per hectare basis due to changes in farmed areas.
Over this time, Total Inputs of nitrogen decreased by 55.8 kg/ha (-23.9%), which more than offset a decrease in Total Offtake of 25.8 kg/ha (-20.0%).
The main drivers behind the decrease in Total Inputs of nitrogen were reductions in the application of both inorganic manufactured fertiliser and cattle manure.
The main driver behind the decrease in Total Offtake of nitrogen was a decrease in pasture consumption due to a reduction in the number of grazing livestock.
The series break in 2009 is due to changes in the population of farms used for the June Survey of Agriculture and Horticulture, which provided much of the underlying data used to calculate these estimates.
Table 1.1. Nitrogen balance for England, 2000, 2021 and 2022 (kg N per hectare of managed agricultural land)
| Item | 2000 | 2021 | 2022 | Change 2021-2022 | Change 2000-2022 | % Change 2021-2022 | % Change 2000-2022 |
|---|---|---|---|---|---|---|---|
| Total Inputs | 233.3 | 190.1 | 177.5 | -12.6 | -55.8 | -6.6% | -23.9% |
| Total Offtake | 128.8 | 102.1 | 103.1 | +0.9 | -25.8 | +0.9% | -20.0% |
| Nutrient Balance (Inputs minus offtake) | 104.5 | 87.9 | 74.4 | -13.5 | -30.0 | -15.3% | -28.8% |
(a) Managed agricultural land excludes rough grazing. (b) Changes have been computed on unrounded figures.
Table 1.2. Detailed nitrogen balance sheet for England, 2000, 2021 and 2022 (thousand tonnes of N)
| Item | 2000 | 2021 | 2022 | Change 2021-2022 | Change 2000-2022 | % Change 2021-2022 | % Change 2000-2022 |
|---|---|---|---|---|---|---|---|
| Total Inputs | 1,862 | 1,519 | 1,440 | -79 | -422 | -5% | -23% |
| Fertilisers | 938 | 771 | 682 | -89 | -256 | -11% | -27% |
| Inorganic Fertilisers | 910 | 720 | 631 | -89 | -279 | -12% | -31% |
| Total Organic Fertilisers (excluding livestock manure) | 28 | 51 | 52 | +1 | +23 | +1% | +82% |
| Net Input of Manure | 680 | 549 | 547 | -2 | -133 | 0% | -20% |
| Livestock Manure Production | 697 | 563 | 560 | -3 | -137 | -1% | -20% |
| Cattle | 439 | 343 | 343 | +1 | -95 | +0% | -22% |
| Pigs | 62 | 46 | 44 | -2 | -18 | -4% | -29% |
| Sheep and Goats | 101 | 78 | 79 | +1 | -22 | +1% | -22% |
| Poultry | 91 | 92 | 90 | -2 | -1 | -2% | -1% |
| Other Livestock | 6 | 4 | 4 | 0 | -2 | -9% | -36% |
| Manure Not Spread on Land | -17 | -14 | -13 | +1 | +4 | -10% | -23% |
| Other Inputs | 244 | 200 | 211 | +11 | -33 | +6% | -13% |
| Atmospheric Deposition | 126 | 70 | 74 | +4 | -52 | +6% | -41% |
| Biological Fixation (only applicable to N) | 109 | 122 | 129 | +7 | +20 | +6% | +18% |
| Seeds and Planting Material | 9 | 8 | 8 | +0 | -1 | +5% | -9% |
| Total Offtake | 1,029 | 817 | 836 | +20 | -192 | +2% | -19% |
| Total Harvested Crops | 496 | 418 | 436 | +18 | -60 | +4% | -12% |
| Cereals | 398 | 325 | 340 | +15 | -57 | +5% | -14% |
| Oil crops | 32 | 28 | 38 | +10 | +5 | +35% | +16% |
| Pulses and Beans | 29 | 35 | 31 | -4 | +2 | -10% | +8% |
| Industrial Crops | 15 | 13 | 10 | -2 | -5 | -19% | -34% |
| Other Crops | 22 | 18 | 17 | -1 | -5 | -7% | -23% |
| Total Forage | 491 | 358 | 362 | +4 | -129 | +1% | -26% |
| Harvested Fodder Crops | 17 | 37 | 35 | -2 | +18 | -4% | +103% |
| Pasture | 474 | 321 | 327 | +5 | -147 | +2% | -31% |
| Crop Residues | 42 | 40 | 39 | -1 | -3 | -3% | -8% |
| Nutrient Balance (Inputs Minus Offtake) | 834 | 703 | 604 | -99 | -230 | -14% | -28% |
(a) Changes have been computed on unrounded figures.
2. England Phosphorus Balance
Figure 2. Summary of Phosphorus balance for England, 2000 to 2022 (kg P per hectare of managed agricultural land)
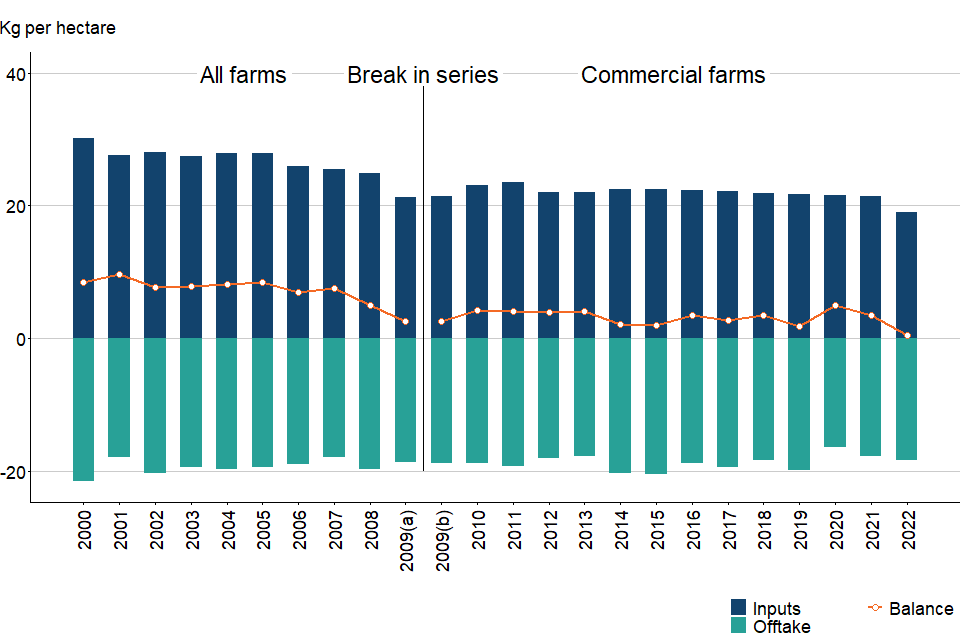
(a) Estimates for 2009 have been produced using June Survey data representing both ‘all farms’ (a) and only ‘commercial farms’ (b).
For the period 2021 to 2022 the key points are:
The overall England phosphorus balance in 2022 was a surplus of 0.5 kg/ha, which represented a decrease of 3.0 kg/ha (-87.0%) compared to 2021.
This was driven by a decrease in Total Inputs of phosphorus of 2.4 kg/ha (-11.3%) (mainly from reduced use of inorganic manufactured fertiliser) coupled with an increase in Total Offtake of 0.6 kg/ha (+3.5%) (mainly from increased cereal and oil crop production) over the same period.
Farmers cut back on the application of inorganic manufactured fertiliser, likely as a result of extremely high prices. Further details can be found in the 2022 British Survey of Fertiliser Practice report. Production of wheat, winter barley and oilseed rape were all up in 2022 and there was also a small increase in the estimated offtake of phosphorus due to pasture consumption by grazing livestock.
For the period 2000 to 2022 the key points are:
The overall England phosphorus balance remained in surplus throughout the period but decreased by 8.0 kg/ha (-94.6%) from 8.4 kg/ha in 2000 to 0.5 kg/ha in 2022.
The 2022 estimate for the England phosphorus balance was the lowest since the annual time series began in 2000.
Over this time, Total Inputs of Phosphorus decreased by 11.2 kg/ha (-37.1%), which more than offset a decrease in Total Offtake of 3.2 kg/ha (-14.7%).
As with nitrogen, the main drivers behind the decrease in Total Inputs of phosphorus were reductions in the application of both inorganic manufactured fertiliser and cattle manure.
The main driver behind the decrease in Total Offtake of phosphorus was a decrease in pasture consumption due to a reduction in the number of grazing livestock.
The series break in 2009 is due to changes in the population of farms used for the June Survey of Agriculture and Horticulture, which provided much of the underlying data used to calculate these estimates.
Table 2.1. Phosphorus balance for England, 2000, 2021 and 2022 (kg P per hectare of managed agricultural land)
| Item | 2000 | 2021 | 2022 | Change 2021-2022 | Change 2000-2022 | % Change 2021-2022 | % Change 2000-2022 |
|---|---|---|---|---|---|---|---|
| Total Inputs | 30.1 | 21.3 | 18.9 | -2.4 | -11.2 | -11.3% | -37.1% |
| Total Offtake | 21.6 | 17.8 | 18.5 | +0.6 | -3.2 | +3.5% | -14.7% |
| Nutrient Balance (Inputs minus offtake) | 8.4 | 3.5 | 0.5 | -3.0 | -8.0 | -87.0% | -94.6% |
(a) Managed agricultural land excludes rough grazing. (b) Changes have been computed on unrounded figures.
Table 2.2. Detailed phosphorus balance sheet for England, 2000, 2021 and 2022 (thousand tonnes of P)
| Item | 2000 | 2021 | 2022 | Change 2021-2022 | Change 2000-2022 | % Change 2021-2022 | % Change 2000-2022 |
|---|---|---|---|---|---|---|---|
| Total Inputs | 240 | 171 | 154 | -17 | -87 | -10% | -36% |
| Fertilisers | 115 | 68 | 52 | -16 | -63 | -24% | -55% |
| Inorganic Fertilisers | 97 | 47 | 30 | -17 | -67 | -36% | -69% |
| Total Organic Fertilisers (excluding livestock manure) | 18 | 22 | 22 | +0 | +4 | +1% | +23% |
| Net Input of Manure | 121 | 98 | 97 | -1 | -24 | -1% | -20% |
| Livestock Manure Production | 121 | 98 | 97 | -1 | -24 | -1% | -20% |
| Cattle | 69 | 54 | 54 | +0 | -15 | +0% | -22% |
| Pigs | 12 | 9 | 9 | 0 | -4 | -5% | -30% |
| Sheep and Goats | 16 | 12 | 12 | +0 | -3 | +1% | -22% |
| Poultry | 22 | 22 | 22 | 0 | 0 | -2% | -2% |
| Other Livestock | 2 | 1 | 1 | 0 | -1 | -9% | -37% |
| Manure Not Spread on Land | 0 | 0 | 0 | NA | NA | NA | NA |
| Other Inputs | 5 | 4 | 5 | +0 | +0 | +5% | +1% |
| Atmospheric Deposition | 3 | 3 | 3 | +0 | +0 | +6% | +7% |
| Biological Fixation (only applicable to N) | NA | NA | NA | NA | NA | NA | NA |
| Seeds and Planting Material | 2 | 1 | 2 | +0 | 0 | +4% | -9% |
| Total Offtake | 173 | 143 | 150 | +7 | -23 | +5% | -13% |
| Total Harvested Crops | 87 | 80 | 86 | +6 | -1 | +8% | -1% |
| Cereals | 70 | 64 | 70 | +5 | -1 | +8% | -1% |
| Oil crops | 7 | 6 | 8 | +2 | +1 | +36% | +16% |
| Pulses and Beans | 3 | 4 | 4 | 0 | +0 | -10% | +9% |
| Industrial Crops | 3 | 3 | 2 | 0 | -1 | -19% | -34% |
| Other Crops | 3 | 3 | 3 | 0 | -1 | -7% | -19% |
| Total Forage | 79 | 56 | 57 | +1 | -21 | +2% | -27% |
| Harvested Fodder Crops | 3 | 7 | 6 | 0 | +3 | -5% | +103% |
| Pasture | 76 | 49 | 51 | +1 | -25 | +3% | -33% |
| Crop Residues | 7 | 7 | 7 | 0 | -1 | -3% | -8% |
| Nutrient Balance (Inputs Minus Offtake) | 67 | 28 | 4 | -24 | -64 | -87% | -95% |
(a) Changes have been computed on unrounded figures.
3. What you need to know about this release
3.1. Contact details
Responsible statistician: Robin Karfoot
Email address: agri.environmentstatistics@defra.gov.uk
Enquiries: 02080 266449
For media queries between 9am and 6pm on weekdays: • Telephone: 0330 041 6560 • newsdesk@defra.gov.uk (monitored 9am to 6pm on weekdays)
Department for Environment, Food and Rural Affairs Floor 3, Mallard House 1-2 Peasholme Green York YO1 7PX
3.2. Revisions
This statistics release was revised in December 2023 to amend the original 2022 estimates (published on 30 November 2023), to make them consistent with the British Survey of Fertiliser Practice (BSFP). This led to a reduction in the estimated volumes of ‘inorganic fertiliser’ for both nitrogen and phosphorus, which resulted in associated reductions in the estimates for ‘Total inputs’ and the overall nutrients balances. No changes have been made to offtake estimates.
| Nutrient | Metric | Units | 2022 estimate published 30/11/2023 | 2022 Revised estimate | Nominal difference (revised - original) | % difference (revised - original) |
|---|---|---|---|---|---|---|
| Nitrogen | Inorganic fertilisers | Kt | 686.6 | 630.6 | -56.1 | -8.2% |
| Nitrogen | TOTAL INPUTS | Kt | 1,496.3 | 1,440.2 | -56.1 | -3.7% |
| Nitrogen | TOTAL OFFTAKE | Kt | 836.3 | 836.3 | 0.0 | 0.0% |
| Nitrogen | BALANCE (Inputs minus Offtake) | Kt | 660.0 | 603.9 | -56.1 | -8.5% |
| Phosphorus | Inorganic fertilisers | Kt | 33.1 | 29.8 | -3.2 | -9.8% |
| Phosphorus | TOTAL INPUTS | Kt | 156.8 | 153.5 | -3.2 | -2.1% |
| Phosphorus | TOTAL OFFTAKE | Kt | 149.9 | 149.9 | 0.0 | 0.0% |
| Phosphorus | BALANCE (Inputs minus Offtake) | Kt | 6.9 | 3.7 | -3.2 | -46.8% |
3.3. Official Statistics status
Our statistical practice is regulated by the Office for Statistics Regulation (OSR). OSR sets the standards of trustworthiness, quality and value in the Code of Practice for Statistics that all producers of official statistics should adhere to. You can read about how Official Statistics in Defra comply with these standards on the ‘Statistics at Defra’ website on GOV.UK.
4. Background and methodology
4.1. Background
Soil nutrient balances provide a method for estimating the nutrient loadings of nitrogen and phosphorus to managed agricultural soils. Whilst a shortage of nutrients can limit the productivity of agricultural soils, a surplus of these nutrients poses a serious environmental risk. Losses of nutrients to the environment can impact on air quality (ammonia emissions), water quality (nitrate and phosphate levels in rivers) and climate change (nitrous oxide emissions). A soil nutrient balance estimate, expressed as a loading of nitrogen or phosphorus per hectare of managed agricultural land can be used as an indicator of the environmental risks. It provides a high level measure which can be used to monitor long term trends and to make meaningful comparisons between countries.
4.2. Methodology
A methodology for calculating soil nutrient balances has been developed by OECD (Organisation for Economic Cooperation and Development). Although based on an internationally recognised methodology, the nutrient balance estimates are subject to a level of uncertainty or error margins. The approach attempts to capture the full range of nutrient inputs and removals to soils from all sources. The input sources are: manures, mineral fertilisers, atmospheric deposition and biological fixation. The offtake outlets are: crop production and fodder production for livestock, including grazing. The nutrient input or offtake from each source is either estimated directly (atmospheric deposition) or calculated by applying a coefficient (e.g. for the amount of nitrogen that a dairy cow produces each year) to the corresponding physical data characteristic (e.g. number of dairy cows). The relevant coefficients are derived from research and the physical data is taken from a wide range of data sources many of which are already published as official statistics.
4.3. UK approach
The estimates within this statistics release are based methodology proposed by ADAS in a 2010 Defra funded project. This project was, in turn, based on existing OECD methodology. Minor modifications have since been made by Defra, however most of the original 2010 coefficients (principally relating to N and P content of various agricultural inputs and outputs) are still in use.
The estimates presented in this statistics release are underpinned by annual data from the June Survey of Agriculture and Horticulture (‘June Survey’). From 2010 in England, June Survey data was collected only for ‘commercial’ farms. For 1990 to 2008, June Survey data represented a larger population. For comparability, data for 2009 have been presented on both the definition used for 2000 to 2008 and that used from 2010 onwards. A full time series can be found in the accompanying datasets.
Managed agricultural land has been defined as the utilised agricultural area (UAA) excluding common land and sole right rough grazing. The balance per hectare is based on the area of managed agricultural land. This is based on the approximation that this is the only land to which significant levels of fertilisers and manures are applied. We are currently investigating potential methodological improvements to recognise changes to UK agricultural systems since the original methodology was devised. The 2021 data release (22 December 2022) included an adjustment to the estimate for the removal of straw, which resulted in an increase to the ‘Crop residues’ offtake component. The time series was backdated with the adjustment applied to all years for which data is published.
4.4. Future publications
Information on future publications can be found under ‘Our Portfolio’ on the ‘Statistics at Defra’ website on GOV.UK.
5. Glossary
| Term | Definition |
|---|---|
| Nutrients | The key macro-nutrients required for crop growth which are nitrogen and phosphorus. |
| Inputs | The total amount of inputs of each nutrient to the soil. This can be through application of mineral fertilisers or organic manures, atmospheric deposition or biological fixation. |
| Offtake | The total amount of nutrients removed from the soil by the growth of crops, which are either harvested or grazed by livestock. |
| Nutrient balance | The difference between the inputs and the offtake for each nutrient. |
| Loading | Another term for the balance, conveying that this is the total net amount being loaded onto the soil over a year. |
| Surplus | If the annual inputs exceed the offtake the net balance represents a surplus of the nutrient. This surplus represents an environmental risk as it can be lost from the soil to the air or water courses. |
| Deficit | If the annual inputs are less than the offtake the net balance represents a deficit of the nutrient and hence the crop growth requirements will not have been met. |
| Atmospheric Deposition | The process by which nitrogen in the atmosphere is transferred into soils. |
| Biological Fixation | The process by which nitrogen in the atmosphere is incorporated into the tissues of plants and crops. |