Travel time measures for local 'A' roads: April 2025 to March 2026 report
Published 6 August 2026
Applies to England, Scotland and Wales

© Crown copyright 2026
This publication is licensed under the terms of the Open Government Licence v3.0 except where otherwise stated. To view this licence, visit nationalarchives.gov.uk/doc/open-government-licence/version/3 or write to the Information Policy Team, The National Archives, Kew, London TW9 4DU, or email: psi@nationalarchives.gov.uk.
Where we have identified any third party copyright information you will need to obtain permission from the copyright holders concerned.
This publication is available at https://www.gov.uk/government/statistics/travel-time-measures-for-the-strategic-road-network-england-and-local-a-roads-great-britain-april-2025-to-march-2026/travel-time-measures-for-local-a-roads-april-2025-to-march-2026-report
About this release
This statistical release presents information on travel times on Local Highway Authority managed “A” roads in Great Britain.
In line with the importance of coherence and comparable statistics, this series has been expanded from England only to provide statistics for England, Scotland and Wales and headline statistics for Great Britain from January 2025 onwards.
The measures in this release are estimated using in-vehicle Global Positioning Systems (GPS) observations.
In addition to this release, a separate set of data tables covering statistics on the Strategic Road Network (SRN) in England are available. Due to methodology differences between the local A road and SRN data these are not directly comparable, see the methodology and technicalsection for further details. Please note the geographical coverage of the SRN is England only.
This publication includes both accredited official statistics [footnote 1] and official statistics. For more information, see the About these statistics section.
Definitions of key terminology can be found in the glossary.
Notes on the methodology and sample
There has been a step change in congestion statistics due to changes in the underlying vehicle sample for the local ‘A’ roads data across Great Britain from April 2025. The change in the sample is not consistent across the country. The areas with the largest changes in sample have shown the largest changes in average speed and delay.
Further information about the impact of this change in sample can be found in the Methodology Note.
1. Headline Statistics
1.1 Great Britain
On local ‘A’ roads in Great Britain for the year ending March 2026, the average speed was 24.6 miles per hour (mph).
The average delay on local ‘A’ roads in Great Britain for the year ending March 2026 was 43.4 seconds per vehicle per mile (spvpm).
1.2 England
On local ‘A’ roads in England for the year ending March 2026, the average speed was 24.3 miles per hour (mph).
The average delay on local ‘A’ roads for the year ending March 2026 was 44.5 seconds per vehicle per mile (spvpm).
1.3 Scotland
On local ‘A’ roads in Scotland for the year ending March 2026, the average speed was 26.5 miles per hour (mph).
The average delay on local ‘A’ roads in Scotland for the year ending March 2026 was 36.8 seconds per vehicle per mile (spvpm).
1.4 Wales
On local ‘A’ roads in Wales for the year ending March 2026, the average speed was 26.7 miles per hour (mph).
The average delay on local ‘A’ roads in Wales for the year ending March 2026 was 34.6 seconds per vehicle per mile (spvpm).
2. National Overview
This section presents average speed and delay values for Great Britain and the constituent countries from April 2025 to March 2026.
2.1 Speed
The average speed on Local ‘A’ roads for Great Britain for the year ending March 2026 was estimated to be 24.6 mph. For the constituent countries in Great Britain, the average speed on local ‘A’ roads for the year ending March 2026 was 24.3 mph in England, 26.5 mph in Scotland, and 26.7 mph in Wales.
Chart 1: Average speed on Local ‘A’ roads in Great Britain, and the constituent countries (Table CGN0505b)
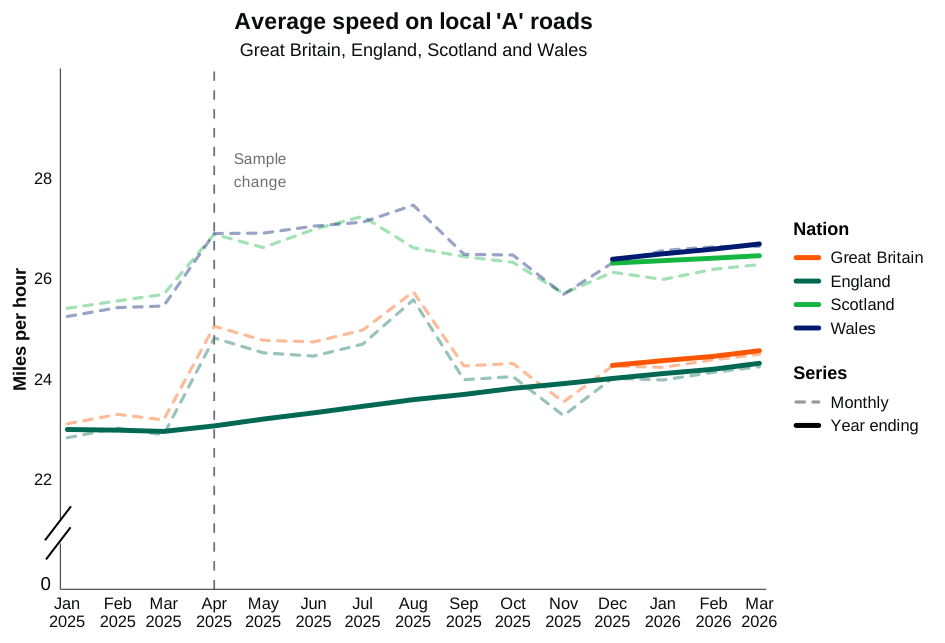
Table 1: Average speed on local ‘A’ roads in Great Britain (Table CGN0505b)
| Nation | Year ending March 2026 | Year Ending December 2025 |
|---|---|---|
| Great Britain | 24.6 | 24.3 |
| England | 24.3 | 24.0 |
| Scotland | 26.5 | 26.3 |
| Wales | 26.7 | 26.4 |
2.2 Delay
The average delay on Local ‘A’ roads for Great Britain for the year ending March 2026 was estimated to be 43.4 spvpm. For the constituent countries in Great Britain, the average delay on local ‘A’ roads for the year ending March 2026 was 44.5 spvpm in England, 36.8 spvpm in Scotland, and 34.6 spvpm in Wales.
Chart 2: Average delay on local ‘A’ roads in Great Britain (Table CGN0506b)
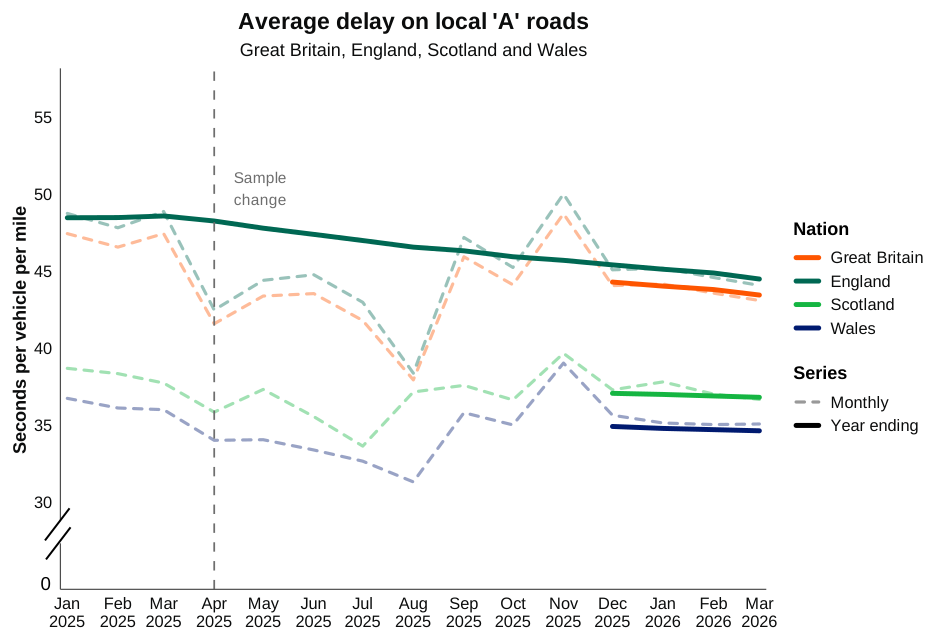
Table 2: Average delay on local ‘A’ roads in Great Britain (Table CGN0506b)
| Nation | Year ending March 2026 | Year Ending December 2025 |
|---|---|---|
| Great Britain | 43.4 | 44.3 |
| England | 44.5 | 45.4 |
| Scotland | 36.8 | 37.1 |
| Wales | 34.6 | 34.9 |
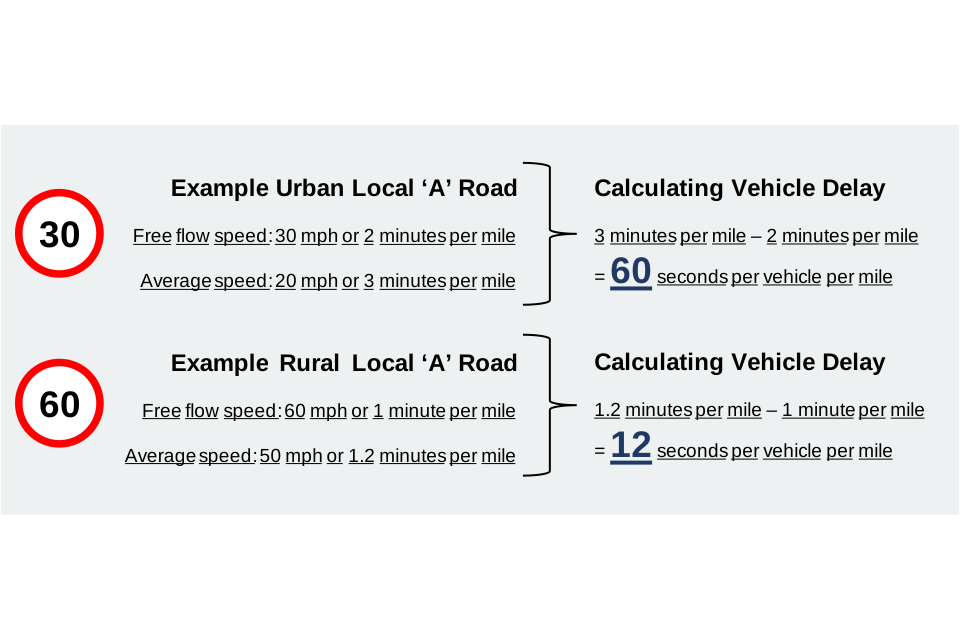
It is important to note that delay is affected by free flow speeds. As a result, a fixed absolute decrease in observed speeds will translate into a higher level of delay with a low free flow speed relative to those with a high free flow speed. An example of this is illustrated in Infographic 1.
Infographic 1: Illustrative example of average of delay
3. Peak Times Breakdown
This section contains average speed and delay values for all of Great Britain for the year ending March 2026, split across the following time periods:
-
Weekday Morning Peak – 7am to 10am Monday to Friday
-
Weekday Inter Peak – 10am to 4pm Monday to Friday
-
Weekday Evening Peak – 4pm to 7pm Monday to Friday
-
Weekday Off Peak – 7pm to 7am Monday to Friday
In general, the lowest speeds and highest delay values are observed in the morning and evening peak periods.
3.1 Speed
Average speed split by time period for the year ending March 2026 is given in Table 3 below:
Table 3: Average speed on local ‘A’ roads for the year ending March 2026 split by time period (Table CGN0505b)
| Nation | Weekday Morning Peak | Weekday Inter Peak | Weekday Evening Peak | Weekday Off Peak |
|---|---|---|---|---|
| Great Britain | 23.3 | 23.9 | 22.1 | 29.7 |
| England | 23.0 | 23.6 | 21.8 | 29.5 |
| Scotland | 26.0 | 25.5 | 24.7 | 30.6 |
| Wales | 25.8 | 25.7 | 24.9 | 31.2 |
3.2 Delay
Average delay split by time period is given in the Table 4 below:
Table 4: Average delay on local ‘A’ roads for the year ending March 2026 split by time period (Table CGN0506b)
| Nation | Weekday Morning Peak | Weekday Inter Peak | Weekday Evening Peak | Weekday Off Peak |
|---|---|---|---|---|
| Great Britain | 50.9 | 47.3 | 59.3 | 19.3 |
| England | 52.6 | 48.2 | 61.2 | 19.4 |
| Scotland | 38.9 | 41.7 | 46.3 | 19.7 |
| Wales | 38.8 | 39.5 | 43.9 | 17.0 |
4. Urban/Rural Split
This section contains average speed and delay values for Great Britain for the year ending March 2026, split between urban and rural roads.
4.1 Speed
Average speed split by urban and rural is given in the Table 5 below:
Table 5: Average speed on local ‘A’ roads for the year ending March 2026 split by urban and rural (Table CGN0506b)
| Nation | Urban | Rural |
|---|---|---|
| Great Britain | 17.6 | 34.4 |
| England | 17.4 | 34.4 |
| Scotland | 19.4 | 36.6 |
| Wales | 19.6 | 31.7 |
4.2 Delay
Average delay split by urban and rural is given in the Table 6 below:
Table 6: Average delay on local ‘A’ roads for the year ending March 2026 split by urban and rural (Table CGN0506b)
| Nation | Urban | Rural |
|---|---|---|
| Great Britain | 74.1 | 21.5 |
| England | 75.8 | 21.6 |
| Scotland | 61.1 | 18.4 |
| Wales | 58.1 | 24.4 |
It is important to note that urban roads generally have lower free flow speeds than rural roads. As a result, a fixed absolute decrease in observed speeds will generally translate into a higher level of delay on urban roads relative to rural roads.
5. Local Authority Breakdown
This section contains average speed and delay values for the year ending March 2026, split by Local Highway Authority.
The highest speeds, and correspondingly the lowest delay values, are generally found in rural Local Authorities.
Those local authorities that are urban see the associated increase in delay and decrease in speed over more rural authorities.
Average delay on Local ‘A’ Roads split by Local Highway Authority is shown in Map 1.
Map 1: Average delay on local ‘A’ roads by Local Highway Authority in Great Britain, April 2025 to March 2026

6. Further Geographic Breakdowns
Further geographic breakdown of speed and delay on Local ‘A’ Roads are included in the data tables as described below.
6.1 Road Level
Travel time measures for individual Local ‘A’ roads are available from 2025 onwards. The annual average speed and average delay for individual roads can be found in Tables CGN0503e (England), CGN0504e (England), CGN0507c (Scotland), CGN0508c (Scotland), CGN0509c (Wales), and CGN0510c (Wales).
7. Context and user feedback
The local ‘A’ road measures presented in this release were developed to provide a more complete picture of travel times on local ‘A’ roads and to align with measures introduced for the SRN.
This release includes Great Britain headline measures for local ‘A’ roads for the first time. This responds to user demand for a broader national view of congestion while preserving the existing England series for continuity. Users can now compare Great Britain alongside the individual country’s measures within a single publication. The interactive maps will be updated to include the new geographies at the next annual release in 2027.
We will continue to review the content and presentation of these statistics, which we expect to develop further over time. Please contact us with any feedback you have, or if you would like further information.
8. Methodology and technical details
Average Speed and Delays are calculated from in-vehicle GPS units and weighted by road traffic flows to better represent the volume of traffic at different locations and times of day. For the Local ‘A’ roads data, the sample includes cars and vans.
It is important to note that although figures are produced for average speed and average delay on both the Local ‘A’ and SRN networks, they are not directly comparable. The methodological differences between the Local ‘A’ road and SRN data prevent comparisons between the 2 road types. A full explanation and further information on the data used, methodology, quality assurance and other sources of data can be found in the Background Quality Report. Data throughout this release is compared on an annual basis, rather than quarterly within year, due to seasonality.
Due to sample changes in the purchased GPS dataset a break in the timeseries has been introduced from April 2025. A comparison of the consistent sample from 2023 and the complete sample has been calculated to understand the impact of this change on the average speed and delay statistics. Further information on this change can be found in the methodology note.
9. Glossary
The glossary below contains some key terms utilised in this statistical release and how these are defined.
| Term | Definition |
|---|---|
| Average Speed | Speed is measured in miles per hour and is an estimate of the physical level of congestion across the entire day (24-hour period). The metric weights speed observations from a sample of vehicles so that it is representative of traffic volumes. The weighting for local ‘A’ roads accounts for associated traffic flows, time period, month, urban or rural classification, and local authority. |
| Average Delay | Delay is measured in seconds per vehicle per mile and is the difference between free flow travel times and recorded average journey times across the entire day (24-hour period). This metric is indicative of relative congestion on the network. Road users do not typically expect free flow conditions and will perceive delay relative to their expected conditions. |
| Free Flow Speed | Free Flow for Local ‘A’ roads is measured as the 85th percentile speed observation for each individual road section. Free flow speeds are ‘capped’ at national speed limits to give an estimated speed of traffic if there was no congestion. |
| Urban and Rural Roads | For statistical purposes, DfT defines ‘urban’ roads to be those within a settlement of 10,000 people or more. This is consistent with the Rural and Urban Area Classification 2011. All other roads are defined as ‘rural’. |
10. About these statistics
This publication is a compendium of both accredited official statistics [footnote 1] and official statistics. The type of statistics presented is detailed below.
10.1 Accredited Official Statistics: Travel times on Local Highway Authority managed “A” roads in England
These official statistics were independently reviewed by the Office for Statistics Regulation in February 2013. They comply with the standards of trustworthiness, quality and value in the Code of Practice for Statistics and should be labelled ‘accredited official statistics’.
10.2 Other official statistics: Travel times on Local Highway Authority managed “A” roads in Great Britain, Scotland and Wales
These new statistics are official statistics. They comply with the standards of trustworthiness, quality, and value in the Code of Practice for Statistics.
11. Next update
The next quarterly table update in this series is expected to be published in September 2026. This will contain monthly, and annual (year ending) figures, for the period July 2025 to June 2026. This will include new figures for the period April 2026 to June 2026.
The next annual written report is expected to be published in February/March 2027 and will contain annual figures for 2026.
12. Instructions for printing and saving
Depending on which browser you use and the type of device you use (such as a mobile or laptop) these instructions may vary.
You will find your print and save options in your browser’s menu. You may also have other options available on your device. Tablets and mobile device instructions will be specific to the make and model of the device.
13. How to search
Select Ctrl and F on a Windows laptop or Command and F on a Mac
This will open a search box in the top right-hand corner of the page. Type the word you are looking for in the search bar and press enter.
Your browser will highlight the word, usually in yellow, wherever it appears on the page. Press enter to move to the next place it appears.
14. Contact us
Road congestion and travel times
Email congestion.stats@dft.gov.uk
Media enquiries 0300 7777 878
To hear more about DfT statistical publications as they are released, follow us on X at DfTstats.
-
Accredited official statistics are called National Statistics in the Statistics and Registration Service Act 2007. Accredited Official Statistics Policy – Office for Statistics Regulation ↩ ↩2