Total income from farming in England in 2025
Updated 24 September 2026
Applies to England

© Crown copyright 2026
This publication is licensed under the terms of the Open Government Licence v3.0 except where otherwise stated. To view this licence, visit nationalarchives.gov.uk/doc/open-government-licence/version/3 or write to the Information Policy Team, The National Archives, Kew, London TW9 4DU, or email: psi@nationalarchives.gov.uk.
Where we have identified any third party copyright information you will need to obtain permission from the copyright holders concerned.
This publication is available at https://www.gov.uk/government/statistics/total-income-from-farming-in-england/total-income-from-farming-in-england-in-2025
This release presents the account of Total Income from Farming (TIFF) in England for 2025 and is subject to a degree of revision in future years when additional data becomes available.
TIFF is the income to those who own businesses within the agricultural industry. It is the total profit from all farming businesses in England on a calendar year basis. It measures the return to all entrepreneurs for their management, inputs, labour and capital invested. The term ‘income’ used throughout this notice refers to TIFF.
Section 1: Key messages
In this section, all values are provided in current prices which is considered the most intuitive approach for comparisons over a short time period. It should be noted that these values have not been adjusted for inflation.
-
Total Income from Farming (TIFF) in England in 2025 was £5.4 billion, an increase of £0.6 billion (+12.9%) from 2024. After a period of relative stabilisation in input costs in 2025, the increase in TIFF was primarily driven by higher commodity prices in the beef and dairy sectors, which led to a substantial rise in the value of outputs.
-
In 2025, agriculture’s contribution to England’s economy (Gross Value Added at basic prices) was £11.2 billion, an increase of £0.8 billion (+7.3%) from 2024.
-
Total livestock output was £14.0 billion, an increase of £1.2 billion (+9.3%) from 2024, driven by increases in the values of beef (+21.9%) and milk (+12.0%). Beef value rose by £456 million due to a combination of historically high deadweight prices and tight supplies. Milk value increased by £462 million as continued high farmgate prices from 2024 incentivised increased milk production during spring and summer 2025.
-
Total crop output was £9.5 billion, a decrease of £0.4 billion (-3.7%) from 2024, driven by falls in the values of barley, sugar beet and potatoes. All three crop commodities experienced price decreases in 2025, while production volumes and crop quality were variable due to challenging planting and harvesting conditions.
-
Intermediate consumption in 2025 was £15.3 billion, an increase of £0.1 billion (+1.0%) from 2024. This increase was driven by higher values for fertilisers (+6.1%) and other goods and services (+3.6%), outweighing a 1.4% decrease in animal feed, the largest component of intermediate consumption.
1.1 Recent comparison of TIFF in England
Figure 1.1: TIFF in England: 2020 to 2025 at current prices
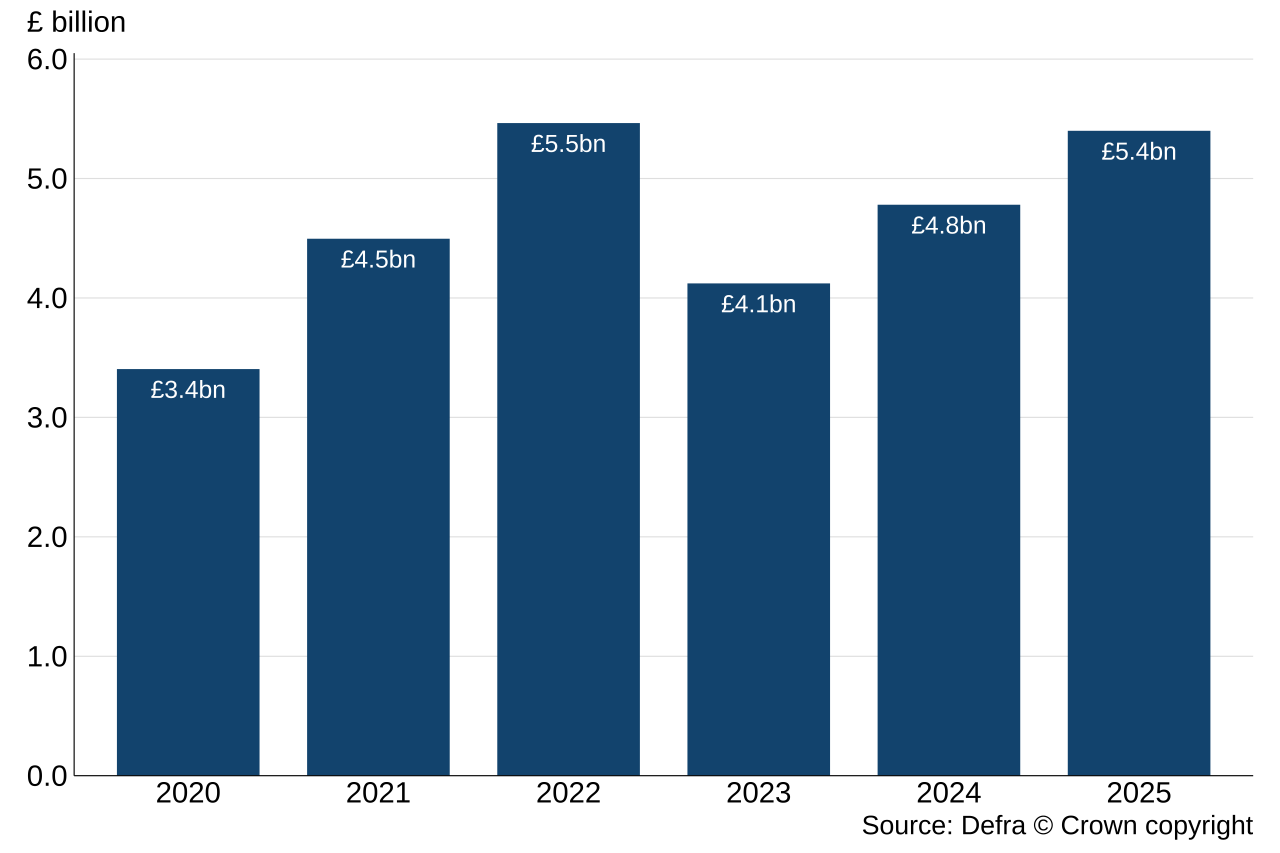
Figure 1.1 shows the value of TIFF in England from 2020 to 2025 at current prices. Since 2020, the average value of TIFF has been £4.6 billion, with the lowest value of £3.4 billion in 2020 and the highest value of £5.5 billion in 2022. In 2025, the value of TIFF increased by £0.6 billion (+12.9%) to £5.4 billion, the second highest value in the last 6 years.
Section 2: Outputs and subsidies
In this section we provide a detailed comparison of the outputs and subsidies from the TIFF account in recent years in current prices. This approach is considered the most intuitive for comparisons over a short time period.
2.1 Overview
Figure 2.1: Outputs breakdown from TIFF in England: 2020 to 2025 at current prices
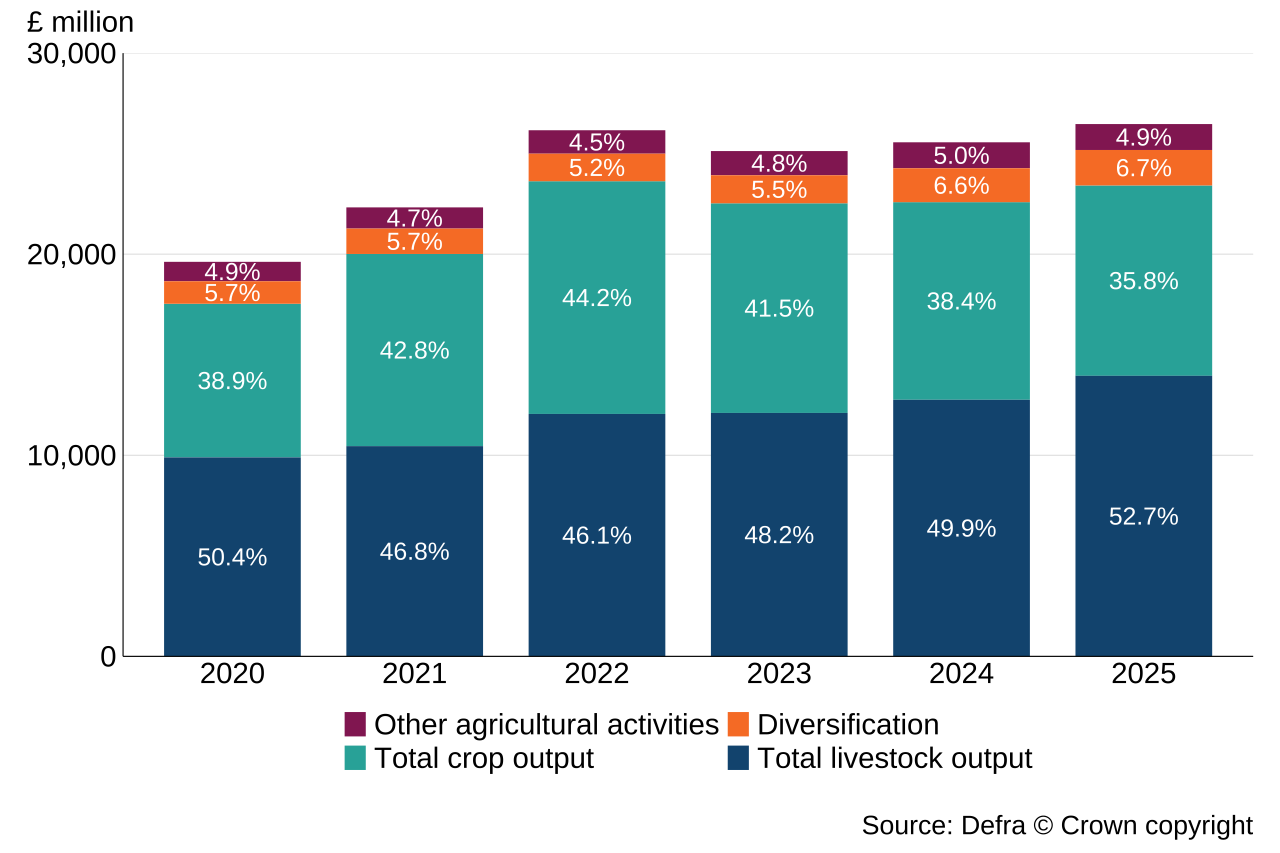
Figure 2.1 shows the value of all outputs from 2020 to 2025. Values are presented in millions at current prices. Total livestock output is consistently the largest contributor to the value of all outputs.
2.2: Comparing outputs and subsidies from 2024 and 2025
This comparison of the TIFF account from the two most recent years is made between values that have not been adjusted for inflation. This approach is considered the most intuitive for comparisons year to year. See the dataset for the full set of values expressed in current prices.
2.2.1 Livestock
Figure 2.2: Main contributors to livestock output (£ million)
| Account item | 2024 | 2025 |
|---|---|---|
| Milk | 3,842 | 4,304 |
| Poultry | 2,822 | 2,891 |
| Beef | 2,085 | 2,540 |
| Pigmeat | 1,352 | 1,380 |
| Mutton and lamb | 1,045 | 1,036 |
| Eggs | 754 | 809 |
-
The largest contribution to total livestock output in 2025 was milk, contributing £4.3 billion, an increase of £462 million (+12.0%) from 2024. This was also the largest value increase in total livestock output and was driven by increases in both prices and production. High farmgate prices at the end of 2024 continued into 2025, with an average UK farmgate price of 44.0 pence per litre (ppl) in 2025, a 6.8% increase from 2024. This, combined with lower feed wheat prices, incentivised milk production during the spring and summer, with overall UK milk production in 2025 increasing by 5.0% to 15.8 billion litres compared with 2024.
-
In 2025, the second largest value increase in total livestock output was beef, which increased by £456 million (+21.9%) to £2.5 billion. In 2025, there was a tightening in domestic beef supply, with decreases in the English beef and breeding cattle herds at June 2025 of 1.8% and 2.2% respectively. Prime cattle slaughter in England and Wales fell by 3.7% to 1.3 million head, with total UK home-fed beef production decreasing by 3.4% to 898 thousand tonnes. As a result, UK deadweight prime cattle prices increased sharply, reaching a record annual average of 647.3 pence per kilogram in 2025, 30.2% higher than in 2024.
2.2.2 Crops
Figure 2.3: Main contributors to crop output (£ million)
| Account item | 2024 | 2025 |
|---|---|---|
| Wheat | 1,928 | 1,913 |
| Fresh vegetables | 1,767 | 1,808 |
| Plants and flowers | 1,518 | 1,488 |
| Potatoes | 1,109 | 988 |
| Fruits | 839 | 868 |
| Barley | 809 | 671 |
| Other crop products | 677 | 648 |
| Oilseed rape | 273 | 338 |
| Sugar beet | 365 | 286 |
| Forage plants | 174 | 173 |
| Protein crops | 185 | 156 |
Notes:
- Potato prices and yield information were previously obtained from the AHDB who stopped producing data midway through 2021. From 2022 we have estimated yields based on input from sector representatives, devolved administrations and coverage of the sector in the farming press. For prices we made use of the Northern Ireland published potato price figures.
-
The largest contribution to total crop output in TIFF in England in 2025 was wheat, contributing £1.9 billion, a decrease of £15.0 million from 2024. Harvested wheat production in England increased slightly by 565 tonnes compared with 2024, as an 8.8% increase in cropped area offset a 2.9% decline in yields. Increased domestic and global supplies put downward pressure on prices in 2025. Falls in UK breadmaking wheat (-17.0%) and feed wheat (-5.0%) prices contributed to an overall 0.8% decrease in the value of wheat output.
-
In 2025, the largest value decrease in total crop output was barley, which fell by £138 million (-17.0%) to £671 million. Barley production in England at June 2025 decreased by 13.7% to 4.2 million tonnes, driven by a 12.7% reduction in planted area and a 1.2% decrease in yields due to the hot and dry weather during the spring and summer. Increased global supplies of barley put pressure on domestic prices, with premium malting barley price falling by 7.8% and feed barley price falling by 2.4% from 2024.
-
Smaller decreases were seen in the values of potatoes and sugar beet. The value of potatoes decreased by £121 million (-10.9%) to £1.0 billion in 2025, as ample supplies put downward pressure on prices. The value of sugar beet fell by £80 million (-21.8%) to £286 million, with poor planting conditions and pest pressures contributing to a fall in production of 552 thousand tonnes (-7.1%) to 7.3 million tonnes.
2.2.3 Other outputs and subsidies
Figure 2.4: Breakdown of other outputs and subsidies (£ million)
| Account item | 2024 | 2025 |
|---|---|---|
| Subsidies not linked to production | 1,792 | 2,144 |
| Diversification | 1,687 | 1,764 |
| Other agricultural activities | 1,290 | 1,289 |
Notes:
-
‘Subsidies not linked to production’ includes subsidies not directly linked to production. This includes the delinked payments scheme and agri-environment schemes, including the Countryside Stewardship Scheme and Sustainable Farming Incentive.
-
Subsidies captured in the accounts do not include capital grants to farmers or general services support. This, alongside more minor differences in reporting scope, means that payments totals reported in this chapter will not align with those in Chapter 10: Agricultural Support Payments, which includes all payments reported as part of the Agricultural Policy Monitoring and Evaluation Report that is submitted to OECD.
-
To improve clarity, the item ‘Inseparable non-agricultural activities’ has been renamed ‘Diversification’.
Section 3: Inputs and costs
3.1 Overview
In this section we provide a detailed comparison of the inputs and costs from the TIFF account in recent years in current prices. This approach is considered the most intuitive for comparisons over a short time period.
Figure 3.1: Inputs breakdown from TIFF in England: 2020 to 2025 at current prices
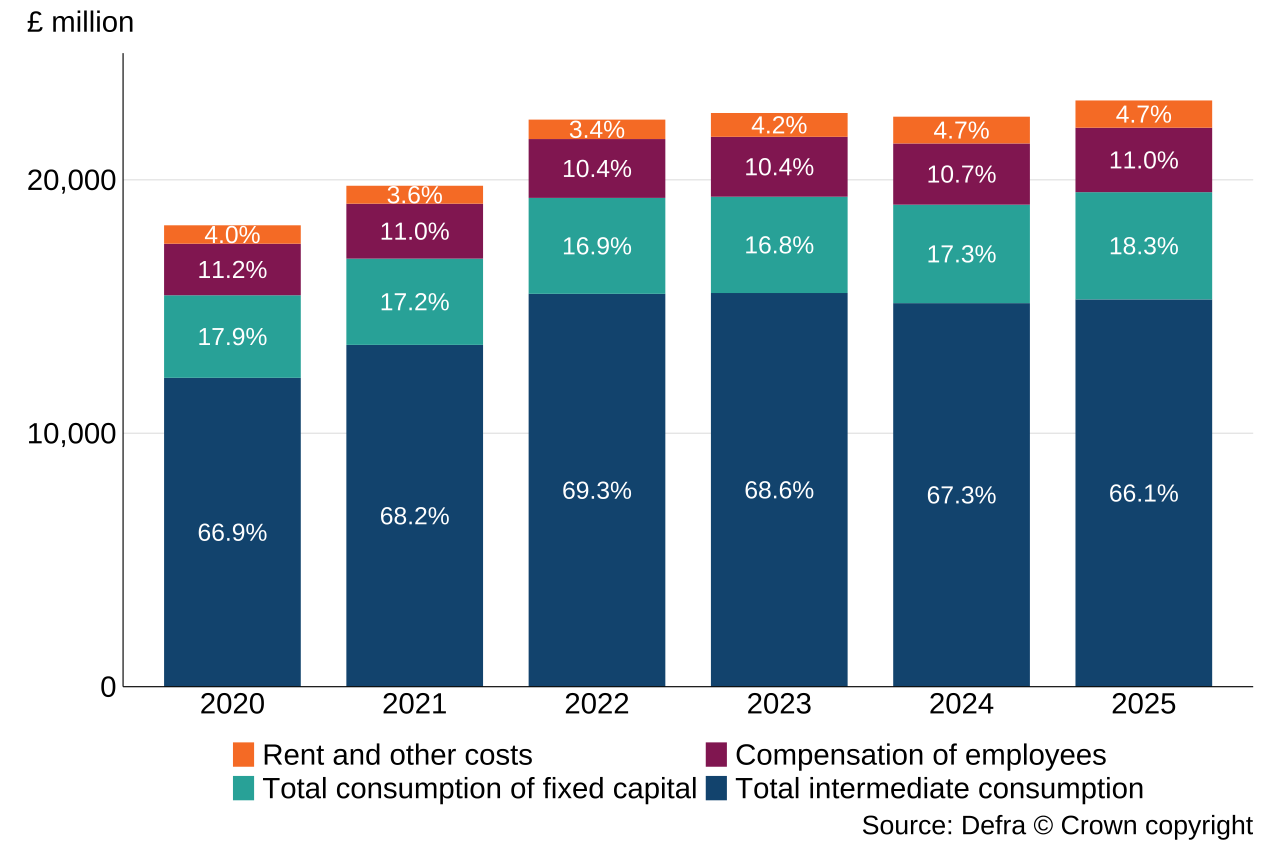
Notes:
- “Rent and other costs” includes the account items Rent and Interest.
Figure 3.1 shows the composition of all inputs and costs from 2020 to 2025. Inputs and costs represent all money paid out by farmers during a calendar year. Values are presented in millions at current prices.
3.2 Intermediate consumption
Intermediate consumption represents items that are used up during the production of farm outputs. The accounts are set up in a way to provide a picture of the agriculture industry in an annual year in terms of money spent and money received by farming businesses. For intermediate consumption, we rely on data from the Farm Business Survey on expenditure. However, this data is only available two years in arrears and so our initial estimate each year is based on information from industry experts, which is then replaced with Farm Business Survey data the following year, resulting in revisions to the intermediate consumption estimates. See Section 5.4: Revisions for details.
Figure 3.2: Main contributors to intermediate consumption (£ million)
| Account item | 2024 | 2025 |
|---|---|---|
| Animal feed | 4,585 | 4,520 |
| Other goods and services | 2,714 | 2,811 |
| Total maintenance | 1,771 | 1,841 |
| Energy | 1,447 | 1,420 |
| Agricultural services | 1,284 | 1,280 |
| Fertilisers | 1,197 | 1,270 |
| Seeds | 849 | 852 |
| Plant protection products | 854 | 820 |
| Veterinary expenses | 325 | 346 |
-
The largest contribution to intermediate consumption in TIFF in England in 2025 was animal feed, contributing £4.5 billion. Animal feed is predominantly made up of ‘compounds’ and ‘straights’, with some being produced and sold on farm. GB compound feed production increased by 221 kilotonnes (+2.0%) from 2024. However, this was offset by decreases in compound feed prices, resulting in an overall decrease in value. Prices for cattle and calf feed decreased by 3.8%, pig feed by 2.7%, sheep feed by 3.4%, and poultry feed by 4.0%. Conversely, the value of straights animal feed increased, with a large rise in overall GB production (+14.7%) outweighing reductions in crop commodity prices.
-
In 2025, the largest value increase in intermediate consumption was other goods and services, which increased by £97 million (+3.6%) to £2.8 billion. Other goods and services includes costs such as specific livestock and crops costs, water rates, insurance, costs associated with specialist contractors, professional fees and banking fees. The UK annual price index for other goods and services increased by 3.3% in 2025 due to a large increase in water prices driven by a rise in water tariff prices and limited supplies. Increased borrowing costs and regulatory changes also drove increases in the value of professional and bank fees.
3.3 Other inputs and costs
Figure 3.3: Breakdown of other inputs and costs involved in agriculture (£ million)
| Account item | 2024 | 2025 |
|---|---|---|
| Total consumption of fixed capital | 3,885 | 4,231 |
| Equipment consumption of fixed capital | 2,034 | 2,083 |
| Buildings consumption of fixed capital | 936 | 960 |
| Livestock consumption of fixed capital | 915 | 1,188 |
| Compensation of employees | 2,416 | 2,543 |
| Rent | 439 | 435 |
| Interest | 618 | 641 |
Section 4: Long term trends of TIFF in England
Values in this section are expressed in real terms at 2025 prices. The figures have been adjusted to account for inflation, which allows more meaningful comparisons between years over the longer term.
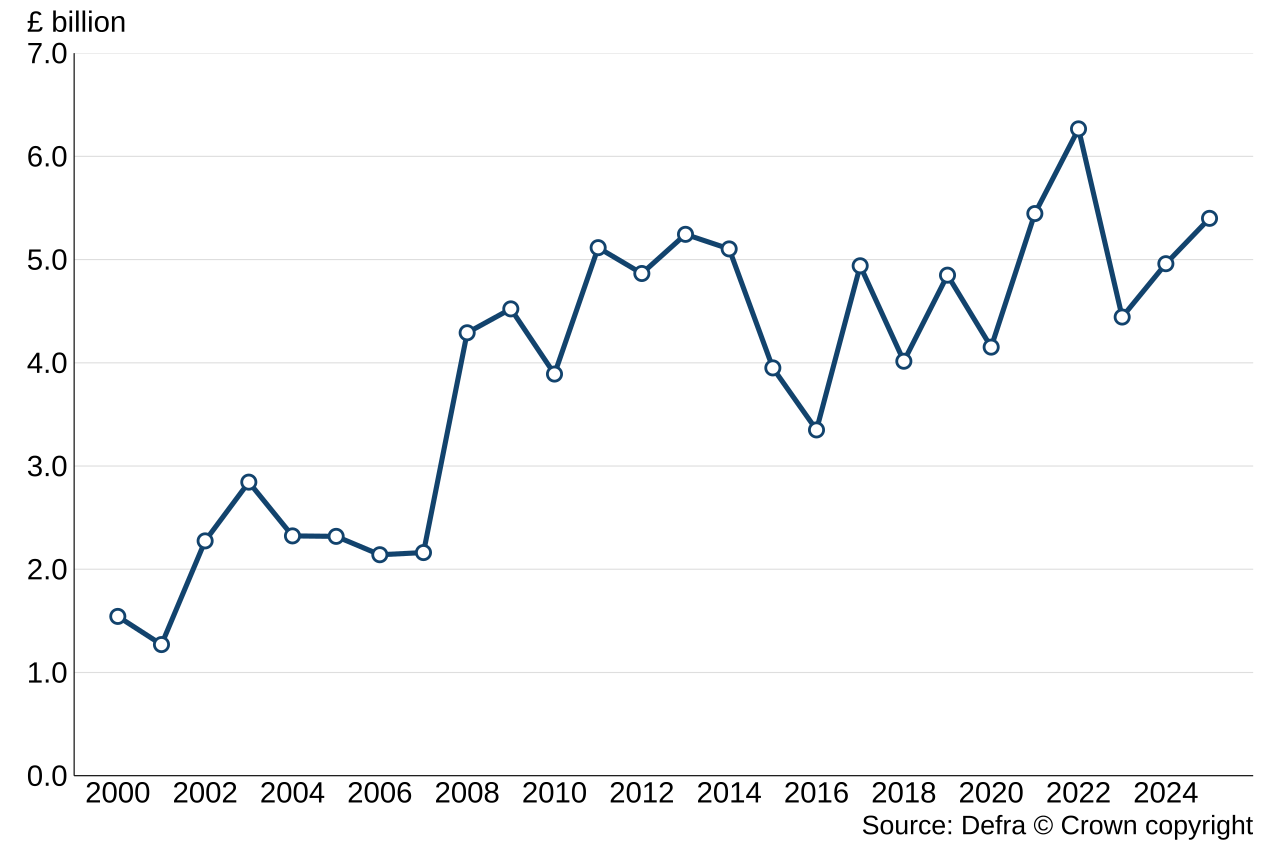
Figure 4.1: TIFF in England in real terms from 2000 to 2025
-
Overall, TIFF in England has increased in real terms in recent decades, despite some large year-on-year fluctuations, and has more than tripled since 2000.
-
A notable dip occurred in 2015 and 2016, driven by a strong pound in 2015, a poor 2016 harvest and low commodity prices throughout, before recovering in 2017. Following several years of fluctuations, TIFF in 2021 increased by 31.2% due to increased crops and livestock output values offsetting a large increase in intermediate consumption. TIFF increased in real terms again in 2022 (+15.1%) due to high commodity prices for outputs, despite high input costs. This resulted in the highest TIFF in England in real terms since 1997. In 2023, TIFF fell by £1.8 billion (-29.1%) in real terms from 2022. This was driven by a large reduction in the value of crop output due to poor weather conditions impacting cereal and oilseed rape quality and yields. In 2024, a relatively poor year for crops was offset by high livestock commodity prices resulting in an 11.6% increase in TIFF.
-
In 2025, TIFF saw an overall increase in real terms of £439 million (+8.9%), with an increase of £421 million (+2.7%) in the value of intermediate consumption outweighing a small decrease in total output value at basic prices. The value of total livestock output rose by £712 million (+5.4%) due to historically high prices for beef and milk, but this was offset by a decrease of £729 million (-7.2%) in the value of total crop output.
Section 5 - About these statistics
5.1 Contact details
Responsible statistician: Alexandra Hall
Public enquiries: farmaccounts@defra.gov.uk
For media queries between 9am and 6pm on weekdays:
Telephone: 0330 041 6560
newsdesk@defra.gov.uk (monitored 9am to 6pm on weekdays)
5.2 Accredited Official Statistics
Accredited official statistics are called National Statistics in the Statistics and Registration Service Act 2007. An explanation can be found on the Office for Statistics Regulation website.
These statistics were independently reviewed by the UK Statistics Authority (now the Office for Statistics Regulation) in 2014 (see Assessment Report 271: Statistics on Agriculture). They comply with the standards of trustworthiness, quality and value in the Code of Practice for Statistics and should be labelled ‘accredited official statistics’.
The continued designation of these statistics as accredited official statistics was confirmed in December 2017 following a compliance check by the UK Statistics Authority (now the Office for Statistics Regulation) against the Code of Practice for Statistics. The compliance check letter can be found on the Office for Statistics Regulation website.
Since the latest review by the Office for Statistics Regulation, we have continued to comply with the Code of Practice for Statistics and have enhanced data quality by reviewing methodologies and data sources. A summary quality report for this statistical release can be found on the GOV.UK website for Aggregate agricultural accounts.
You are welcome to contact us directly with any comments about how we meet these standards (see contact details above). Alternatively, you can contact OSR by emailing regulation@statistics.gov.uk or via the OSR website.
5.3 Methodology
TIFF refers to income generated by production within the agricultural industry, including subsidies. TIFF represents business profits and remuneration for work done by owners and other unpaid workers. It excludes changes in the values of assets and stocks due to price changes, but includes non-agricultural activities such as further processing or tourist activities where these cannot be separated from the agricultural business. TIFF is the preferred measure of aggregate income for the agricultural industry, conforming to internationally agreed national accounting principles required by the UK National Accounts.
Values for England are derived by subtracting similar accounts for Wales, Scotland and Northern Ireland from the United Kingdom agricultural account. Latest account information for the UK can be found at United Kingdom: Total Income from Farming statistics. Similar information for devolved administrations are available at Scotland: Total Income from Farming statistics, Wales: Aggregate agricultural output and income statistics and Northern Ireland: Aggregate agricultural account statistics.
The UK level estimates used as a starting point for the estimates in this release were published by Defra on 11 June 2026. The estimates for the Devolved Administrations, which were deducted from the UK estimates, were based on the latest estimates for Scotland, Wales and Northern Ireland available at the time of TIFF UK.
5.4 Revisions
Revisions are intended to increase the precision of the estimates and are routinely the result of more data becoming available over time. Sometimes additional revisions are necessary to refine the methodology or correct historical errors.
TIFF is the relatively small difference between two large numbers and is therefore sensitive to small percentage changes in the values of Outputs and Intermediate Consumption. A combination of a revision downwards in Output and revision upwards in Intermediate Consumption leads to more sizeable revisions in percentage terms to GVA and TIFF.
Table 5.4.1: Revisions in All outputs and subsidies, Inputs and costs, and TIFF for 2024 in current prices (£ million)
| Account item | Previous estimate for 2024 (Published July 2025) | Current estimate for 2024 (Published September 2026) | % Change from July 2025 estimates |
|---|---|---|---|
| All outputs and subsidies | 27,325 | 27,357 | 0.1% |
| Inputs and costs | 21,988 | 22,576 | 2.7% |
| TIFF | 5,338 | 4,781 | -10.4% |
The estimate of TIFF in England for 2024, published in July 2025, has been revised down by £557 million (-10.4%). TIFF is calculated as the (relatively small) difference between two large numbers, ‘outputs and subsidies’ and ‘inputs and costs’, and so minor changes in these numbers can feed through to cause a large change in the value of TIFF or can cancel each other out with large changes in the same direction. This reduction in the estimate for TIFF 2024 is the result of a 2.7% increase in inputs and costs offsetting a 0.1% increase in outputs and subsidies.
As a result of more data becoming available over time there have also been minor revisions to earlier years in this release. These revisions are intended to enhance the precision of these estimates. Sometimes additional revisions are necessary to refine the methodology or correct historical errors.
Tables 5.4.2 and 5.4.3 provide further details of revisions to 2024 estimates greater than £100 million.
Table 5.4.2: Revisions greater than £100 million in outputs in current prices (£ million)
| Account item | Previous estimate for 2024 (Published July 2025) | Current estimate for 2024 (Published September 2026) | % Change from July 2025 estimates |
|---|---|---|---|
| Diversification | 1,482 | 1,687 | 13.8% |
The £205 million increase to the value of diversification is due to the replacement of industry estimates with survey data. Please see Section 3.2: Intermediate consumption for further details.
Table 5.4.3: Revisions greater than £100 million in inputs and costs in current prices (£ million)
| Account item | Previous estimate for 2024 (Published July 2025) | Current estimate for 2024 (Published September 2026) | % Change from July 2025 estimates |
|---|---|---|---|
| Energy | 1,290 | 1,447 | 12.2% |
| Total maintenance | 1,599 | 1,771 | 10.7% |
| Compensation of employees | 2,145 | 2,416 | 12.6% |
The £157 million increase to the value of energy, £172 million increase to the value of total maintenance and £271 million increase to the value of compensation of employees are due to the replacement of industry estimates with survey data. Please see Section 3.2: Intermediate consumption for further details.
5.5 Summary quality report
A summary quality report for this statistical release can be found on the GOV.UK website for Aggregate agricultural accounts.
This is an overview note which is not release specific and was last updated in March 2019. It pulls together key qualitative information on the various dimensions of quality as well as providing a summary of methods used to compile the output. It relates to estimates of Total Income from Farming and aims to provide users with information on usability and fitness for purpose of these estimates.
5.6 Quality assurance
DEFRA has in place quality assurance processes to check the accuracy and reliability of the aggregate agricultural accounts that include:
-
Ongoing review of methods employed in the calculation of the accounts.
-
Assessment of the quality of the estimates of items of the accounts with experts within DEFRA.
-
Discussion of items of the accounts with external experts.
5.7 Development areas
DEFRA statisticians carry out a continuous review of methods employed in making estimates of the production and income accounts. This may lead to revisions to data series owing to improvements in methods, in addition to the use of more up-to-date information.
5.8 Main users and uses of these statistics
The aggregate agricultural accounts are used both within government and by the wider agricultural industry in conjunction with other economic information to:
-
Monitor the productivity and competitiveness of the farming industry.
-
Inform policy decisions and to help monitor and evaluate current policies relating to agriculture in the UK by Government.
-
Inform stakeholders of the performance of the agricultural industry.
-
Inform research into the economic performance of the agricultural industry.
5.9 User engagement
As part of our ongoing commitment to compliance with the Code of Practice for Official Statistics we wish to strengthen our engagement with users of TIFF England data and better understand how data from this release is used. Consequently, we invite you to register as a user of the TIFF England data, so that we can retain your details and inform you of any new releases and provide you with the opportunity to take part in any user engagement activities that we may run.
5.10 Future publications
These estimates for 2025 will be subject to minor revisions in future publications of TIFF in England. The next estimates for TIFF in England for 2026 will be published September 2027. The availability of additional data and revised data will be incorporated to improve the accuracy of the estimates.
To find out the latest information on when UK government statistics will be released, please visit our statistics release calendar.
5.11 Other publications relevant to this release
A number of publications released by Defra, are relevant to this release. Below is a list of the key publications and links to them on GOV.UK