Gambling and Lotteries - Taking Part Survey 2019/20
Published 16 September 2020
Applies to England

© Crown copyright 2020
This publication is licensed under the terms of the Open Government Licence v3.0 except where otherwise stated. To view this licence, visit nationalarchives.gov.uk/doc/open-government-licence/version/3 or write to the Information Policy Team, The National Archives, Kew, London TW9 4DU, or email: psi@nationalarchives.gov.uk.
Where we have identified any third party copyright information you will need to obtain permission from the copyright holders concerned.
This publication is available at https://www.gov.uk/government/statistics/taking-part-201920-gambling-and-lotteries/gambling-and-lotteries-taking-part-survey-201920
The Taking Part survey is a continuous face to face household survey of adults aged 16 and over and children aged 5 to 15 years old in England. This chapter summarise results from adults (16+) and their participation in gambling from the 2019/20 survey, which ran from April 2019 to March 2020.
Differences between groups are only reported on in this publication where they are statistically significant i.e. where we can be confident that the differences seen in our sampled respondents reflect the population [footnote 1].
1. National Lottery Games
In 2019/20, 44% of respondents reported playing a National Lottery Game at least once in the last 12 months.
Of those respondents who had played, the most popular National Lottery games were Lotto (71%) and Euromillions (60%).
Figure 7.1 Most commonly reported National Lottery games played (of those who play National Lottery games), 2019/20
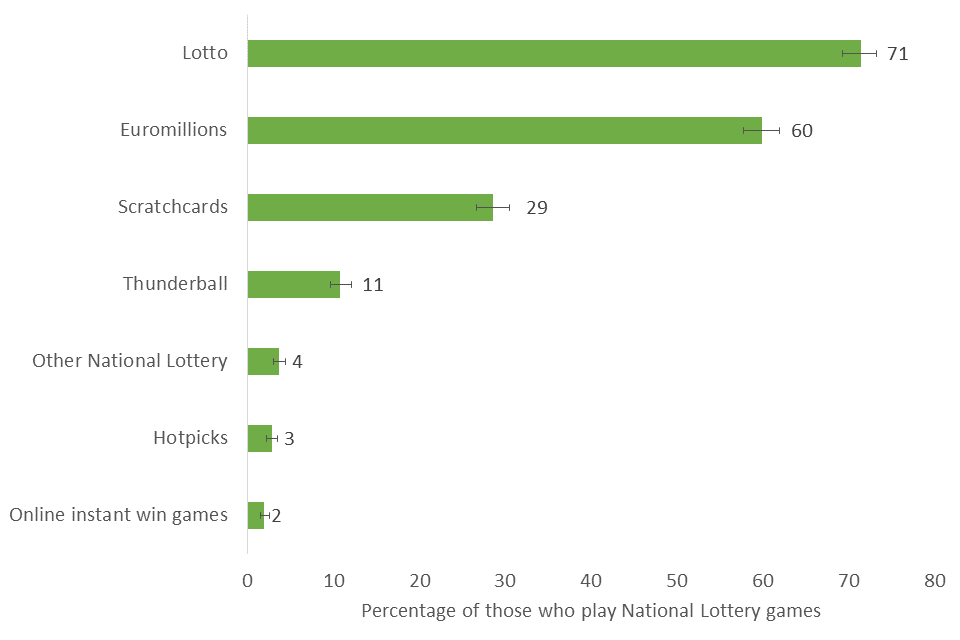
Most commonly reported National Lottery games played of those who play any National Lottery games in the last 12 months, 2019/20
For those who had played a National Lottery game, 35% reported playing every week, and 25% reported playing every month but not every week, whilst 40% reported playing less often than monthly. According to the Gambling Commission, their survey on behaviour, awareness and attitudes in 2019 showed that once a month was also the most popular frequency in 2019 for those who had gambled in the past 4 weeks.
The most commonly reported reasons for playing National Lottery games were because prizes were big (67% of players), that playing supports good causes (24% of players), and that it’s easy to play (24% of players).
Figure 7.2 Most common reasons for playing National Lottery Games, 2019/20
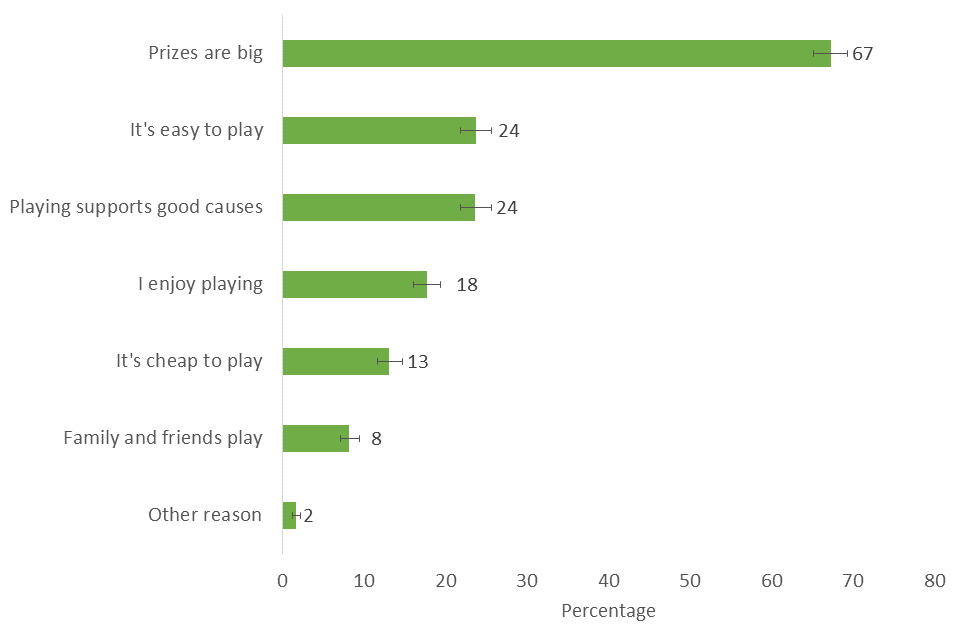
Most commonly reasons given for playing a National Lottery game, 2019/20
The most commonly reporting reasons for never playing was not being interested in playing, reported by 79% of those who had never played. ‘It’s too expensive’ was reported by 9% of respondents.
2. Society Lotteries
The Taking Part survey also asked about participation in society lotteries, which are lotteries run by charities to raise money for good causes, and include local and community lotteries. In 2019/20, 15% of respondents reported having played any society lottery in the last 12 months.
3. Sports betting
Overall, 17% of respondents reported betting on sports in the last year. The Gambling Commission estimates that during 2019, 7% of respondents reported playing in the last 4 weeks.
Of the respondents who have attended a live sports event in the last 12 months, 20% reported placing a bet of some kind during at least one of these visits.
For respondents who had watched live sport on TV or online in the last 12 months, 19% reported placing a bet of some kind on at least one occasion. 11% of respondents reported placing a bet on a sports events they were not watching.
4. Who plays National Lottery games?
45 - 64 year olds were the most likely to have played a National Lottery game (54%) and 16-24 year olds the least likely (21%).
Figure 7.3 Percentage of respondents who have played any National Lottery game in the last 12 months by age, 2019/20
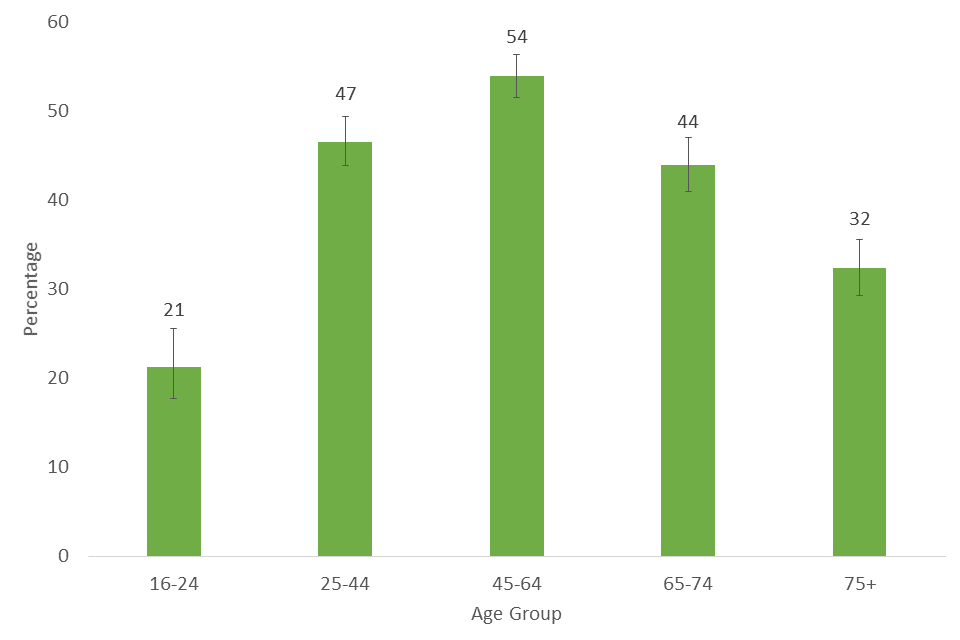
Percentage of respondents who have played a National Lottery game in the last 12 months by age group, 2019/20
Looking at ethnicity, White respondents (47%) were more likely to have played than Asian, Black or Other respondents (23-30%). Asian respondents were also less likely to have played than Mixed respondents (42%).
Figure 7.4 Percentage of respondents who have played any National Lottery game in the last 12 months by ethnicity, 2019/20
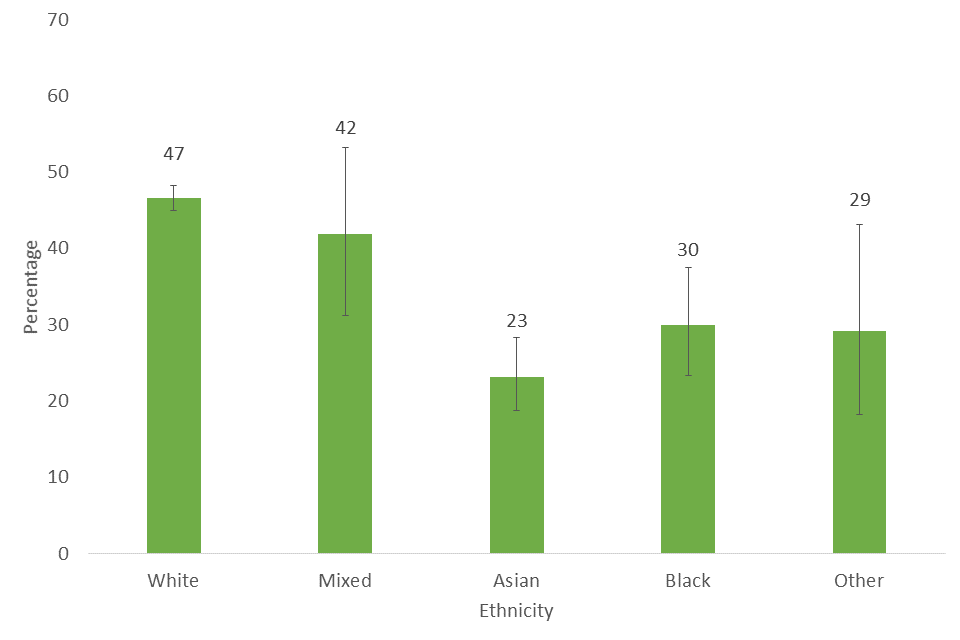
Percentage of respondents who have played a National Lottery game in the last 12 months by ethnicity, 2019/20
A limited amount of regional variability was seen. For example, respondents from the North East were more likely (54%) to have played National Lottery games than those from the East Midlands, West Midlands and South East (42-44%). Respondents from London reported playing the least (31%).
Figure 7.5 Percentage of respondents who have played any National Lottery game in the last 12 months by region, 2019/20
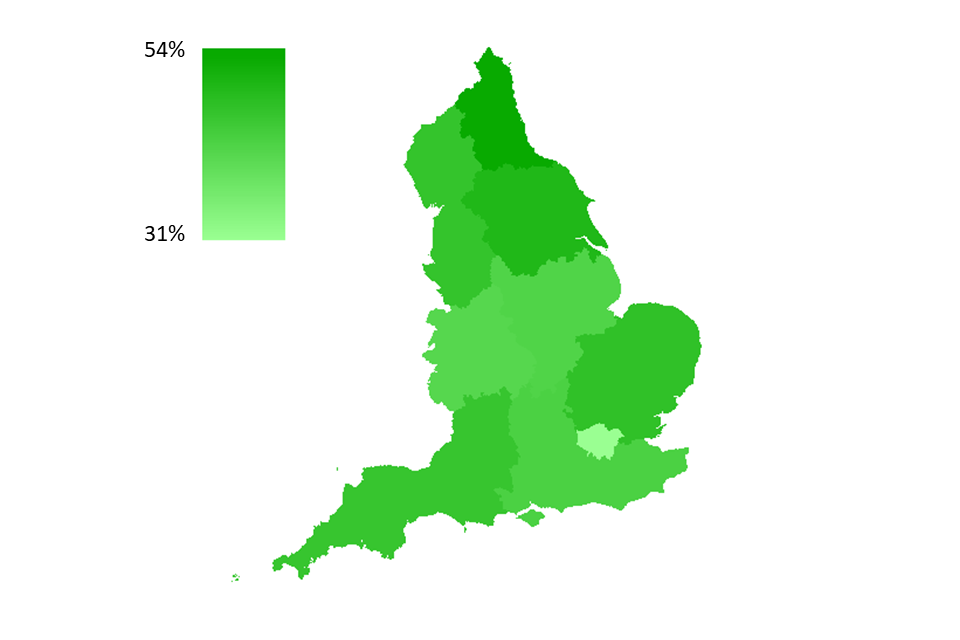
Percentage of respondents who have played a National Lottery game in the last 12 months by region, 2019/20
In addition, men (47%) were more likely to have played than women (41%), a trend that the Gambling Commission has previously observed.
Further demographic data
- Those working showed higher participation in National Lottery games (50%) than those not working (35%)
- Homeowners were more likely to have played (46%) than those in the private rented sector (38%)
- Respondents in rural areas (48%) were more likely to have played than those living in urban area (43%).
- No variability was seen in playing a National Lottery game in the last 12 months by Index of Multiple Deprivation [footnote 2], presence or absence of a long-term limiting illness or disability, or socio-economic status [footnote 3].
-
The 95% confidence intervals are indicated by error bars on the charts. They show the range that we are 95% confident the true value for the population falls between. When there is no overlap between the error bars for two or more groups, we can be more confident that the differences between groups represent true differences between these groups in the population ↩
-
The Index of Multiple Deprivation, commonly known as the IMD, is the official measure of relative deprivation for small areas in England. It is calculated using several measures such as income deprivation, crime and living environment deprivation. The Index of Multiple Deprivation ranks every small area in England from 1 (most deprived area) to 32,844 (least deprived area), which we have sorted into deciles for this publication. ↩
-
Using National Statistics Socio-economic classification (NS-SEC), respondents were categorised as being in one of three groups – Higher managerial, administrative and professional occupations; Intermediate occupations; Routine occupations. The NS-SEC classifies people depending on their employment. For more information see Annex B. ↩