Surveillance of bloodstream infections in intensive care units, England: May 2016 to March 2024 report
Updated 24 February 2026
Applies to England

© Crown copyright 2026
This publication is licensed under the terms of the Open Government Licence v3.0 except where otherwise stated. To view this licence, visit nationalarchives.gov.uk/doc/open-government-licence/version/3 or write to the Information Policy Team, The National Archives, Kew, London TW9 4DU, or email: psi@nationalarchives.gov.uk.
Where we have identified any third party copyright information you will need to obtain permission from the copyright holders concerned.
This publication is available at https://www.gov.uk/government/statistics/surveillance-of-bloodstream-infections-in-intensive-care-england/surveillance-of-bloodstream-infections-in-critical-care-units-england-may-2016-to-march-2024-report
Help us improve this resource
We’d like your feedback on how you use these UKHSA surveillance data.
Take a short survey to tell us what works, what doesn’t, and how we can make it better for you.
This report presents trends of bloodstream infections in patients in intensive care units (ICUs) in England as part of the Infection in Critical Care Quality Improvement Programme (ICCQIP). The report presents data on how often these infections occur in England, the microbes that cause them, risk factors and how often people die following an infection. The aim of this surveillance programme is to inform efforts to make intensive care safer for patients. This is the first published epidemiological commentary by UKHSA on this disease area in England and is being published as official statistics in development.
Main points
The main messages of this report are:
- in adult units, the rate of bloodstream infections that occurred in intensive care (ICU-BSI) has been largely stable except during the early stages of the COVID-19 pandemic, when it rose sharply from 3.6 to 6.3 ICU-BSIs (per 1,000 bed-days over 2 nights) – since then, the rate has returned to pre-pandemic levels
- the most common microbes causing ICU-BSIs in adult units were Gram-negative bacteria (50.6%), followed by Gram-positive bacteria (39.0%) and Candida (8.7%)
- ICU-BSI rates were lower in paediatric and neonatal units – in paediatric units, Gram-negative bacteria made up a higher percentage (60.3%) of microbes, while in neonatal units this was lower (41.6%), with Gram-positive bacteria making up 57.9% of ICU-BSIs
- the use of central lines (CLs) ranged around 60% in adult units; it was slightly lower in paediatric units (around 55%) and much lower in neonatal units (around 22%)
- the rate of bloodstream infections linked to CLs peaked at the start of the COVID-19 pandemic, similarly to the general ICU-BSI trends
- the percentage of people who died within 30 days of diagnosis of a ICU-BSI (30-day all-cause mortality) in adult units increased from 25.6% at the start of surveillance to 33.3% during the early stages of the COVID-19 pandemic; it has since decreased to 27.1%
User feedback
We are carrying out a user survey to gather your views and shape the future of our publication.
Participation
Participating in this surveillance programme is voluntary for ICUs. Of the 189 ICUs that have ever entered data onto the Data Capture System (DCS), 88.4% (167 out of 189) were adult units, representing 68.4% of the 244 adult ICUs in England in 2024 as identified in an external audit. Participation among paediatric and neonatal ICUs was lower, with 10 paediatric ICUs (43.5% of 23 paediatric ICUs in England in 2023) and 12 neonatal ICUs (7.8% of 153 neonatal ICUs in England in 2023) ever having submitted data to ICCQIP surveillance.
Participation fluctuates each year, and it decreased during the first 2 waves of the COVID-19 pandemic, when units were offered the option of pausing data entry. Participation has subsequently increased.
For these reasons, readers should be cautious when comparing values across different years and when interpreting results for paediatric and neonatal units.
For more information on the number of ICUs in England and participation in the ICCQIP surveillance programme by unit type and financial year, please see supplementary Table S1 and the quality and methodology information (QMI) report on the landing page for these statistics.
Overview of infections across all unit types
The following results include summary data from ICUs of all age types (adult, paediatric and neonatal) and were driven largely by events in adult units. Results stratified by unit type (adult, paediatric and neonatal) are available in further sections of this report and in the Supplementary results for paediatric and neonatal units.
Definitions and methods for all the metrics reported in this report can be found in the Glossary and in the QMI report.
Incidence
Positive blood cultures (PBC) caused by skin commensals are classified as bloodstream infections (BSIs) only if there are signs of infection and a repeat blood culture taken within two days is positive for that same organism. PBCs caused by other organisms are classified as BSI regardless. BSIs occurring in patients who have spent over 2 nights in the ICU are defined as ICU-associated BSI (ICU-BSI). More information is available in the Glossary and in the QMI report.
Rates of PBCs, BSIs and ICU-BSIs across participating ICUs remained largely steady between May 2016 and March 2020, before rising sharply to a peak in financial year (FY) 2020 to 2021. There was a gradual return to rates similar to pre-pandemic levels by the FY 2023 to 2024 (Figures 1 and 2, Table 1). The peak during the start of the COVID-19 pandemic was due to both an increase of numerator (count of infections) and a decrease in denominator (reported occupied bed-days) in adult units. However, as the number of occupied bed-days in adult units was likely underreported during this period due to the expansion of ICU beds into other areas and other factors, it is possible that the incidence rate was overestimated.
Figure 1. Rates of positive blood cultures (PBC) and bloodstream infections (BSI) per 1,000 bed-days across all ICUs, England: between FY 2016 to 2017 and FY 2023 to 2024
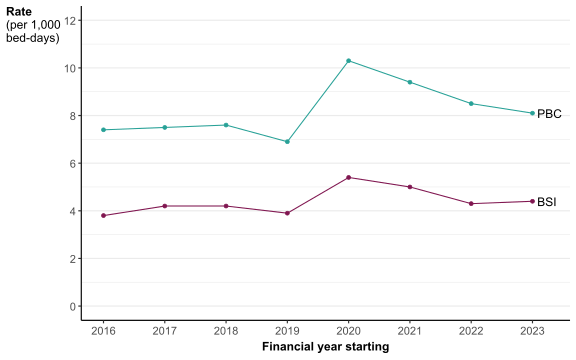
Figure 2. Rates of ICU-associated bloodstream infections (ICU-BSI) per 1,000 bed-days over 2 nights) across all ICUs, England: between FY 2016 to 2017 and FY 2023 to 2024
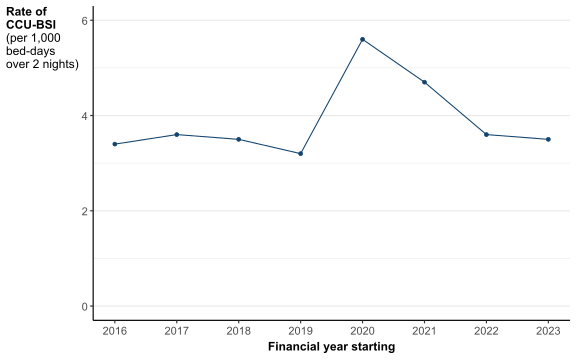
Table 1. Counts and rates of positive blood cultures (PBC), bloodstream infections (BSI) and ICU-associated bloodstream infections (ICU-BSI), across all ICUs, England: between FY 2016 to 2017 and FY 2023 to 2024
| Financial year | Total bed-days | Count of PBC | Rate of PBC per 1,000 bed-days | Count of BSI | Rate of BSI per 1,000 bed-days | Percentage of PBC meeting the definition of BSI | Total bed-days over 2 nights | Count of ICU-BSI | Rate of ICU-BSI per 1,000 bed-days over 2 nights |
|---|---|---|---|---|---|---|---|---|---|
| 2016 to 2017 | 174,196 | 1,289 | 7.4 | 660 | 3.8 | 51.2% | 120,777 | 407 | 3.4 |
| 2017 to 2018 | 413,325 | 3,098 | 7.5 | 1,726 | 4.2 | 55.7% | 302,980 | 1,085 | 3.6 |
| 2018 to 2019 | 456,806 | 3,453 | 7.6 | 1,898 | 4.2 | 55.0% | 338,078 | 1,172 | 3.5 |
| 2019 to 2020 | 468,050 | 3,248 | 6.9 | 1,812 | 3.9 | 55.8% | 349,591 | 1,129 | 3.2 |
| 2020 to 2021 | 402,197 | 4,145 | 10.3 | 2,191 | 5.4 | 52.9% | 315,079 | 1,757 | 5.6 |
| 2021 to 2022 | 424,713 | 3,980 | 9.4 | 2,142 | 5.0 | 53.8% | 323,906 | 1,538 | 4.7 |
| 2022 to 2023 | 486,598 | 4,124 | 8.5 | 2,101 | 4.3 | 50.9% | 369,384 | 1,333 | 3.6 |
| 2023 to 2024 | 512,818 | 4,173 | 8.1 | 2,232 | 4.4 | 53.5% | 385,713 | 1,341 | 3.5 |
The rate of PBCs initially remained stable with some fluctuation between 6.9 and 7.6 per 1,000 bed-days, before a peak of 10.3 in FY 2020 to 2021. A similar trend was observed for BSIs and ICU-BSIs, with rates of BSIs fluctuating between 3.8 and 4.2 per 1,000 bed-days, before peaking at 5.4 in FY 2020 to 2021. Rates of ICU-BSIs fluctuated between 3.2 and 3.6 per 1,000 bed-days over 2 nights, before peaking at 5.6 in FY 2020 to 2021.
Data from FY 2023 to 2024 suggests that these rates have returned to pre-pandemic levels with rates of PBCs reducing to 8.1 per 1,000 bed-days, BSIs to 4.4 per 1,000 bed-days, and ICU-BSIs to 3.5 per 1,000 bed-days over 2 nights.
Blood culture positivity
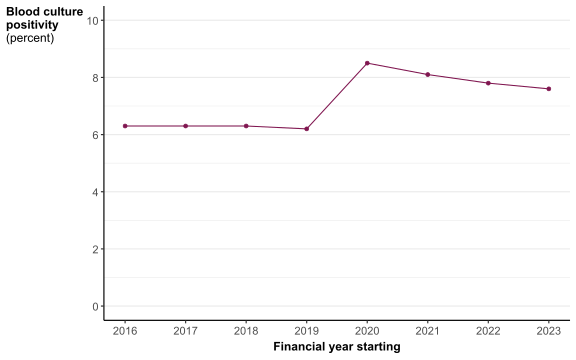
The blood culture positivity was stable at 6.2% to 6.3% up to FY 2019 to 2020. It increased to 8.5% in the following FY, corresponding to the start of the COVID-19 pandemic, and has since decreased to 7.6% in FY 2023 to 2024 (Figure 3).
Figure 3. Blood culture positivity, across all ICUs, England: between FY 2016 to 2017 and FY 2023 to 2024
Skin commensals and polymicrobial infections
Between May 2016 and March 2024, skin commensals were isolated from approximately half of all PBCs; of these, more than 95% did not meet the BSI definition (Table 2). In most cases, this was due to a repeat blood culture not being taken or reported, possibly because the initial result was attributed to contamination. The data presented in this report may therefore underestimate the true number of BSIs caused by skin commensals.
A polymicrobial infection is defined as multiple organisms growing from blood cultures taken on the same day. The percentage of polymicrobial infections of all PBCs remained approximately 10% from FY 2016 to 2017 until FY 2020 to 2021, when it increased to 14.0%. Since then, the percentage of polymicrobial infections has decreased to 13.0% in FY 2022 to 2024 (Table 2). Since FY 2019 to 2020 there has been an increase in the percentage of polymicrobial infections that were only positive for skin commensals (from 14.8% to 31.5% in FY 2023 to 2024).
Table 2. Skin commensal and polymicrobial infections as a percentage of positive blood cultures (PBC) across all units between FY 2016 to 2017 and FY 2022 to 2024
| Financial year | Count of PBC | Count of skin commensals | Percentage of PBC caused by skin commensals | Count of skin commensals which met the BSI case definition | Percentage of PBC caused by skin commensals which met the BSI case definition | Count of polymicrobial infections | Percentage of PBC with a polymicrobial infection |
|---|---|---|---|---|---|---|---|
| 2016 to 2017 | 1,289 | 636 | 49.3% | 20 | 1.6% | 139 | 10.8% |
| 2017 to 2018 | 3,098 | 1,347 | 43.5% | 45 | 1.5% | 299 | 9.7% |
| 2018 to 2019 | 3,453 | 1,589 | 46.0% | 68 | 2.0% | 334 | 9.7% |
| 2019 to 2020 | 3,248 | 1,435 | 44.2% | 61 | 1.9% | 364 | 11.2% |
| 2020 to 2021 | 4,145 | 2,072 | 50.0% | 89 | 2.1% | 582 | 14.0% |
| 2021 to 2022 | 3,980 | 1,879 | 47.2% | 91 | 2.3% | 508 | 12.8% |
| 2022 to 2023 | 4,124 | 2,116 | 51.3% | 80 | 1.9% | 504 | 12.2% |
| 2023 to 2024 | 4,173 | 2,066 | 49.5% | 89 | 2.1% | 543 | 13.0% |
Adult units
Incidence
PBCs, BSIs and ICU-BSIs
Trends in rates of PBCs, BSIs and ICU-BSIs in adult ICUs were similar to those described across all ICU unit types in the Overview of infections across all unit types section of this report.
In FY 2023 to 2024, there were 4,071 PBCs reported (8.6 per 1,000 bed-days) in adult units, of which 2,200 (54.0%) were considered BSIs (4.7 per 1,000 bed-days). A total of 1,318 occurred in patients who had been in the ICU for over 2 nights and were therefore considered ICU-BSIs (3.8 per 1,000 bed-days over 2 nights – see supplementary Table S2).
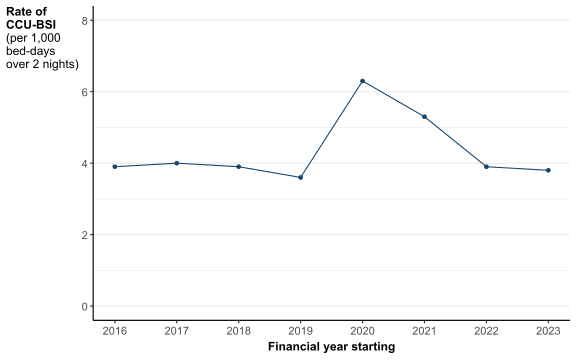
The rate of PBCs initially varied between 7.5 and 8.7 per 1,000 bed-days from FY 2016 to 2020, before a peak of 11.1 in FY 2020 to 2021. When comparing the same periods, rates of BSIs fluctuated between 4.3 and 4.7 per 1,000 bed-days, before peaking at 6 in FY 2020 to 2021 (supplementary Table S2, Figure 4). The rate of ICU-BSIs varied between 3.6 and 4 per 1,000 bed-days over 2 nights from FY 2016 to 2020, before peaking at 6.3 in FY 2020 to 2021 (supplementary Table S2, Figure 5). As described in the Overview section, these peaks in incidence coincided with the beginning of the COVID-19 pandemic and are presumed to have been partly overestimated due to concurrent underreporting of occupied bed-days (denominators) to our surveillance programme (Table 2). NHS England statistics highlight that adult intensive care activity increased during this period, with a surge in capacity and occupancy in existing ICUs and repurposed clinical areas.
Rates declined from FY 2021 to 2022 for all 3 metrics, with data from FY 2023 to 2024 observing a return to pre-pandemic levels. Rates of PBCs were 8.6 per 1,000 bed-days, and rates for BSIs were 4.7 per 1,000 bed-days. The rate of ICU-BSIs was 3.8 per 1,000 bed-days over 2 nights.
Figure 4. Rates of positive blood cultures (PBC) and bloodstream infections (BSI) per 1,000 bed-days, in adult ICUs, England: between FY 2016 to 2017 and FY 2023 to 2024
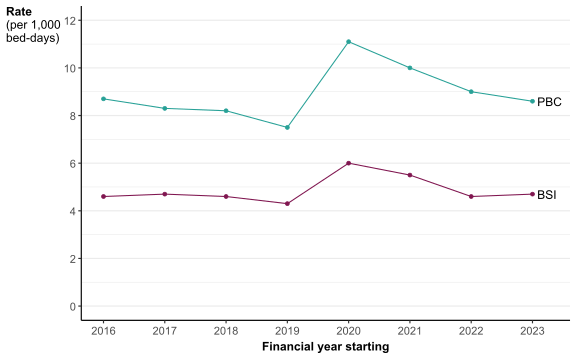
Figure 5. Rates of ICU-associated bloodstream infections (ICU-BSI) per 1,000 bed-days over 2 nights), in adult ICUs, England: between FY 2016 to 2017 and FY 2023 to 2024
CL-associated infections
ICU-associated central line BSIs (ICU-CL–BSIs) are ICU-BSIs that occur after exposure to a CL with either evidence of CL infection (central line-related BSI, CLRBSI) or lack of evidence of infection at any other body site (central line-associated BSI, CLABSI), or both (see the Glossary).
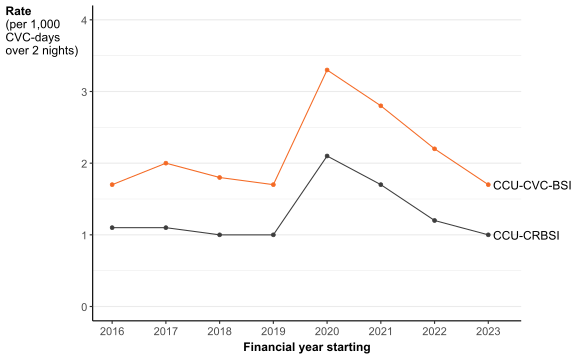
Trends in rates of ICU-CL-BSI in patients in the unit for over 2 nights with at least one CL in place (CL days over 2 nights) were similar to those seen for other outcomes described above within adult ICUs. In FY 2023 to 2024, there were 359 (27.2% of all ICU-BSIs) cases classified as ICU-CL-BSIs (1.7 per 1,000 CL bed-days over 2 nights) in adult units. Of these ICU-CL-BSIs, 238 (66.3%) were considered CLABSIs (1.1 per 1,000 CL bed-days over 2 nights) and 209 (58.2%) were considered CLRBSIs (1.0 per 1,000 CL bed-days over 2 nights).
The rate of ICU-CL-BSIs initially varied between 1.7 and 2.0 per 1,000 CL-days over 2 nights between FY 2016 to 2017 and FY 2019 to 2020. This was before a peak of 3.3 in FY 2020 to 2021, dropping to 1.7 in FY 2023 to 2024.
The rate of CLABSIs varied between 1.1 and 1.4 per 1,000 CL bed-days over 2 nights before peaking at 1.8 in FY 2020 to 2021, before dropping to 1.1 in FY 2023 to 2024. The rate of CLRBSIs varied between 1.0 and 1.1 per 1,000 CL bed-days over 2 nights, before peaking at 2.1 in FY 2020 to 2021, then reducing to 1.0 in FY 2023 to 2024 (Figure 6, supplementary Table S3).
Figure 6. Rates of ICU-associated central line bloodstream infections (ICU-CL-BSI) and central line-related BSI (CLRBSI) per 1,000 CL-days over 2 nights, in adult units, England: between FY 2016 to 2017 and FY 2023 to 2024
Organism distribution
The dominant organisms isolated from PBCs during FY 2023 to 2024 were coagulase-negative Staphylococci (CoNS), with a count of 2,046 (44.0% of total) (supplementary Table S6).
Most organisms identified as BSIs during FY 2023 to 2024 were Gram-negative bacteria (supplementary Table S7): 380 E. coli (15.8%, 8.1 per 10,000 ICU bed-days), 336 Klebsiella spp. (14.0%, 7.1), 192 other Enterobacteriaceae (8.0%, 4.1), 120 P. aeruginosa (5.0%, 2.5), 66 Serratia spp. (2.7%, 1.4), 30 Acinetobacter spp. (1.2%, 0.6) and 105 other Gram-negative bacteria (4.4%, 2.2). There were 309 BSIs caused by S. aureus (12.8%, 6.5 per 10,000 ICU bed-days) and 93 caused by C. albicans. (3.9%, 2.0). CoNS constituted only a small percentage of all organisms meeting the BSI criteria (82 cases, 3.4%, 1.7 per 10,000 ICU bed-days). In most cases, this was because there were no reported clinical manifestations of systemic infection or no reported repeat positive blood culture within 48 hours. 1 in 4 blood cultures which were positive for CoNS and did not meet the BSI case definition required antibiotic treatment (25.6%, 420 out of 1,643 cases with non-missing treatment data). This suggested that clinicians considered them to be possible infections rather than contamination.
The organism distribution of ICU-BSIs was similar to that of all BSIs. However, E. coli was less common (151 cases, 10.5% of total), while Enterococcus spp., Klebsiella spp. and Candida spp. were more frequent, at 14.4%, 15.5%, and 4.9%, respectively (Figure 7 and supplementary Table S8).
Klebsiella spp. and Enterococcus spp. were the most frequent organisms identified in ICU-CL-BSI, with 57 cases and at 14.7%, and with 44 cases and at 11.4%, respectively (supplementary Table S9).
Rates of ICU-BSI by organism have stayed relatively stable since the start of surveillance in FY 2016 to 2017. However, during FY 2020 to 2021, the rates of Klebsiella spp., Enterococcus spp. and other Gram-negative cases increased. These figures reverted to previous trends in the following years (Figure 7, supplementary Table S8).
Figure 7 shows organisms aggregated in 10 key groups. A more detailed breakdown of the ‘Other Gram-negative’, ‘Candida spp.’ and ‘Other’ groups is presented in supplementary Tables S6 to S9.
Figure 7. Rate of ICU-associated BSIs per 10,000 bed-days, by organism group, adult ICUs, England, between FY 2016 to 2017 and FY 2023 to 2024
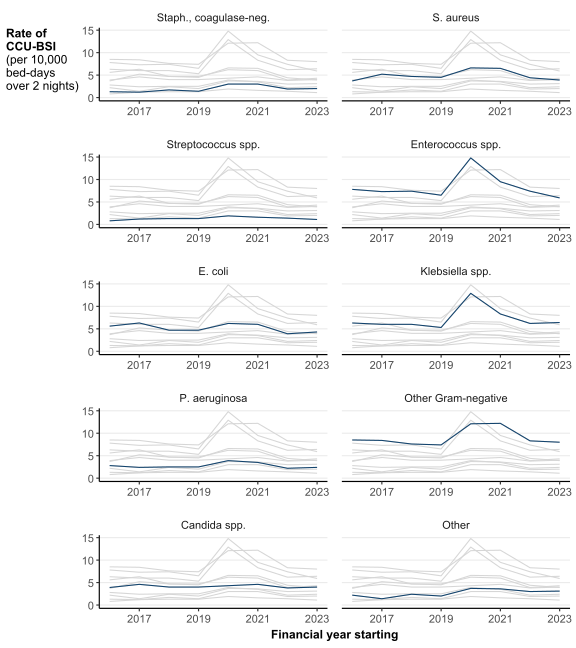
Note 1: in Figure 7, each dark blue line represents the rate for the listed organism, while the lighter grey lines show all other organisms, for ease of comparison.
CL utilisation
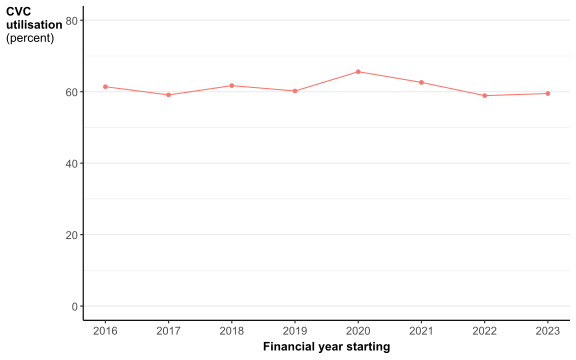
CL utilisation refers to the number of ICU patient-days with a CL inserted as a percentage of the number of ICU patient-days (over 2 nights).
In adult units, CL utilisation was relatively stable between May 2016 and March 2020, varying between 59.1% and 61.4%, before rising to 65.6% in FY 2020 to 2021. This has since decreased (Figure 8, supplementary Table S3).
Figure 8. Central line utilisation (%) in adult ICUs, England: between FY 2016 to 2017 and FY 2023 to 2024
Regional trends
The region with the highest average ICU-BSI rate in adult ICUs across the reporting period was the Midlands (5.8 ICU-BSIs per 1,000 bed-days over 2 nights), while the lowest average rate was seen both in the North West and the South West (3.6 ICU-BSIs per 1,000 bed-days over 2 nights). This was compared with a national average of 4.3 ICU-BSIs per 1,000 bed-days over 2 nights (Figure 9).
Figure 9. Rates of ICU-associated bloodstream infections (ICU-BSI) per 1,000 bed-days across NHS reporting regions for adult ICUs, England: between FY 2016 to 2017 and FY 2023 to 2024
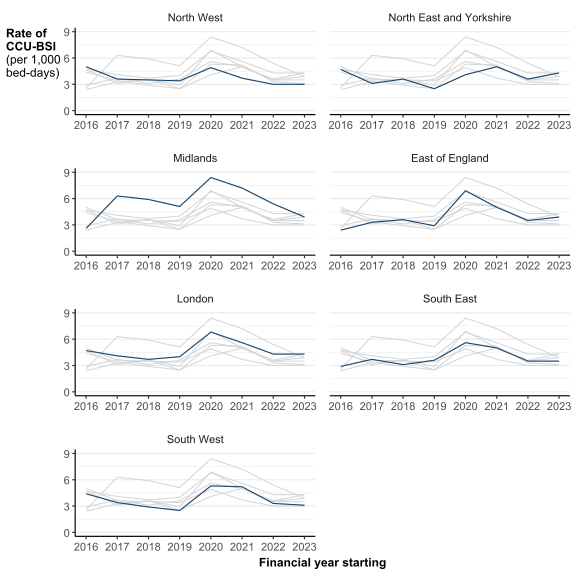
Note 1: in Figure 9, each dark blue line represents the rate for the listed NHS England region, while the lighter grey lines show all other regions, for ease of comparison.
Mortality
A total of 24,613 (96.6%) patient records reported to ICCQIP for adult ICUs were successfully traced via the NHS Digital Demographics Batch Service (supplementary Table S14).
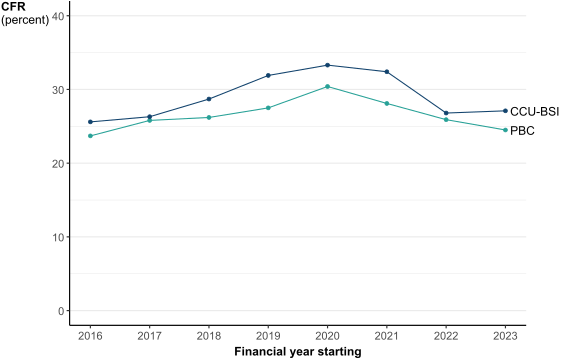
Across all outcomes studied in adult ICUs, there was a trend of all-cause 30-day case fatality rate (CFR) increasing to a peak in FY 2020 to 2021, coinciding with the beginning of the COVID-19 pandemic. There was a return to pre-pandemic levels by FY 2023 to 2024 (Figure 10).
Among patients with ICU-BSIs in adult ICUs the CFR rose steadily from 25.6% in FY 2016 to 2017 to 33.3% in FY 2020 to 2021, before reducing to 27.1% in FY 2023 to 2024.
Figure 10. Thirty-day all-cause case fatality rate (CFR, %) of patients with positive blood cultures (PBC) and ICU-associated bloodstream infections (ICU-BSI), in adult ICUs, England: between FY 2016 to 2017 and FY 2022 to FY 2023 to 2024
Paediatric and neonatal units
Results for paediatric and neonatal ICUs differed considerably from those described across all ICUs in the ‘Overview’ section of this report. Given the low participation rates of paediatric and especially neonatal ICUs in this surveillance programme (supplementary Table S1), it is important to interpret the results from these groups with caution.
More detailed results are available in the Supplementary results for pediatric and neonatal units report and in supplementary Tables S2, S3, S6 to S13.
Paediatric units
Between May 2016 and March 2024, 385 PBCs were reported by participating paediatric units, corresponding to an incidence of 3.4 PBCs per 1,000 bed-days. This corresponded to 118 ICU-BSIs and an incidence rate of 1.9 ICU-BSIs per 1,000 bed-days over 2 nights.
Most organisms that caused ICU-BSIs in paediatric units during the surveillance period were Gram-negative bacteria (60.3%, mostly Enterobacteriaceae), whilst 32.1% were Gram-positive bacteria (in particular, Enterococcus spp. and S. aureus), and 3.1% were Candida spp.
CL utilisation during the surveillance period ranged between 52.0% and 56.6%, which was consistently slightly lower than adult units and higher than neonatal units.
Neonatal units
Between May 2016 and March 2024, 860 PBCs were reported by participating neonatal units, corresponding to an incidence of 3.1 PBCs per 1,000 bed-days. This corresponded to 192 ICU-BSIs and an incidence of 0.7 ICU-BSIs per 1,000 bed-days over 2 nights.
Unlike adult and paediatric units, most organisms that caused ICU-BSI in neonatal units during the surveillance period were Gram-positive bacteria (57.9%, especially CoNS and S. aureus), whilst 41.6% were Gram-negative bacteria (mostly Enterobacteriaceae). No Candida spp. ICU-BSIs were reported.
CL utilisation ranged between 20.5% and 26.9% during the surveillance period. This was consistently lower than in adult and paediatric units.
Discussion on ICU-BSI trends
This report summarises ICCQIP surveillance data on BSIs in English ICUs between May 2016 and March 2024.
For adult ICUs, which represent the largest proportion of all the cases submitted, rates for ICU-BSIs and ICU-CL-BSIs remained largely stable from the beginning of surveillance in FY 2016 to 2017, except for a steep rise that coincided with the first year of the COVID-19 pandemic. Since then, both metrics have returned to pre-pandemic levels. Most of the NHS England regions followed these national rate trends. The surge in intensive care occupancy rates and changes to infection prevention and control procedures, patient characteristics, patient care and reporting practices during COVID-19 are possibly associated with this change. Adult units may also have underreported the number of patients in ICUs during this period, therefore, the actual infection rate during the early stages of the COVID-19 pandemic may have been lower than estimated. The CDC also reported a significant increase in the incidence of CL-BSIs during periods of high COVID-19 hospitalisations in the US. The incidence of ICU-BSIs throughout the surveillance period was lower in neonatal and paediatric when compared to adult units (0.7, 1.9 and 4.3 ICU-BSI per 1,000 bed-days over 2 nights, respectively).
The use of CLs in ICUs is a known risk factor in bloodstream infections, as reported in the ‘Matching Michigan’ study. In adult units, CL utilisation varied between 58.9% and 65.6%, with a temporary peak during FY 2020 to 2021. CL utilisation in paediatric and especially neonatal units was lower. The ECDC published data on healthcare-associated infections in intensive care for 2016, 2017, 2018, 2019 and 2020. We report consistently lower CL utilisation in English adult ICUs compared to Italy, Poland, and Spain, and similar utilisation rates to France and Scotland. Direct comparisons of CLABSI rates are challenging due to differences in how results are reported: ECDC presents median rates across all reporting units in each country, whereas this report uses national aggregate rates. Nevertheless, England’s aggregate rates are consistently lower than the median rates in Polish, Italian, Spanish, and French units.
Gram-negative bacteria comprised 50.6% of organisms associated with the ICU-BSIs in adult units, followed by Gram-positive bacteria (39.0%) and Candida spp. (8.7%). Gram-negative bacteria also constituted the majority of ICU-BSI isolates in paediatric units but less common in neonatal units, where most bacteria causing ICU-BSI were Gram-positive . For Klebsiella spp. and Enterococcus spp., the incidence of BSI associated with intensive care peaked during FY 2020 to 2021. This was while overall incidence rates across England, including community-onset and ward-onset cases, remained stable, as noted in the 2022 to 2023 ESPAUR. This discrepancy may be linked to the effects of the start of the COVID-19 pandemic, which were particularly pronounced in the intensive care setting.
The ICU-BSI case fatality rate in adult units slightly increased in FY 2020 to 2021 but reduced back to approximately pre-pandemic levels in FY 2022 to 2023.
Participation in this surveillance programme is voluntary and showed variation across the years. The estimated coverage of units across the country in FY 2023 to 2024 was 42.6% of the total adult units in England, 17.4% for paediatric and 3.9% for neonatal units. This limits the conclusions that can be drawn for paediatric and neonatal units and the comparisons that can be made between years. We are exploring improvements to data coverage for the programme whilst reducing data entry workload. Units participating in ICCQIP benefit from a standardised tool that enables the comparison of outcomes to units across England.
ICUs have a higher incidence of BSIs compared to other hospital wards. Surveillance data can be used to identify targets and monitor quality improvement interventions. The ICCQIP will continue to conduct surveillance activities on BSIs in intensive care and aims to improve the utility of outputs based on stakeholder feedback: complete this short survey to have your say.
Glossary
Bloodstream infection (BSI)
A BSI is a recognised pathogen isolated from at least one blood culture, or a skin commensal isolated from blood cultures drawn on separate occasions and taken within a 48-hour period and the presence of age-specific symptoms (only one culture is required for skin commensals in neonatal units). Please note that this is not synonymous with ‘sepsis’, which is variously defined and usually indicates a life-threatening response to an infection originating from any site of the body.
Central line-associated BSI (CLABSI)
A BSI that occurred when there was a CL in situ at the time of sampling (or a CL was removed in the 48 hours preceding sampling) and was not thought to be secondary to an infection at another site.
Central line-related BSI (CLRBSI)
A BSI that occurred when there was a CL in situ at the time of sampling (or a CL was removed in the 48 hours preceding sampling) and there was microbiological evidence of CL infection or clinical improvement after central line removal (see surveillance protocol for details).
ICU-associated BSI (ICU-BSI)
A BSI is considered ICU-BSI if the patient has been in the ICU for over 2 nights after the date of ICU admission when the positive blood culture sample was taken.
Central line (CL)
CLs are plastic tubes inserted in a large blood vessel for treatment and monitoring purposes; however, they can increase the risk of developing a bloodstream infection. This also includes peripherally inserted central lines and haemodialysis lines. CLs can be short term or long term.
ICU-associated central line BSI (ICU-CL-BSI)
A ICU-BSI is considered ICU-CL-BSI if it is CL-associated (CLABSI), CL-related (CLRBSI), or both.
CL utilisation
CL utilisation is a percentage that indicates the proportion between:
- the total number of days on which patients who are admitted to the ICU for more than 2 nights have a CL in situ
- the total number of days on which patients have been admitted to the ICU for more than 2 nights
Intensive care unit (ICU)
ICUs are hospital units providing intensive or high dependency care for adults, intensive care at level 3 for paediatric patients, level 2 and level 3 care for neonatal patients.
Financial year (FY)
A FY is the 12-month period between 1 April to 31 March in the years stated (for example, ‘FY 2022 to 2023’ refers to 1 April 2022 to 31 March 2023).
Polymicrobial infection
An infection is considered polymicrobial is multiple organisms are grown from the same blood culture set, or from more blood culture sets taken on the same day.
Skin commensals
Skin commensals are microorganisms that reside on the human skin, normally without causing harm. For the purposes of ICCQIP surveillance, these are Aerococcus spp., Bacillus spp. other than B. anthracis, coagulase-negative staphylococci (including S. epidermidis and S. haemolyticus), Corynebacterium spp., Micrococcus spp., Propionibacterium spp., and viridans group streptococci.
More details are available in the ICCQIP surveillance protocol. Please note that in the protocol, ‘ICU’ corresponds to ‘ICU’ as referenced in this document.
Data sources and methodology
Our data sources and methodology are outlined in the separate QMI report.
Background information
Patients in intensive care have a higher risk of developing bloodstream infections compared to those in other wards. This is due to a combination of factors, including disease severity, comorbidity, the need to undergo invasive procedures, and medications. The prevalence of healthcare-associated infections (HCAI) is higher in intensive care compared to other wards, as highlighted by the 2016 point prevalence survey in England, which found HCAI prevalence in adult ICUs to be 21.2%, compared to 6.9% across all hospital wards.
The impact of HCAIs on morbidity, mortality, length of stay, and cost is well documented in Eber et al. 2010. Many interventions have been developed to reduce HCAI incidence as seen in Johnson et al. 2012, although most interventions in England have historically been focussed on reductions in the incidence of specific organisms (predominantly meticillin-resistant Staphylococcus aureus (MRSA) bacteraemia and Clostridioides difficile infection) rather than more generally on the ICU setting or device related infections. In April 2009, a 2-year programme was launched in England called the ‘Matching Michigan’ study which aimed to reduce central line-related BSIs. This name referenced an earlier American study (Pronovost et al. 2006) which demonstrated a large reduction in CL-related BSI using a range of technical and behavioural interventions. The Matching Michigan study observed a 60% reduction in ICU-CL-BSI rates in adult ICUs after the intervention, with a smaller (48%) non-significant reduction in paediatric rates. However, the effects of the intervention were difficult to disentangle from a wider secular trend of declines in rates of BSIs associated with a range of interventions over time. Matching Michigan and a parallel ethnographic study identified the need for a more systematic collection and reporting of infection data (Bion et al. 2013, Dixon-Woods et al. 2013) and following this conclusion the ICCQIP was developed to act on the recommendations highlighted in the Critical eye report.
ICCQIP, a group of professionals from across the NHS, charities, and the UKHSA, was established in 2012 to develop a national surveillance and quality improvement programme for HCAIs in the intensive care setting. An initial survey of ICUs in England was conducted to gather opinion on priorities and potential data collections as reported in the Critical eye report. The results showed considerable support for surveillance of infections in ICUs with ICU-CL-BSIs highlighted as the main priority. Selected sentinel units were invited to participate in May 2016. In November 2016, the invitation to participate was expanded nationwide.
Related statistics
UKHSA also publishes quarterly reports based on data from the ICCQIP surveillance programme. The quarterly reports contain data for the previous 7 quarters (21 months) and cannot be used to look at the longer-term trends discussed in this report. The quarterly reports can be downloaded from the website of the Faculty for Intensive Care Medicine (FICM).
The quarterly reports contain count and rate information on PBCs, BSIs, ICU-BSIs and ICU-CL-BSIs, as well as the same rate denominators used in this report. They also contain data on CL utilisation, as well as the distribution of organisms in PBCs. Unlike this report, the quarterly reports do not include mortality data, nor do they report rates stratified by reporting region. Additionally, the quarterly reports only include tables and figures, with minimal commentary.
The primary intended audience of the quarterly reports include commissioners, administrators, managers and clinical staff at the ICUs participating in the programme, as well as a broader range of stakeholders from across hospitals and trusts around the country, including patients and those not currently participating in ICCQIP.
The reports contain data that can allow benchmarking of infection rates against other ICUs. Along with the main reports, available from the FICM, each participating unit also receives a tailored report, comparing their own data against the national averages for their unit type (that is adult, paediatric, neonatal unit).
Data for all cases of bacteraemia caused by MRSA, MSSA, E. coli, Klebsiella spp. and P. aeruginosa across all hospital wards (including ICUs) and the community are collected separately and reported regularly by UKHSA, as monthly tables and quarterly and annual reports. The most recent annual report covers data for the FY ending 31 March 2024.
There is no similar data for England collected or reported by other government departments. The Surveillance of Healthcare Associated Infections in Scottish Intensive Care Units programme collects data from Scottish ICUs on BSIs as well as pneumonia and CL-related infections. To our knowledge, the most recent report was published by Health Protection Scotland in 2019, covering data from 2018.
Further information and contact details
Feedback and contact information
Please complete this brief feedback survey. Your comments on this year’s report will help us improve its future versions.
You can contact us by emailing ICCQIP.surveillance@ukhsa.gov.uk
Acknowledgements
This surveillance programme would not be possible without the contribution of intensive care staff across England who submit the necessary data. We also acknowledge the support and advice provided by the ICCQIP oversight group members.
Official statistics in development
These statistics are labelled as Official Statistics in Development (previously termed ‘experimental statistics’). Official statistics in development are developed under the guidance of the Head of Profession for Statistics. The goal is to develop statistics that can, in due course, be produced to the standards of the Code of Practice for Statistics. This statement provides further detail on the nature of the development and how we are continuing to assess these statistics against the Code of Practice.
While the current statistics undergo a standardised quality assurance process, there are some known limitations, as outlined in the specific data caveats section in the QMI report. This includes a low participation rate for intensive care units (particularly in paediatric and neonatal units) across England in the ICCQIP surveillance programme, which impacts the generalisability of findings.
There is a need for this data to be published as they provide the national trends of annual bloodstream infections in intensive care unit patients. This data aims to inform efforts to improve patient safety in intensive care settings and provide insights into organism distribution, associated factors, regional trends and mortality. Therefore, these statistics are published as Official Statistics in Development to meet user needs, whilst being transparent on potential data quality concerns.
During the next 12 months, the ICU surveillance team at UKHSA will:
- explore data collection improvements that will increase national programme coverage, focusing on paediatric and neonatal units
- consult with key stakeholders to understand the usage of the statistics
The results of these actions will be used to inform the decision regarding the publication status of the 2024 to 2025 ICU AEC surveillance data as official statistics.
Our statistical practice is regulated by the Office for Statistics Regulation (OSR). The OSR sets the standards of trustworthiness, quality and value in the Code of Practice for Statistics that all producers of official statistics should adhere to.
You can contact us directly by emailing ICCQIP.surveillance@ukhsa.gov.uk with any comments about how we meet these standards. Alternatively, you can contact OSR by emailing regulation@statistics.gov.uk or via the OSR website.