Longitudinal Small Business Survey 2025: SME employers (businesses with 1 to 249 employees)
Published 15 October 2026

© Crown copyright 2026
This publication is licensed under the terms of the Open Government Licence v3.0 except where otherwise stated. To view this licence, visit nationalarchives.gov.uk/doc/open-government-licence/version/3 or write to the Information Policy Team, The National Archives, Kew, London TW9 4DU, or email: psi@nationalarchives.gov.uk.
Where we have identified any third party copyright information you will need to obtain permission from the copyright holders concerned.
This publication is available at https://www.gov.uk/government/statistics/small-business-survey-2025-businesses-with-employees/longitudinal-small-business-survey-2025-sme-employers-businesses-with-1-to-249-employees
1. Headline findings
This edition of the Longitudinal Small Business Survey (LSBS) is the 11th wave that has been completed since 2015. The report covers a broad range of topics that provide insights on small and medium-sized enterprise (SME) performance and the factors that affect this. This report presents results for businesses with employees.
Fewer SME employers reported employment growth in the last 12 months compared with the past 2 years, and the percentage expecting to employ fewer people in the next 12 months was also lower than previously.
Turnover growth during the last 12 months was also less likely to be reported than in the past 3 years, although SME employers were more optimistic for future growth and were not significantly less likely to have generated a profit in the last 12 months than previously.
In 2025, as in 2024, the most frequently reported obstacle to growth for SME employers was taxation, VAT, PAYE, National Insurance and business rates. The level of energy prices remained the next most frequently mentioned obstacle to business success in 2025, followed by regulations/red tape and market competition.
Over the last 4 years there has been an upward trend in SME employers using technologies or web-based software to sell to customers or manage the business and this continued to be the case in 2025.
2. Summary of highlights from sections
2.1 Business performance
In 2025, SME employers were as likely to report a decrease in the number employed as they were to report an increase (22% compared with 23%). The percentage reporting an increase was lower than in 2024 (down 1 percentage point) and in 2023 (down 6 percentage points).
SME employers were less likely to expect to employ more people in a year’s time and more likely to expect to employ fewer, suggesting a net loss of staff overall.
The downward trend in sales (turnover) growth reported since 2022 continued, with fewer SME employers reporting sales growth in the last 12 months than over the last 3 years (34%, 36% in 2024 and 40% in 2023), while the percentage reporting a reduction in sales increased (31%, 30% in 2024 and 27% in 2023).
There was little change in the outlook for growth among SME employers compared with 2024, with those expecting sales growth in the next 12 months remaining the same (31% as in 2024 and 38% in 2023) and similarly, no change in the proportion expecting turnover to fall in the next 12 months (17% in 2024 and 13% in 2023).
In 2025, there was little change in the percentage of SME employers reporting a profit or surplus in the last financial year compared with the last 2 years (76% in 2025, 77% in 2024 and 78% in 2023).
2.2 Exporting
Overall, 18% of SME employers had exported in the last 12 months, an increase of 1 percentage point on 2024. Fewer exporters expected to increase their level of exporting over the next few years in 2025 than previously (46%, 51% in 2024, 55% in 2023).
Over the last 3 years, there has been little change in the proportion of SME employers who do not currently export who have plans to start doing so (2% of all SME employers in 2025; 3% in 2024 and 4% in 2023). Not having a product or service suitable for export was the main reason for not considering exporting. Among non-exporters, 88% said this was the case in 2025 (up by 17 percentage points on 2024).
Of those SME employers that exported, 72% had made overseas sales every year since they started exporting. This compared with 73% in 2024 and 79% in 2023.
In 2025 the percentage of SME employers that directly imported goods or services increased (24%, 23% in 2024 and 20% in 2023). They were more likely than in 2024 to import from EU countries (19%, compared with 18% in 2024) and from non-EU countries (15%, compared with 13% in 2024).
2.3 Access to finance
Some 7 in 10 SME employers (70%) were using some form of external finance, a lower proportion than that reported in 2024 (72%) and 2023 (73%). First-time applications for finance fell to 16% from 23% in 2024.
The most used form of external finance in 2025, as it has been over the years, was credit cards (38%), followed by bank overdrafts (26%) and loans from financial institutions (21%). Use of loans fell in 2025 compared with 2024 (24%) but remained well above the level reported in 2023 (12%).
2.4 Innovation activity
In 2025, more SME employers reported having innovated – introduced new and improved processes, goods or services – than did so in 2024; 21% had innovated processes, 14% had innovated goods and 25% had innovated services (19%, 13% and 23% respectively in 2024; 21%, 15% and 26% respectively in 2023).
AI is used by 34% of SME employers that use any technology or web-based software (49% of medium-sized, 40% of small, and 32% of micro enterprises), the fourth most common software after booking software, Customer Relationship Management (CRM), and human resources (HR) systems.
2.5 Major obstacles to the success of the business
The main reported obstacle to growth for SME employers was taxation, VAT, PAYE, National Insurance and business rates (67%), a further increase on 2024 (61%) and 2023 (45%). It remained ahead of the level of energy prices (52% in 2025, 50% in 2024, 56% in 2023) and market competition (42%, 40% in 2024 and 48% in 2023).
The National Living Wage was reported as a major obstacle by SME employers (38%, up 7 percentage points on 2024, 11 percentage points on 2023) and was mentioned as frequently as staff recruitment and skills (38%). Workplace pensions were mentioned by 17%, up 5 percentage points on both 2024 and 2023 (12% in each).
The UK’s exit from the EU was considered an obstacle to growth by around 3 in 10 SME employers (29% in 2025, 31% in 2024, 30% in 2023).
2.6 Business support
Face-to-face delivery of information and advice has been sustained in 2025 (45% in 2025, 2024 and 2023).
2.7 Training
The percentage of SME employers that had arranged or funded training in the previous year increased 3 percentage points from 45% to 48% in 2025, returning to the level reported in 2019.
2.8 Taxation
Of all SME employers who were categorised as sole proprietors or partnerships, 94% reported that they were liable to submit returns to HM Revenue and Customs (HMRC) for income tax self-assessment. Of these, 69% used record keeping software, which was an increase on those reported to be doing so in 2024 (65%) and 2023 (61%).
2.9 Technology
In 2025, there continued to be an increase in SME employers using technologies or web-based software to either sell to customers or manage the business (74%, 69% in 2024 and 61% in 2023). Specifically, use of technologies for managing the business also continued to grow (70%, compared with 65% in 2024 and 54% in 2023).
2.10 Future plans
About 71% of SME employers aimed to grow sales over the next 3 years. SME employers with plans aimed at growing their business were most likely to be planning to increase workforce skills (59%) and recruit new staff in the UK (44%). Plans to work towards a carbon/greenhouse gas emission target fell by 9 percentage points to 30% (39% in 2024 and 44% in 2023).
2.11 Women-led businesses
Around 19% of SME employers were women-led (14% in 2024 and 15% in 2023). Compared with 2024, there was a decrease in the percentage of SME employers with a management team that represented men and women equally (22%, 26% in 2024) and little change in the percentage that were entirely male led (45%, 43% in 2024). The sectors most likely to have women-led businesses were health, education, other services, accommodation and food, administration and professional and scientific.
2.12 Minority Ethnic Group-led businesses
Around 6% of SME employers were led by a management team with at least half of its members from minority ethnic groups (MEG-led). This compared with 6% in 2024 and 7% in 2023.
2.13 Disability-led businesses
Some 5% of all SME employers were led by people with a disability (2% in 2024). Among SME employers with more than one owner, director or partner, 9% reported at least one of their senior team having a disability (as in 2024).
2.14 Veteran-led businesses
Some 3% of all SME employers were led by people who had served in the armed forces. This was asked for the first time in 2025.
3. What you need to know about these statistics
The Longitudinal Small Business Survey (LSBS) is a telephone survey of UK businesses in the private sector with fewer than 250 employees. (This definition treats full-time and part-time employees equally). This report summarises key findings from the 2025 survey (Year 11). It focuses on those businesses with between 1 and 249 employees (‘SME employers’), with a separate report on businesses without employees.
Separate reports are published because we use 3 separate sampling frames and because the estimates for businesses with no employees include a large proportion of businesses which are not registered for VAT or PAYE. For the SME employers we use the Interdepartmental Business Register (IDBR) from the Office for National Statistics (ONS), which has complete coverage of the population from VAT and PAYE records, whereas for the sample of businesses with no employees we use the IDBR, and both a commercial data provider and a commercial panel to include businesses not registered for VAT or PAYE.
The coverage of the unregistered business population is less well understood and small business who rely on word of mouth or platforms such as Facebook or Instagram are unlikely to be included in either of the sampling frames and therefore this should be considered when making comparison between the 2 reports. There is some guidance at the end of the report on the uncertainty that arises because we are using a sample of the UK SME population rather than collecting data from all of them. We refer to micro businesses which have 1 to 9 employees; small businesses which have 10 to 49 employees; and medium-sized businesses which have 50 to 249 employees.
In this report when we refer to business size this is defined entirely in terms of number of employees. Levels of turnover (sales) or assets are not part of our definition, though there are other definitions of business size which include these.
‘SMEs’ stands for ‘small and medium-sized enterprises’ – but this is always taken to include micro businesses and non-employers too. The LSBS covers all SMEs, not just small businesses, though this report only covers SME employers.
This is a longitudinal survey as we try to re-interview businesses (SME employers and businesses with no employees) each year – 245 businesses have taken part in all 11 years of the survey so far and another 5,832 businesses in 2025 had taken part in at least one previous survey (‘panellists’). In addition, there were 4,629 businesses new to the survey (‘top-ups’). The overall LSBS sample in 2025 was 10,481, including 8,042 SME employers, of which 20 were large employers (250 or more employees) and are not included in the sample of 8,022 SME employers that this report is based on.
Throughout the report, where figures sum to less than 100% when you expect them to sum to 100% (because they cover all possibilities) the shortfall will be due to businesses saying they did not know the answer, refusing to answer or this might be due to rounding of estimates to the nearest whole percentage.
Our respondents were each randomly assigned to one of 3 cohorts – A, B or C – and some questions were only asked of one cohort (though most questions went to all 3 cohorts). The underlying data tables that accompany this report group cohort questions separately, so the report and charts make clear when they are covering cohort questions, to allow you to find the corresponding data table if required.
4. Business performance
4.1 Changes in the levels of employment
In the data tables accompanying this publication, table 44 shows how many employees businesses had on their payrolls 12 months ago across all UK sites and table 45 shows how the size of the workforce has changed over the last 12 months.
In 2025, 22% of SME employers employed more people than a year previously (down 1 percentage point on 2024 and down 6 percentage points on 2023) while a similar proportion, 23% reported a decrease in employment (1 percentage point down on 2024 but 4 percentage points higher than in 2023).
In 2025, 55% stated they had made no change, 1 percentage point higher than in 2024 and 2 percentage points higher than in 2023.
Figure 1: Change in employment compared with 12 months previously (2015 to 2025; based on all SME employers trading for at least one year)
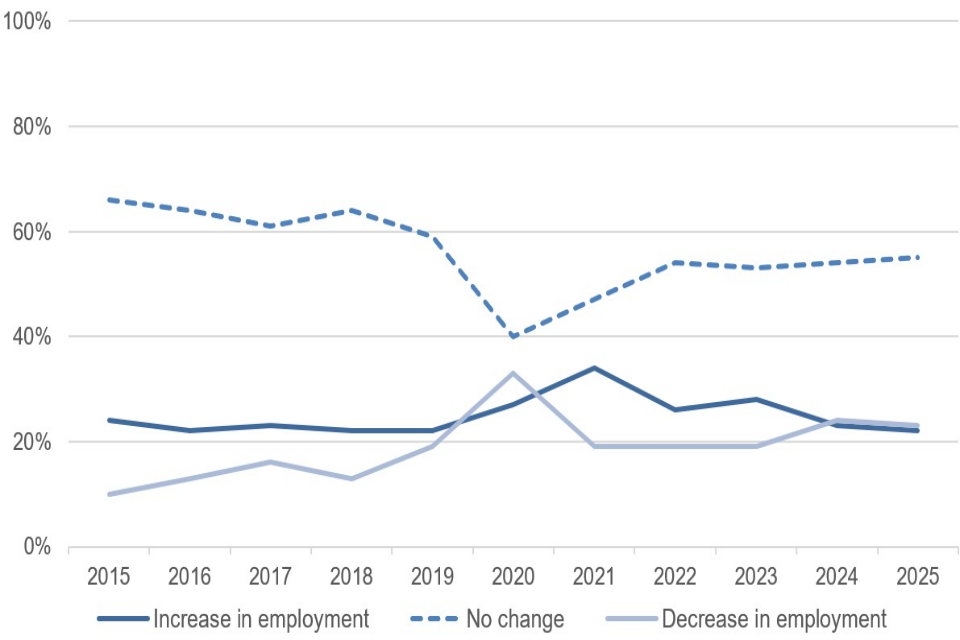
Figure note: In the 2016 to 2017 LSBS reports, figures were only shown for ‘panellists’ (those that had taken part in the previous year’s survey), based on the actual number of employees reported in the survey year, and the previous year. This was because those who did the survey for the first time in these years (‘top ups’) tended to approximate employment numbers more, and the datasets were not compatible. Between 2018 and 2024, as in 2015 and before, the ‘perceived’ change in employment question was asked of all respondents.
By business size, among micro businesses, compared with a year ago, 19% had increased employee numbers, 21% had fewer employees, and 60% had approximately the same number.
For small businesses, 35% had more employees, 32% had fewer, and 33% had the same. For medium-sized businesses, 45% had more employees, 30% had fewer and 25% had the same number.
By sector, those in finance and real estate (28%) and education (27%) were the most likely to have increased employee numbers. Those in manufacturing and accommodation and food (both 29%) were most likely to have reduced employee numbers.
By nation, there were similar levels of employment growth across England (22%), Scotland (22%) and Wales (24%), and Northern Ireland (25%). Within Northern Ireland, employment growth is down 7 percentage points on 2024, while there is little change in the other nations (no change in England and Wales, down 1 percentage point in Scotland).
SME employers in Northern Ireland were less likely than those in the other nations to report a reduction in employee numbers (20%, up 5 percentage points on 2024), compared with those in England (23%, up 3 percentage points), Scotland, (24%, up 1 percentage point) and Wales (26%, up 6 percentage points).
4.2 Expectations for employment growth
In the data tables accompanying this publication, table 46 shows how many employees the business expects to have on the payroll in 12 months’ time and table 47 shows how they expect the size of the workforce to change over the next 12 months.
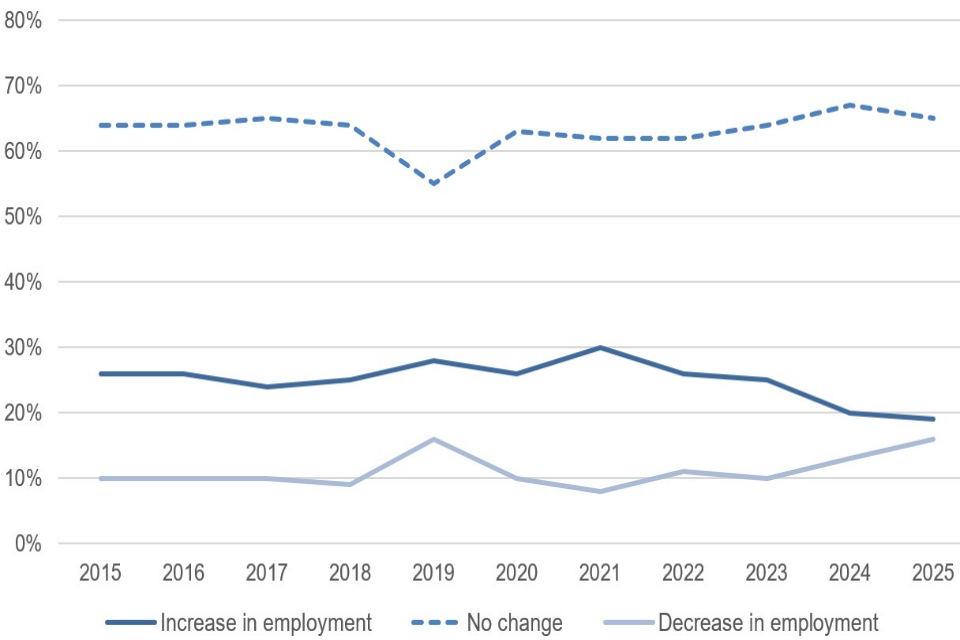
Looking ahead, 19% of SME employers expected to employ more people in a year’s time (down 1 percentage point on 2024, and down 6 percentage points on 2023); 65% expected to employ the same number (down 2 percentage points on 2024, up 1 percentage point on 2023) and 16% expected to employ fewer people (up 3 percentage points on 2024 and up 6 percentage points on 2023).
By size, 15% of micro businesses expected to increase the number of employees, compared with 32% of small businesses and 44% of medium-sized businesses (1 percentage point down on 2024 among micro and small businesses, 1 percentage point up on 2024 in medium-sized businesses). Medium-sized businesses were more likely than micro and small businesses to expect to have reduced employment in 12 months’ time (18%, compared with 15% of small and 16% of micro businesses).
By sector, expectations for employment growth were most likely in health (27%), information and communications (24%), manufacturing and administration (both 23%).
By nation, 22% of SME employers in Northern Ireland, 20% in Scotland, 19% in England, and 17% in Wales were confident that employment numbers would increase (26% in Northern Ireland, 22% in Scotland, 22% in Wales, and 19% in England in 2024). SME employers in Wales were most likely to expect a reduction in the number of employees (17%, up 3 percentage points on 2024), followed by those in England (16%, up 3 percentage points), Scotland (14%, up 4 percentage points), and Northern Ireland (9%, up 1 percentage point).
Figure 2: Expectations for employment in 12 months’ time, by year
4.3 Changes in levels of turnover
In the data tables accompanying this publication, table 137 shows the change in turnover compared with 12 months ago.
In 2025, 34% of SME employers reported turnover growth over the previous 12 months (2 percentage points down on 2024, 6 percentage points down on 2023).
In a similar trend, 31% of SME employers reported a decrease in turnover in 2025 (1 percentage point up on 2024, 4 percentage points up on 2023).
Medium-sized businesses were more likely than small and micro businesses to have reported turnover growth in the last 12 months (49%, 41% and 32%, respectively), while the corresponding figures reporting a decrease in turnover were 23%, 25% and 32%, respectively.
Figure 3: Current turnover compared with 12 months previously, by year (based on SME employers trading for at least one year)

The sectors most likely to report turnover growth were education (45%), information and communications (39%), finance and real estate (39%), and arts and entertainment (38%). Those most likely to report a decrease in turnover were professional and scientific (34%), primary, utilities, and mining sectors (33%), information and communications (33%), and administration (33%).
By nation, SME employers in England (33%) were less likely to have reported growth in turnover than those in Scotland (38%), Wales (37%), and Northern Ireland (36%). Those in England (32%) were more likely to report a fall in turnover than those in Wales (27%), Scotland (26%) and Northern Ireland (19%).
4.4 Expectations of turnover in 12 months’ time
In the data tables accompanying this publication, table 141 shows the expected change in turnover in 12 months’ time.
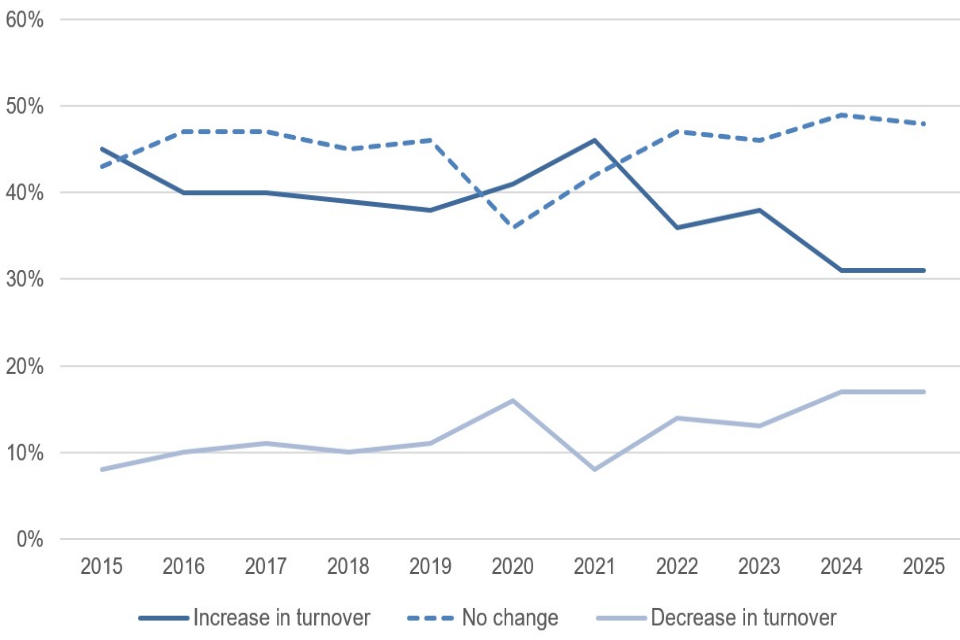
In 2025, 31% of SME employers expected an increase in turnover in the next 12 months (as in 2024, down 7 percentage points on 2023) while 17% expected a decrease (also as in 2024, up 4 percentage points on 2023) and 48% expected it to stay the same (1 percentage point down on 2024, 2 percentage points up on 2023).
By size, 28% of micro businesses expected turnover to increase, compared with 40% of small businesses and 51% of medium-sized ones.
Figure 4: Businesses’ expectations of turnover in 12 months’ time, by year
The sectors most likely to think that turnover would increase were information and communications (46%, up 5 percentage points on 2024), manufacturing, administration (both 36%) and professional and scientific (34%).
By nation, SME employers in Wales were more likely to expect turnover to grow (35%), compared with those in Northern Ireland (34%), Scotland (31%), and England (31%).
4.5 Profit
In the data tables accompanying this publication, table 67 shows whether SMEs generated a profit or surplus in the last financial year.
When asked about generating a profit or surplus, 76% of SME employers stated they had done so in their last financial year. This is down 1 percentage point on 2024 and down 2 percentage points on 2023.
By size, 75% of micro employers made a profit (down 1 percentage point on 2024, down 3 percentage points on 2023), compared with 77% of small businesses (down 1 percentage point on 2024 and down 3 percentage points on 2023), and 82% of medium-sized businesses (as in 2024, and down 2 percentage points on 2023).
Those most likely to have made a profit or surplus were SME employers in the following sectors: finance and real estate (83%, down 2 percentage points on 2024), professional and scientific (83%, down 1 percentage point on 2024), construction (80%), and information and communications (80%). Sectors least likely to have reported a profit were arts and entertainment (61%), other services (59%), and education (62%).
Figure 5: Generated a profit or surplus in the last financial year, by year

By nation, 77% of SMEs have made a profit or surplus in Scotland (1 percentage point up on 2024), 75% in England (1 percentage point down on 2024), and 74% in Wales (2 percentage points down on 2024), compared with 84% in Northern Ireland (as in 2024).
5. Exporting
5.1 Sales of goods or services outside the UK in the last year
In the data tables accompanying this publication, tables 48 to 53 show whether businesses exported goods or services, and the extent to which exports contribute to total sales. Tables 57 and 58 show the proportion of turnover accounted for by exports to the European Union.
Overall, 18% of SME employers exported goods or services in the last year. This is 1 percentage point higher than in 2024.
Figure 6: Percentage of SME employers that sold goods or services, or licensed products outside the UK in the last 12 months, by year

With respect to sector, similarly to previous years, exporters were most prevalent in the manufacturing sector (45% of businesses, down 1 percentage point on 2024 and down 2 percentage points on 2023), information and communication sector (42%, up 2 percentage points on 2024 and up 1 percentage point on 2023), retail and wholesale sector (28%, up 2 percentage points on 2024, down 1 percentage point on 2023), and professional and scientific sector (25%, down 1 percentage point on 2024 and down 2 percentage points on 2023).
The sectors least likely to have exported were accommodation and food service (2%), health (2%), construction (4%), finance and real estate (4%) and other services (6%).
In terms of employment size band, 17% of micro businesses were exporters, compared with 22% of small businesses and 29% of medium-sized businesses. There was an increase of 1 percentage point among micro businesses and a decrease of 1 percentage point among medium-sized businesses compared with 2024, but there was little variation over the last 3 years in the proportions of businesses that have exported in each band: these were 16%, 22% and 30% respectively in 2024, and 17%, 23% and 30% respectively in 2023.
In terms of nation, SME employers in Northern Ireland were most likely to export (31% did so, 2 percentage points down on 2024 and 1 percentage point down on 2023). This is mainly attributable to sales to the Republic of Ireland, with which Northern Ireland shares a land border. The proportion of exporters was lower than average in Scotland (13%, up 1 percentage point on 2024 and down 2 percentage points on 2023) and Wales (12%, down 3 percentage points on 2024 and down 2 percentage points on 2023), while exporting among SME employers in England was on a par with the UK average (18%, up 1 percentage point on 2024 and down 1 percentage point on 2023).
Of all SME employers, 10% exported services (1 percentage point up on 2024, and the same as in 2023) and 10% exported goods (as in 2024 and 2023). By sector, those in the information and communication (38%, up 3 percentage points on both 2024 and 2023) and professional and scientific (23%, as in 2024, but 2 percentage points down on 2023) sectors were most likely to export services. Those in manufacturing (43%, as in 2024 but down 1 percentage point on 2023) and wholesale and retail (27%, up 2 percentage points on 2024, but down 1 percentage point on 2023) sectors were most likely to export goods.
Exports accounted for less than a quarter of turnover for 56% of exporters, between a quarter and a half for 17%, between half and three-quarters for 10%, and over three-quarters for a further 13%. Compared with 2024, the scale of exports as a proportion of turnover increased with fewer estimating exports as accounting for less than a quarter of turnover (60% in 2024) and more exporters estimating export sales at between a quarter and a half of turnover (13% in 2024).
When focusing specifically on SME employers that exported to the EU, exports to the EU accounted for less than a quarter of turnover for 77% of all EU exporters (up 1 percentage point on 2024 but down 1 percentage point on 2023), between a quarter and half for 11% (up 2 percentage points on 2024 and up 1 percentage point on 2023); between half and three-quarters for 5% (up 3 percentage points on 2024 and up 1 percentage point on 2023); and over three-quarters for a further 4% (as in 2024 and 2023).
5.2 Destinations of exports
In the data tables accompanying this publication, tables 55 and 56 show the destination of exported goods or services.
Of all UK SME employers that exported in the last year, 81% exported to European Union countries (down 1 percentage point on 2024, but up 2 percentage points on 2023) and 71% exported outside the EU, including to European Free Trade Association (EFTA) countries (as in 2024, but down 2 percentage points on 2023).
Figure 7: Destinations that SME employers exported to in the last year, by year (SME exporters only)

In terms of exports to non-EU markets, 45% of exporters sold goods or services to the USA, 27% sold to EFTA countries, 21% to Canada, 15% to India, 12% to China, 11% to Turkey, 8% to South Korea, and 47% to the rest of the world.
Overall, 82% of exporters sold to either EU or EFTA countries (as in 2024, but up 1 percentage point on 2023), and 71% to countries outside the EU (as in 2024, but down 2 percentage points on 2023).
5.3 Plans to increase levels of exports or start exporting and intermittent exporting (Cohort C)
In the data tables accompanying this publication, tables 2, 5, 6, and 7 (Cohort C) show the extent to which exporting is intermittent, plans to increase exports or to start exporting goods or services in the next few years. Table 61 of the main data tables shows the proportion of non-exporters that do not have a product or service suitable for export.
Among all UK SME employers that exported in the last year, 46% reported planning to increase their level of exports over the next few years (down 5 percentage points on 2024 and down 9 percentage points on 2023).
In terms of employment size, the prevalence of plans to increase export sales increased with the size of the business; 62% of medium-sized businesses reported such plans, compared with 50% of small and 44% of micro businesses.
Of those UK SME employers that did not export in the last year but have a product or service that is suitable for export, 21% reported planning to start exporting over the next few years (7% in the next 12 months; 14% further into the future). This equates to 2% of all UK SME employers (down 1 percentage point on 2024 and down 2 percentage points on 2023). However, 88% of SME employers that did not export in the past year reported that they did not have a product or service suitable for export.
Of SME employers that have exported for 2 years or longer, 72% have had overseas sales every year since they started exporting (down 1 percentage point on 2024 and down 7 percentage points on 2023). Some 21% have had some years without overseas sales (down 3 percentage points on 2024, but up 2 percentage points on 2023).
5.4 Purchases of goods or services from outside the UK in the last year (Cohort A)
In the data tables accompanying this publication, table 2 shows whether they directly imported goods or services.
Overall, 24% of SME employers directly imported goods or services in the last year – 19% from suppliers based in the EU, and 15% from suppliers based in non-EU countries. Comparing with previous years, 23% of SME employers directly imported in 2024 (18% from the EU and 13% from non-EU countries), 20% in 2023 (16% from the EU and 12% from non-EU countries).
By employment size band, 41% of medium-sized businesses imported directly, compared with 28% of small and 23% of micro businesses. The same proportions were reflected in import sources: 37% of medium-sized businesses imported from the EU, compared with 24% of small and 17% of micro businesses, and 28% imported from non-EU countries, compared with 17% of small and 14% of micro businesses.
By nation, SME employers in Northern Ireland were most likely to import directly (28%), followed by Scotland (25%), England (24%) and Wales (20%). Northern Ireland employers imported more than others from the EU (28%, compared with 19% in England, 18% in Scotland and 17% in Wales), which is likely to be attributable to their trade with the Republic of Ireland, with whom they share a land border. On non-EU imports, the pattern reversed, with England and Scotland employers being most likely to import (both 15%) and Wales and Northern Ireland employers least likely (both 10%), underlining the impact of trade with the Republic of Ireland within Northern Ireland.
By sector, direct importers were most prevalent in the manufacturing sector (57%), information and communications sector (46%), and retail and wholesale sector (45%). The sectors least likely to have imported directly were accommodation and food service (5%), education (5%), and health (5%). Imports from the EU were most common in the manufacturing sector (44%) and retail and wholesale sector (37%), while information and communications was the only sector in which imports from non-EU countries (36%) exceeded imports from the EU (26%).
6. Access to finance
6.1 Types of external finance currently used
In the data tables accompanying this publication, table 79 to 80 shows the types of external finance currently being used.
Overall, 70% of SME employers were using some form of external finance (2 percentage points lower than in 2024 and 3 percentage points lower than in 2023). Compared with pre-2020 (pre-coronavirus (COVID-19) pandemic), it remained higher (7 percentage points higher than in 2019).
By employment size, 68% of micro firms used finance (2 percentage points down on 2024 and 3 percentage points down on 2023), compared with 79% of small businesses (down 3 percentage points on both 2024 and 2023) and 85% of medium-sized businesses (down 2 percentage points on 2024 and down 1 percentage point on 2023).
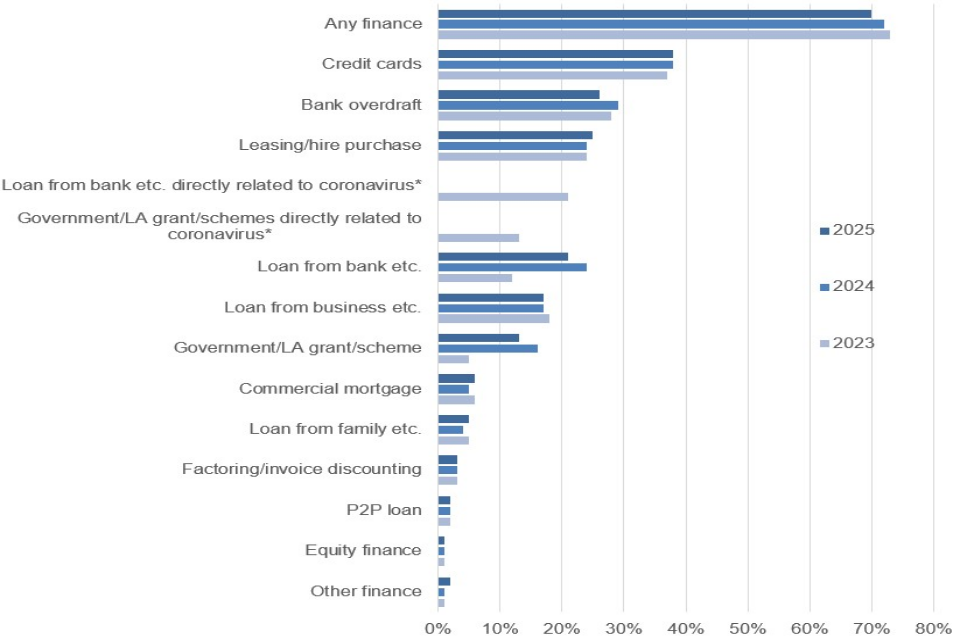
The most used form of external finance in 2025, was credit cards (38%, as in 2024 and up 1 percentage point on 2023). Next most used were bank overdrafts (26%, down 3 percentage points on 2024 and down 1 percentage point on 2023), leasing or hire purchase (25%, up 1 percentage point on 2024 and 2023) and loans from a bank, building society or other financial institution (21%, down 3 percentage points on 2024, but up 9 percentage points on 2023).
Also significant were loans from business partners/directors/owners (17%, as in 2024, but down 1 percentage point on 2023) and government or local authority grants or schemes (13%, down 3 percentage points on 2024, but up 8 percentage points on 2023).
Use of loans from banks, building societies or other financial institutions and of government or local authority grants or schemes fell back in 2025, having risen sharply in 2024, but both remained well above their 2023 levels.
Figure 8: Forms of external finance currently used by SME employers – percentages
By nation, 74% of SME employers in Northern Ireland used some form of external finance (as in 2024, and up 4 percentage points on 2023), compared with 71% in Scotland (down 4 percentage points on 2024 and down 5 percentage points on 2023) and 70% in Wales (down 10 percentage points on 2024 and down 8 percentage points on 2023). In England, use of external finance was on a par with the UK average (70%, down 2 percentage points on 2024 and down 3 percentage points on 2023).
By sector, SME employers in transport and storage (84%), primary sector (81%), manufacturing (79%), construction (77%) and retail and wholesale (75%) were more likely than average to use finance. The use of finance was below the average of 70% in finance and real estate (57%), health (62%), professional and scientific (63%), other services (64%) and accommodation and food services (65%) sectors. (See ‘Sector definitions’ in the ‘Technical information’ section of this report).
Different sectors use different types of external finance to suit their needs:
- credit cards were most likely to be used in transport and storage (48%), construction (47%), manufacturing (46%), information and communications (42%) and retail and wholesale (42%)
- bank overdrafts were particularly likely to be used in primary (48%), transport and storage (36%), manufacturing (32%) and construction (30%)
- leasing/hire purchase was used most within primary (44%), transport and storage (41%), manufacturing (35%) and construction (33%)
- bank loans were most common within primary (46%) and manufacturing (29%)
- business partner/directors/owner’s loans were most used in information and communications (21%), manufacturing (20%) and transport and storage (20%)
- government grants were most used in arts and entertainment (33%), education (25%), health (24%), primary (22%) and other services (21%)
- commercial mortgages were most used in primary (21%) and accommodation and food (15%)
- loans from family/friend were most used in information and communications (8%)
- factoring/invoice discounting was most used in manufacturing (8%), transport and storage (6%) and administration (6%)
- loans from a peer-to-peer platform were most common in accommodation and food (5%), information and communication (3%) and arts and entertainment (3%)
- equity finance was most used in arts and entertainment (3%)
Small and medium-sized businesses were more likely than micro businesses to use many types of finance, with the exception to this being bank overdrafts and loans from peer-to-peer platforms, business partners/directors/owners or family/friends.
The use of any form of so-called ‘alternative finance’, not originating from banks, the public sector, or people known to the business (this refers to equity, factoring/invoice discounting, peer-to-peer loans and some forms of ‘other finance’), was reported by 6% of SME employers (up 1 percentage point on 2024 but down 1 percentage point on 2023).
By employment size, 5% of micro businesses used alternative finance (up 1 percentage point on 2024 but down 1 percentage point on 2023), compared with 10% of small businesses (as in 2024, but down 2 percentage points on 2023) and 19% of medium-sized businesses (up 1 percentage point on 2024 and as in 2023).
Alternative finance was most likely to be used in the manufacturing (10%, as in 2024, but down 3 percentage points on 2023) sector.
6.2 Whether sought external finance in the last 12 months
In the data tables accompanying this publication, tables 83 and 84 shows whether the business tried to obtain external finance in the past 12 months.
In 2025, 15% of SME employers had sought external finance in the preceding 12 months, the same proportion as reported in 2024 and 2 percentage points higher than reported in 2023.
Figure 9: Percentage of SME employers that sought external finance in the preceding 12 months, by number of employees and year

The tendency to have sought external finance in the previous 12 months increased with business size, from 13% of micro businesses to 19% of small and 23% of medium-sized businesses (14%, 18% and 22% in 2024, respectively). Small and medium-sized businesses remain above their 2023 levels (13%, 16% and 21% in 2023, respectively).
By nation, 17% of SME employers in Wales sought finance in the preceding 12 months (as in 2024, but down 2 percentage points on 2023), compared with 16% in Scotland (up 1 percentage point on 2024 and 2023) and 16% in Northern Ireland (up 3 percentage points on 2024 and 5 percentage points on 2023), and 14% in England (down 1 percentage point on 2024 but up 1 percentage point on 2023).
SME employers in the primary sector (30%) were most likely to have applied for finance in the last year.
Figure 10: Percentage of SME employers seeking external finance in the preceding 12 months, by sector and year

Of those SME employers that sought external finance in the last 12 months, 16% had done so for the first time, down 7 percentage points on both 2024 and 2023.
By employment size, micros were more likely to be applying for finance for the first time than small and medium-sized enterprises (17%, 11% and 11%, respectively). This is compared with 26%, 17% and 8% respectively in 2024, and 26%, 16% and 8% respectively in 2023.
Some 83% of all SME employers who had sought finance in the last year had done so before. Those within transport and storage (99%), administration (92%) and manufacturing (89%) sectors were most likely to have had previous experience of applying for finance.
Compared with 2024, SME applications for finance increased in primary industries (30%, up 3 percentage points), finance and real estate (11%, up 3 percentage points), construction (17%, up 2 percentage points), administration (17%, up 2 percentage points), professional and scientific (12%, up 2 percentage points) and arts and entertainment (17%, an increase of 1 percentage point). The sectors in which fewer SME employers than in 2024 sought finance were transport and storage (18%, down 9 percentage points), education (10%, down 5 percentage points), health (10%, down 3 percentage points), other services (8%, down 3 percentage points) and retail and wholesale (13%, down 2 percentage points).
Of all SME employers, 9% sought finance once in the previous 12 months, and 6% sought it more than once. SME employers in the primary sector (21%) were most likely to have sought it just once.
6.3 Type of external finance sought
In the data tables accompanying this publication, tables 85 and 91 shows the types and amount of external finance sought in the last 12 months.
The types of external finance that were sought in the previous 12 months were as follows:
-
bank loans (39% of those that applied for any, up 3 percentage points on 2024 and up 1 percentage point on 2023)
-
bank overdraft (39% of those that applied, up 2 percentage points on 2024 and 2023)
-
leasing/hire purchase (22%, up 2 percentage points on 2024 and up 3 percentage points on 2023)
-
credit cards (16%, down 1 percentage point on 2024 and 2023)
-
loan from business partner/director (13%, up 1 percentage point on 2024, and as in 2023)
-
loan from family/friend (12%, as in 2024, down 1 percentage point on 2023)
-
government or local authority grant or scheme (12%, as in 2024, up 5 percentage points on 2023)
-
commercial mortgage (6%, as in 2024 and 2023)
-
loan from a peer-to-peer (P2P) platform (5%, down 2 percentage points on 2024, and as in 2023)
-
factoring/invoice discounting (2%, down 1 percentage point on 2024 and 2023)
-
equity finance (2%, up 1 percentage point on 2024, and as in 2023)
The mean amount of finance sought (for those that sought bank overdrafts, this includes the size of the overdraft facility, even if it was not used) was £481,000. This mean was £165,000 for micros, £522,000 for small businesses, and £5.9 million for medium-sized businesses. It should be noted that the mean can be affected by a relatively small number of large values, as well as small outliers, and so might not be very reliable as an estimate.
The median, which better represents the amount that the typical business sought, was £50,000. This was £40,000 for micros, £100,000 for small businesses, and £650,000 for medium-sized businesses.
By nation, the median amount of finance sought was £50,000 across all – England, Scotland, Wales and Northern Ireland.
6.4 Intentions to apply for external finance in the next 3 years
In the data tables accompanying this publication, table 146 shows the likelihood that the business will approach external finance providers in the next 3 years.
When asked whether they would approach external finance providers in the next 3 years, 20% of SME employers said it was likely they would do so, which is 1 percentage point down on 2024 and 2023. This included 9% that thought it very likely (down 1 percentage point on 2024 and 2023) and 11% that thought it fairly likely (as in 2024 and 2023).
By employment size, 30% of medium-sized businesses said they would be likely to approach external finance providers, compared with 25% of small businesses and 19% of micro businesses (32%, 26% and 19% respectively in 2024).
6.5 Trade credit and late payment (Cohort A)
In the data tables accompanying this publication, table 12 (Cohort A) shows whether they gave their customers trade credit. Table 15 (Cohort A) outlines whether they have a problem with customers paying later than expected business terms.
In 2025, 44% of SME employers reported that they give their customers trade credit, down 3 percentage points on both 2024 and 2023.
Larger SMEs were more likely to give customers trade credit: 59% of medium-sized businesses gave trade credit (as in 2024), compared with 50% of small (down 2 percentage points on 2024) and 42% of micro (down 3 percentage points on 2024) businesses.
Credit given varied between sectors: from 80% of SME employers in manufacturing, 63% in information and communications, 58% in transport and storage and 55% in professional and scientific down to 9% in accommodation and food, 10% in health and 19% in both finance and real estate and education.
By nation, SME employers in Scotland (54%) and Northern Ireland (52%) were more likely than average to give their customers trade credit, while the proportions in England (43%) and Wales (41%) were in line with the UK average.
Late payment was considered a problem by 63% of SME employers that gave trade credit (6 percentage points up on 2024). This equates to 28% of all SME employers (1 percentage point up on 2024).
There was little variation by employment size, with late payment likely to be considered a problem by 63% of micro and 65% of small and medium-sized (65%) businesses that gave trade credit.
By nation, late payment was less likely to be considered a problem by businesses that gave trade credit in Northern Ireland (50%) than in England (65%), Scotland (59%) and Wales (59%).
By sector, late payment was most likely to be considered a problem by those that gave trade credit in the administration sector (75%), and least likely to be considered a problem by those that gave credit in the accommodation and food sector (38%).
7. Innovation activity
7.1 New or significantly improved processes in the last 3 years (Cohort B)
In the data tables accompanying this publication, table 2 (Cohort B) shows whether the business has introduced any new or significantly improved processes in the last 3 years.
Among SME employers, 21% had innovated processes for producing or supplying goods or services in the last 3 years (up 2 percentage points on 2024 and the same proportion as in 2023).
The percentage was higher for medium-sized businesses (34%, up by 2 percentage points on 2024) than small (26%, up by 1 percentage point on 2024) and micro (20%, up by 2 percentage points on 2024) businesses.
By sector, SME employers in information and communications (36%), manufacturing (29%) and professional and scientific (27%) were most likely to have innovated processes in the last 3 years.
By nation, the proportion was higher in Wales and Scotland (both 23%) than in England (21%) and Northern Ireland (18%). Compared with 2024, more SME employers in all nations had innovated processes (20% in Wales, 17% in Scotland, 20% in England and 16% in Northern Ireland in 2024).
7.2 New or significantly improved goods or services in the last 3 years
In the data tables accompanying this publication, 102, 103, and 104 show whether the business has introduced any new or significantly improved goods or services in the last 3 years.
In the last 3 years, 14% of SME employers had introduced new or significantly improved goods – up 1 percentage point on 2024 but down 1 percentage point on 2023.
This proportion increased with employment size, from 13% of micro businesses to 18% of small businesses, and to 21% of medium-sized businesses (12%, 17% and 19% respectively in 2024).
The equivalent figure for the introduction of new or significantly improved services was 25% – up 2 percentage points on 2024 but down 1 percentage point on 2023.
Again, the tendency to have done so increased with employment size: 24% of micro businesses, 28% of small businesses and 31% of medium-sized businesses had innovated in this way (22%, 26% and 32% respectively in 2024).
Overall, 31% of SME employers had innovated goods or services in the last 3 years (up 2 percentage points on 2024 but down 2 percentage points on 2023).
Figure 11: Percentage of SME employers which have introduced new or significantly improved goods or services in the last 3 years – by size of business, 2025

Innovation in respect of goods was similar across nations, higher in Wales (17%) than in Northern Ireland and Scotland (both 15%) and England (14%). Compared with 2024, there has been an increase in innovation of goods in Wales and Scotland (both up 2 percentage points) and England (up 1 percentage point), with no change in Northern Ireland.
SME employers in Wales were also more likely to innovate services (28%), followed by those in England (25%) and Scotland (24%), and it was lowest in Northern Ireland (19%). Compared with 2024, there was a 3 percentage points increase in Wales, a 2 percentage points increase in England and Scotland, and a 1 percentage point decrease in Northern Ireland.
Figure 12: Percentage of SME employers which have introduced new or significantly improved goods or services in the last 3 years - by sector, 2025

By sector, SME employers in manufacturing (35%) and information and communications (26%) sectors were the most likely to have innovated goods.
Those in information and communications (52%), education and professional and scientific (both 37%), and arts and entertainment and other services (both 31%) sectors were the most likely to have innovated services.
7.3 Process innovations which were new to the industry (Cohort B)
In the data tables accompanying this publication, table 4 (Cohort B) shows if the processes were new to the industry or business.
Of those SME employers that had innovated processes in the last 3 years, these processes were new to the industry for 24% of them (up 3 percentage points on 2024), with most of the remainder introducing processes that were new only to the business (72%) (down 6 percentage points on 2024).
7.4 Goods and services innovations which were new to the market or industry
In the data tables accompanying this publication, table 105 shows whether the goods or services innovations were new to the market or business.
Of those SME employers that had innovated goods and/or services in the last 3 years, these were new to the market (or industry) for 30%, with the remainder new only to the business (68%). The proportion introducing goods and services that were new to the industry decreased by 1 percentage point on 2024.
By size, the proportion of SME employers introducing goods and/or services new to the industry was higher in medium-sized businesses (34%) than in small and micro businesses (31% and 29%, respectively) (36%, 30% and 32% respectively in 2024).
Based again on those SME employers innovating new goods and/or services, these were most likely to be new to the industry in manufacturing (47%) and information and communications (45%) sectors.
7.5 Investment in R&D in the last 3 years (Cohort B)
In the data tables accompanying this publication, table 5 (Cohort B) shows whether the business invested in research and development (R&D) in the last 3 years, and table 6 (Cohort B) shows how much has been invested. Table 135 in the main tables shows annual turnover for those who invested in R&D in the last 3 years and was used to calculate the percentage of turnover invested.
Among SME employers, 16% had made any investment in R&D in the previous 3 years (as in 2024 and 2023). This increased with employment size from 15% of micros to 21% of small businesses to 32% of medium-sized businesses (14%, 23% and 32% respectively in 2024, and 14%, 24% and 37% respectively in 2023).
Figure 13: Investment in R&D in the preceding 3 years by sector and by year – percentages

Investment in R&D was most likely in the manufacturing (41%), information and communications (38%) and professional and scientific (22%) sectors.
Of those investing in R&D, the mean amount spent in the last 12 months was £209,000. Means are affected by high values and can be misleading as a measure of the investment in R&D by a typical SME employer. This figure has been calculated only using responses with the exact amount of R&D spending stated, so it excludes the respondents who gave an estimated figure within a range. The amount spent by a typical SME is better reflected by using the median.
The median amount invested in the last 12 months was £40,000. This was £250,000 for medium-sized businesses, £80,000 for small businesses, and £30,000 for micro businesses.
The mean annual sales turnover for SME employers that invested in R&D was around £2,565,000. Assuming constant sales turnover over 3 years, this suggests that the average SME employer that invests in R&D spends 3% of its annual turnover on R&D.
7.6 Applications for R&D tax credits in the last 3 years (Cohort B)
In the data tables accompanying this publication, table 7 (Cohort B) shows whether the business applied for or received R&D tax credits in the last 3 years.
Around 6% of SME employers had applied for R&D tax credits (including those who had received them) in the previous 3 years (down 1 percentage point on 2024 and 2023). This proportion was higher for medium-sized businesses (20%), than for small businesses (10%) and micro businesses (5%) (18%, 14% and 5% respectively in 2024, and 25%, 16% and 4% respectively in 2023).
By sector, applications were most likely in manufacturing (22%) and information and communications (14%).
8. Social enterprises
In the data tables accompanying this publication, tables 64 and 65 show whether SME employers consider various business goals as important, and the relative importance of social or environmental goals. Table 71 presents how SMEs are classified with regard to social enterprise.
A social enterprise is defined as a business (not a charity) which trades for a social or environmental purpose and reinvests its profit or surplus in that social or environmental purpose. To distinguish it from a charitable organisation, it must obtain at least half its income from trading activity. Section D relating to social enterprises and social or environmental goals is included in the survey every other year.
When asked about a variety of business goals, 88% of SME employers stated that financial goals were important to them (down 2 percentage points on 2023).
The tendency to consider financial goals as important increased slightly with business size: 87% of micros, 92% of small and 95% of medium-sized business (89%, 94%, 95% respectively in 2023).
Working to enhance civic and community engagement was important for 35% of SME employers (as in 2023). The sectors most likely to rate this as important were arts and entertainment and health (both 67%), other services (61%), education (59%) and accommodation and food (53%).
Offering solutions to environmental problems, such as climate change or food waste was reported as of important by 31% of all SME employers (down 5 percentage points on 2023). This proportion is highest in primary sectors (56%), as well as being higher than average in the accommodation and food sector (41%).
Fighting economic and/or social exclusion was reported as important by 28% of all SME employers (down 1 percentage point on 2023), and particularly within health (73%), education (64%), arts and entertainment (53%) and other services (50%) sectors.
Offering solutions to problems of health and/or aging was important for 22% of all SME employers (as in 2023), particularly, again, those in health (60%) and, to a lesser extent, arts and entertainment (40%) and other services (38%) sectors.
Of those SME employers who cited goals other than financial ones as important, 2% considered social or environmental goals as their only concern, 10% considered these goals their primary concern, 27% considered them to be equal to financial or other goals and 48% considered them to be secondary to financial or other goals (2%, 13%, 29% and 47% respectively in 2023).
Where social or environmental goals were important to SME employers, those in health (33%), other services (28%), education (27%) and arts and entertainment (18%) sectors were most likely to report that these goals were their business’s only or primary concern, while those in the health sector were most likely to report that they were their only concern (6%).
Those in arts and entertainment (41%) and health (32%) sectors were most likely to report that these goals were equal to financial and other goals.
Questions asked in this year’s survey sought to determine whether SME employers could be classified as social enterprises.
Based on whether social and environment goals were important, whether those social and environmental goals were at least as important as financial goals, and whether at least half of profits or surpluses were invested to further these non-financial goals, 5% of all SME employers were classified as ‘social enterprises’ (down 2 percentage points on 2023 and 2021). This proportion is highest within arts and entertainment (20%), health (18%), education (14%) and other services (9%) sectors.
9. Major obstacles to the success of the business
9.1 Overview of main obstacles (Cohort B)
In the data tables accompanying this publication, table 1 (Cohort B) shows the major obstacles to the success of the businesses interviewed.
In 2025, the most frequently mentioned major obstacle to business success remained taxation, VAT, PAYE, National Insurance and business rates (67%, up 6 percentage points on 2024 and up 22 percentage points on 2023). The level of energy prices remained the second most frequently mentioned obstacle (52%, up 2 percentage points on 2024 but down 4 percentage points on 2023), followed by regulations/red tape (47%, up 3 percentage points on 2024 and up 6 percentage points on 2023) and competition in the market (42%, up 2 percentage points on 2024 but down 6 percentage points on 2023).
The National Living Wage was mentioned more frequently by SME employers in 2025 than in 2024 and 2023 (38%, up 7 percentage points on 2024 and up 11 percentage points on 2023), now equally as likely to have been mentioned as staff recruitment and skills (38%, up 1 percentage point on 2024 but down 2 percentage points on 2023).
Other major obstacles included: the UK’s exit from the EU (29%, down 2 percentage points on 2024 and down 1 percentage point on 2023), late payment (29%, up 3 percentage points on 2024 but down 3 percentage points on 2023) and other issues related to costs (not related to energy prices) (26%, down 5 percentage points on 2024 and down 4 percentage points on 2023). Workplace pensions were mentioned as an obstacle to business success by 17% of SME employers (up 5 percentage points on both 2024 and 2023). The availability/cost of suitable premises was mentioned by 17% (as in 2024, but down 2 percentage points on 2023) and obtaining finance by 16% (as in 2024, but down 4 percentage points on 2023).
Figure 14: Percentages of SME employers citing each major obstacle to the success of the business (Cohort B only)

Small and medium-sized businesses were more likely to mention taxation as an obstacle to business success than micro businesses (76% of small, 75% of medium-sized and 64% of micros). This compares with 75%, 71% and 58% respectively in 2024.
Medium-sized businesses, with a larger number of staff to manage, were more likely than micro and small employers to cite staff recruitment and skills as an obstacle to business success: 63% of medium-sized businesses (up 1 percentage point on 2024), compared with 58% of small (up 3 percentage points on 2024) and 33% of micro (up 1 percentage point on 2024) businesses.
These larger businesses were also more likely to mention the National Living Wage than businesses with fewer than 10 employees. In 2025, it was mentioned by 57% of small (up 9 percentage points on 2024) and 50% of medium-sized businesses (as in 2024), compared with 34% of micro businesses (up 6 percentage points on 2024).
In 2025, small businesses were more likely than medium-sized and micro businesses to cite the level of energy prices (59%, 54% and 50% respectively, compared with 59%, 49% and 48% respectively in 2024).
Medium-sized businesses were more likely to cite competition in the market (61%, up 14 percentage points on 2024) than small (51%, up 7 percentage points on 2024) and micro (40%, up 2 percentage points on 2024) businesses.
Although more likely to mention the UK’s exit from the EU, medium-sized businesses do not differ greatly from smaller businesses this year, with 35% mentioning this as an obstacle (as in 2024), compared with 33% of small (as in 2024) and 28% of micros (down 3 percentage points on 2024).
There was some sectoral variation in the obstacles SME employers cited:
- taxation was most likely to be mentioned as an obstacle in manufacturing (76%, 60% in 2024) and retail and wholesale (75%, 64% in 2024)
- the level of energy prices was most likely to be considered an obstacle in accommodation and food (77%, 84% in 2024), manufacturing (74%, 61% in 2024), transport and storage (63%, 56% in 2024), retail and wholesale (58%, 60% in 2024) and primary (56%, 73% in 2024) sectors
- regulations were most likely to be considered an obstacle in finance and real estate (74%, 66% in 2024), transport and storage (59%, 66% in 2024) and manufacturing (55%, 47% in 2024)
- competition was most likely to be an obstacle for those in administration (51%, 33% in 2024) and retail and wholesale (47%, 43% in 2024)
- staff recruitment and skills were most likely to be considered an obstacle in health (57%, 43% in 2024), manufacturing (47%, 46% in 2024) and construction (45%, 44% in 2024) sectors
- the UK’s exit from the EU was most likely to be considered an obstacle in retail and wholesale (42%, 48% in 2024) and manufacturing (40%, 42% in 2024) sectors
- the National Living Wage was most likely to be mentioned as an obstacle in accommodation and food service (60%, 63% in 2024), manufacturing (49%, 39% in 2024), and retail and wholesale and health (both 47%, 38% for both in 2024)
- late payment was most likely to be mentioned as an obstacle in construction (45%, 36% in 2024) and manufacturing (41%, 33% in 2024)
- the availability and cost of suitable premises was most likely to be considered an obstacle in education (36%, 22% in 2024) and retail and wholesale (22%, 21% in 2024)
- obtaining finance was most likely to be mentioned as an obstacle in other services (34%, 24% in 2024) and health (31%, 26% in 2024)
- workplace pensions were most likely to be viewed as an obstacle in accommodation and food (25%, 23% in 2024) and retail and wholesale (20%, 13% in 2024)
Taxation was mentioned by the majority of SME employers across all nations; 67% in England (61% in 2024), 64% in Northern Ireland (as in 2024), 63% in Scotland (59% in 2024) and 62% in Wales (60% in 2024). Unlike in 2024, taxation was also the most frequently mentioned obstacle in Scotland, where the level of energy prices had previously ranked first.
The level of energy prices was the second most frequently mentioned obstacle across all 4 nations: Northern Ireland (59%, 49% in 2024), Scotland (57%, 61% in 2024), Wales (54%, 51% in 2024) and England (51%, 49% in 2024).
Regulations/red tape were mentioned at similar levels across the nations: Northern Ireland (49%, as in 2024), England (48%, 44% in 2024), Wales (46%, 43% in 2024) and Scotland (44%, 42% in 2024).
SME employers in Northern Ireland were more likely than those in the other nations to mention staff recruitment and skills (49%; 43% in Scotland, 37% in England and 37% in Wales) (41%, 46%, 36% and 37% in 2024 respectively). SME employers in Northern Ireland were also more likely to mention the availability and cost of suitable premises (23%; 19% in Scotland, 17% in England and 15% in Wales) (17%, 18%, 17% and 21% in 2024 respectively).
10. Business Support
In the data tables accompanying this publication, table 107 shows whether information or advice was used in the last 12 months.
In 2025, 28% of SME employers reported seeking external information or advice in the preceding 12 months - defined as more than just a casual conversation. This was 1 percentage point higher than in 2024 and 2 percentage points higher than in 2023.
Figure 15: Percentage of SME employers that sought external information or advice in the last year, by employment size and year

Larger SMEs were more likely to have sought external information or advice: 44% of medium-sized businesses sought it (as in 2024 and 2023), compared with 34% of small businesses (down 1 percentage point on 2024, but the same proportion as in 2023) and 26% of micro businesses (up 1 percentage point on 2024 and up 3 percentage points on 2023). Thus, there has been little change in the tendency to seek external information and advice across any of the size bands.
By nation, SME employers in Scotland were most likely to have sought external information and advice (30%, up 4 percentage points on 2024 and up 1 percentage point on 2023), followed by those in England (28%, as in 2024 and up 2 percentage points on 2023) and Wales (28%, up 2 percentage points on 2024, and up 6 percentage points on 2023). SME employers in Northern Ireland were least likely to have sought external information and advice (22%, down 2 percentage points on 2024, but up 5 percentage points on 2023).
Businesses which sought information and advice were most likely to be in primary (48%), finance and real estate (37%), arts and entertainment (35%), and information and communications and professional and scientific (both 33%) sectors. SME employers in accommodation and food (20%), retail and wholesale (21%) and construction (23%) sectors were least likely to have sought information and advice.
10.1 Purpose of information and strategic advice sought
In the data tables accompanying this publication, table 109 shows the purpose of information and advice sought.
The most common reason for seeking information and/or advice cited by those that had sought it was for financial advice, as in accounting and for general running of the business (24%, 25% in 2024 and 24% in 2023) and advice on business growth (20%, 23% in 2024, 25% in 2023), followed by legal issues (16%, 15% in both 2024 and 2023).
Figure 16: Purpose of information and advice in the last year (Only responses more than 1% are shown in the chart)
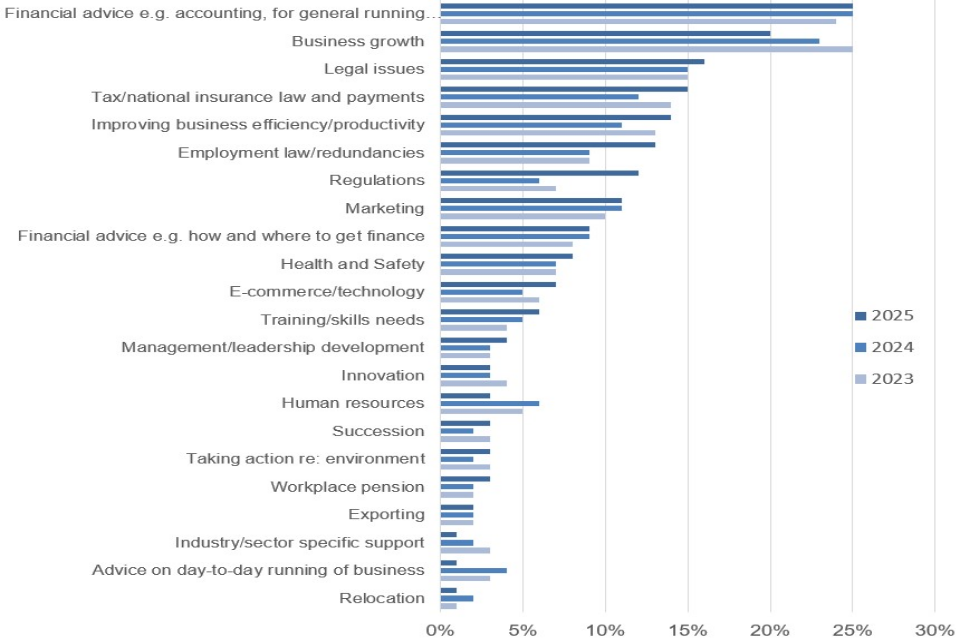
Some differences in the type of information and advice sought by size and sector are as follows:
- financial advice for the general running of the business was more likely to be sought by those within the professional and scientific (29%) sector
- advice on business growth was more likely to be sought by SME employers in the administration (33%) sector
- legal advice was more likely to be sought by medium-sized (28%) and small businesses (18%) than by micro businesses (15%), and within the finance and real estate sector (39%)
- advice on tax and national insurance law and payments was more likely to be sought within the primary (26%), accommodation and food (21%) and professional and scientific (19%) sectors
- advice on improving business efficiency/productivity was more likely to be sought by SME employers in manufacturing (23%) and retail and wholesale (18%) sectors
- advice on marketing was more likely to be sought within the education (25%) sector
- advice on employment law and redundancies was more likely to be sought by small and medium-sized businesses (both 23%) than by micro (10%) businesses, and within the health (22%) sector
- advice on health and safety was more likely to be sought by small and medium-sized businesses (both 14%) than by micro (6%) businesses, and most likely to be sought in the construction (16%) sector
- advice on regulations was more likely to be sought by medium-sized businesses (17%)
10.2 Sources of external information and strategic advice
In the data tables accompanying this publication, table 111 shows sources of external information and strategic advice.
In 2025, SME employers that sought information and advice were most likely to have approached an accountant (40%, an increase of 3 percentage points on 2024, and 5 percentage points on 2023), followed by consultants and business advisers (31%, a 3 percentage points decrease on 2024, and a 5 percentage points decrease on 2023). Business networks/trade associations were used for information and advice by 17% of SME employers that sought information and advice (down 5 percentage points on 2024, and 2 percentage points on 2023), and solicitors/lawyers used by 17% (up 2 percentage points on 2024 and 4 percentage points on 2023).
Much less frequently mentioned as sources of information and advice were the internet/Google/other search engine (8%, 2 percentage points higher than in 2024 and 1 percentage point higher than in 2023), the GOV.UK website (6%, 1 percentage point higher than in 2024, but the same proportion as in 2023), a specialist financial adviser (5%, as in 2024 and 2023) and/or local council/authority (5%, 1 percentage point lower than in both 2024 and 2023).
In terms of sources available in the devolved nations, Business Gateway was quite significant as a source of information, advice and guidance in Scotland, where it is available (8%), as was Scottish enterprise agencies (7%), while 11% of SME employers in Wales mentioned Business Wales, and 13% of SME employers in Northern Ireland mentioned Invest NI and 5% mentioned the NI Business Information website.
Figure 17: Who provided information and strategic advice in the last year

Medium-sized and small businesses were more likely than micro businesses to have sought information and advice from consultants or general business advisers (44%, 41% and 28% respectively), and the same was true in respect of using solicitors and lawyers (32% and 20% respectively, compared with 15%). Micro businesses that sought information and advice were more likely than small and medium-sized businesses to have sought it from an accountant (42% compared with 35% and 34% respectively). They were also more likely to have sought it from business networks and trade associations (18% compared with 14% and 14% respectively).
- Accountants were most likely to be used for information and advice by SME employers in primary (64%) and accommodation and food (47%) sectors
- Consultants or general business advisers were most likely to be consulted by SME employers in arts and entertainment (45%) and health (39%) sectors
- Business networks/trade associations were most likely to be the source of information and advice for SME employers within accommodation and food, and administration (both 25%) sectors
- Solicitors/lawyers were most likely to be consulted by those in finance and real estate (32%) and primary (25%) sectors
- Local councils/authorities were most frequently cited as a source of information and advice by SME employers in other services (17%) and health (14%) sectors
10.3 How information and strategic advice was delivered
In the data tables accompanying this publication, table 113 shows how the information and strategic advice was delivered.
In 2025, face-to-face delivery was the most frequently cited mode of delivery of information and advice, as it has been in recent years (45% in 2025, 2024 and 2023).
The use of email as a mode of delivery of information and advice has remained at a broadly steady level. Email was the mode of delivery for 21% of SME employers who had received information and advice in 2025 (down 2 percentage points on 2024 and down 1 percentage point on 2023). On the phone was cited by 20% in 2025 (down 1 percentage point on 2024, but up 3 percentage points on 2023).
By sector, face-to-face delivery was most common in primary (67%, 71% in 2024), manufacturing (61%, 52% in 2024) and retail and wholesale (50%) sectors, and email was most common in other services (31%) and accommodation and food (28%) sectors.
By nation, as reported in 2024, SME employers who sought information and advice in Northern Ireland were the most likely to have received it face-to-face (62%, 60% in 2024), but in 2025 Scotland (rather than Wales as in 2024) were least likely to have done so (41%, as in 2024). SME employers in Wales were more likely to have received information and advice face-to-face than in 2024 (48%, 38% in 2024), while there was little change in England (45%, as in 2024).
SME employers who sought information and advice in Northern Ireland were less likely than those in the other nations to cite receiving it by email (14%, compared with 25% in Scotland, 21% in England and 16% in Wales). Use of the phone was similar across the nations (23% in Scotland, 19% in England and 17% in both Wales and Northern Ireland). Compared with 2024, use of email in Northern Ireland was down 5 percentage points while use of the phone was up 2 percentage points (19% and 15% respectively in 2024).
10.4 Paying for information and advice (England and Wales only)
In the data tables accompanying this publication, table 115 shows if SMEs had ever paid for external information or advice.
Of SME employers that received information or advice in the last 12 months, 66% paid for it.
Medium-sized businesses were more likely to have paid for information and advice (86%) than small (74%) and micro businesses (62%).
By sector, those in primary sectors (85%) were most likely to have paid for information and advice; while those in other services (50%) and transport and storage (56%) were the least likely.
By nation, SME employers that received information or advice were most likely to have paid for information and advice (67%), compared with those in Wales (61%), Northern Ireland (59%) and Scotland (58%). This compared with 65% in England and 49% in Wales and Northern Ireland in 2024. (SME employers in Scotland were asked this for the first time in 2025.)
11. Training
11.1 Arrangement or funding of staff training and development
In the data tables accompanying this publication, table 134 shows training or development offered for employees.
Following little change between 2020 and 2024, there was a 3 percentage points increase in SME employers that had arranged or funded training in the previous year in 2025, with the percentage that did so rising to 48%. This was the same level as reported in 2019, pre-coronavirus (COVID-19) pandemic.
Figure 18: Percentage of SMEs that arranged or funded training or development for staff in the year, by year and employment size

Provision of any training is much more likely for larger organisations, with 85% of medium-sized businesses providing training, an increase of 3 percentage points on both 2024 and 2023. There was no change in small businesses providing training in 2025 (72%, as in 2024, and 1 percentage point lower than in 2023) but there was an incread of 3 percentage points in the tendency to have provided training for staff among micro businesses compared with both 2024 and 2023 (42%).
In 2025, 14% of SME employers offered formal ‘off-the-job’ training only, which was a 1 percentage point increase on 2024 and 2 percentage points up on 2023, while 12% offered informal ‘on-the-job’ training only, a 2 percentage points increase on 2024 and up 1 percentage point on 2023. Compared with 2024, there was a 1 percentage point decrease in SME employers who offered both ‘off-the-job’ and ‘on-the-job’ training (21%, 2 percentage points lower than in 2023).
Figure 19: Percentage of SMEs that arranged or funded training or development for staff in the year, by sector

The most likely sectors to have provided training were education (70%, 64% in 2024) and health (65%, 75% in 2024). Primary (55%), construction (53%) and professional and scientific (53%) sectors were also more likely than average to have provided training.
Training was least likely to be provided in the retail and wholesale (35%, 34% in 2024) and accommodation and food (42%, as in 2024) sectors.
By nation, training was most likely to have been provided by SME employers in Scotland (53%, 51% in 2024 and 54% in 2023), compared with Wales (50%, 49% in 2024 and 46% in 2023), England (47%, 45% in both 2024 and 2023) and Northern Ireland (46%, 43% in 2024 and 39% in 2023).
11.2 Dispute resolution (Cohort A)
In the data tables accompanying this publication, table 14 (Cohort A) shows whether they feel they can satisfactorily resolve a payment dispute with a larger business.
Micro and small employers, with less than 50 employees in Cohort A, were asked if they felt they could satisfactorily resolve a payment dispute with a larger business, one with 50 or more employees.
Overall, 69% of SME employers felt that they could resolve such a dispute (down 6 percentage points on 2024). This proportion varied by employment size, with small businesses more likely than micro businesses to believe they could resolve the dispute – 79% of small businesses (down 4 percentage points on 2024) compared with 67% of micro businesses (down 7 percentage points on 2024).
By nation, micro and small SMEs in Wales were the most likely to feel they could resolve such a dispute (74%, up 7 percentage points on 2024), compared with 71% in Scotland (down 2 percentage points on 2024), 70% in Northern Ireland (down 15 percentage points on 2024) and 68% in England (down 7 percentage points on 2024).
11.3 Taxation
In the data tables accompanying this publication, tables 72 and 73 show how businesses with employees keep records for taxation.
In 2025, SME employers who were categorised as sole proprietors or partnerships were asked about income tax self-assessment. Overall, 94% of these SME employers reported that their business was liable to submit returns to HMRC for income tax self-assessment (up 14 percentage points from 2024).
Of those reporting a liability to submit returns for income tax self-assessment, 69% reported using record keeping software (up 4 percentage points on 2024), 57% used paper-based records (as in 2024) and 43% used spreadsheets (down 3 percentage points on 2024).
Use of record keeping software increased with employment size, from 68% of micro businesses (64% in 2024) to 79% of small (76% in 2024) to 94% of medium-sized businesses (80% in 2024).
Medium-sized businesses were less likely to use paper-based records for keeping records for income tax self-assessment than micro and small businesses (35%, 58% and 51% respectively), while small and medium-sized businesses were more likely than micro businesses to use spreadsheets for this purpose (55%, 54% and 42% respectively).
11.4 Technology (Cohort C)
In the data tables accompanying this publication, tables 8 and 9 (Cohort C) show which businesses use technologies or web-based software to sell to customers or to manage the business, and which technologies they use.
In 2025, 74% of all SME employers used technologies or web-based software to sell to customers or to manage the business (up 5 percentage points on 2024 and 13 percentage points on 2023). The remaining 25% did not use these technologies or software for either.
Use of technologies or web-based software to sell to customers or manage the business increased with business size, from 72% of micro businesses to 81% of small and 88% of medium-sized businesses. There were significant increases across the board compared with 2024 and 2023 (67%, 75%, 81% respectively; 60%, 68% and 69% respectively in 2023).
As reported in 2024, SME employers in Northern Ireland (65%, up 7 percentage points on 2024) were less likely to use technologies or web-based software to sell to customers or to manage the business than businesses in England (74%, up 5 percentage points on 2024), Scotland (74%, up 11 percentage points on 2024) and Wales (72%, down 1 percentage point on 2024).
SME employers in the information and communications sector (89%, down 1 percentage point on 2024), arts and entertainment (87%, up 12 percentage points) and professional and scientific (82%, up 4 percentage points) were most likely to use technologies or web-based software, particularly to manage the business, while those in primary (61%, down 1 percentage point ), construction (61%, up 3 percentage points ) and health (64%, down 4 percentage points) sectors were least likely to use them.
In terms of what they used it for, SME employers were more likely to use technologies or web-based software for managing the business than for selling to customers online (70% and 29% respectively). There was a 5 percentage points increase on 2024 and a 16 percentage points increase on 2023 in the use of such software for managing the business, and a 6 percentage points increase on 2024 and a 2 percentage points increase on 2023 regarding selling to customers online.
SME employers in education (49%, 33% in 2024), arts and entertainment (48%, 47% in 2024) and information and communications (44%, 41% in 2024) sectors were most likely to use technologies or web-based software to sell to customers online, while those in retail and wholesale (38%, 31% in 2024) were also more likely than average to do so.
Among SME employers who used technologies or web-based software to sell to customers or manage the business, accountancy software (82%, 80% in 2024) was most commonly used, followed by payroll software (64%, 57% in 2024) and electronic invoicing (62%, as in 2024).
Use of these technologies and software were more common in larger SMEs:
- 95% of medium-sized and 89% of small businesses had used accountancy software, compared with 80% of micro businesses
- 87% of medium-sized and 80% of small businesses used payroll software, compared with 60% of micro businesses
- 74% of medium-sized and 66% of small businesses used electronic invoicing, compared with 61% of micro businesses
- 69% of medium-sized and 44% of small businesses used HR management software, compared with 18% of micro businesses
- 55% of medium-sized and 44% of small businesses used Customer Relationship Management (CRM), compared with 27% of micro businesses
- 46% of medium-sized and 42% of small businesses used booking software, compared with 29% of micro businesses
12. Future plans
12.1 Growth ambitions
In the data tables accompanying this publication, table 145 shows whether or not SME employers aim to grow sales over the next 3 years.
About 71% of SME employers aimed to grow sales over the next 3 years, the same proportion as in 2024 but down 4 percentage points on 2023.
Medium-sized and small businesses were more likely to report this intention (89% and 85%) than micro businesses (68%). This compares with 89%, 85% and 67% in 2024, and 92%, 85% and 72% in 2023, highlighting little change on 2024 but a decrease among medium-sized and micro businesses compared with 2023.
Figure 20: Percentage of SME employers that aim to grow sales of the business over the next 3 years, by employment size and year

SME employers in the transport and storage (81%, 72% in 2024), arts and entertainment (79%, 82% in 2024), retail and wholesale (79%, 77% in 2024), manufacturing (79%, 75% in 2024) and information and communications (77%, 74% in 2024) sectors were most likely to aim to grow. Those in health (57%, 64% in 2024), other services (60%, 62% in 2024), primary (63%, 60% in 2024) and construction (63%, as in 2024) sectors were least likely to be aiming to grow.
Figure 21: Percentage of SME employers that aim to grow sales of the business over the next 3 years, by sector

By nation, growth ambition was similar across Wales (74%, 71% in 2024), Northern Ireland (72%, 74% in 2024), England (71%, as in 2024) and Scotland (70%, 71% in 2024).
12.2 Plans to undertake growth-related activities over the next 3 years (Cohort B)
In the data tables accompanying this publication, table 12 (Cohort B) shows what plans SME employers have for the business over the next 3 years.
SME employers were asked about plans to implement various growth-related activities over the next 3 years. Of all SME employers:
- 59% planned to increase workforce skills (3 percentage points down on 2024)
- 44% planned to recruit new staff in the UK (3 percentage points down on 2024)
- 36% planned to increase the leadership capability of managers (2 percentage points down on 2024)
- 33% planned to introduce new working practices (7 percentage points down on 2024)
- 32% planned to develop and launch new products or services (1 percentage point down on 2024)
- 30% planned to work towards a target to reduce carbon/greenhouse gas emissions/other emissions (9 percentage points down on 2024)
- 27% planned to invest in premises, machinery or other types of capital investment in the UK (2 percentage points down on 2024)
- 19% planned to invest in R&D (3 percentage points down on 2024)
- 14% planned to increase export sales or begin selling to new overseas markets (as in 2024)
- 4% planned to recruit new staff in overseas offices (as in 2024)
- 3% planned capital investment overseas (as in 2024)
- 2% planned to transfer staff from the UK to overseas offices (1 percentage point up on 2024)
- 1% planned to decrease export sales or reduce the number of overseas markets they sell to (1 percentage point down on 2024)
Figure 22: Percentage of businesses undertaking specified growth-related activities, by type of activity (Cohort B only)

Micro businesses were less likely to plan any type of growth-related activity than small and medium-sized businesses:
- compared with 77% of small businesses and 82% of medium-sized, 55% of micro businesses planned to increase the skills of the workforce
- some 38% of micro businesses planned recruitment of new staff in the UK, compared with 70% of small businesses and 78% of medium-sized businesses
- while 48% of small businesses and 56% of medium-sized planned to introduce new working practices, just 30% of micro businesses planned this
- around 31% of micro businesses planned to increase the leadership capability of managers, compared with 56% of small businesses and 73% of medium-sized businesses
- medium-sized businesses were twice as likely as micro businesses to have planned capital investment in the UK (51% and 25% respectively, compared with 36% of small businesses)
- medium-sized businesses were also twice as likely as micro businesses to have planned to invest in R&D (34% and 17% respectively, compared with 24% of small businesses)
- some 27% of micro businesses planned to work towards a target to reduce carbon/greenhouse gas emissions, compared with 41% of small businesses and 56% of medium-sized businesses
There was some variation in the intentions of SME employers across sectors:
- those in health (82%), information and communications (75%) and manufacturing (70%) were most likely to plan to increase the skills of the workforce
- plans to recruit new staff in the UK were particularly common within health (67%) and manufacturing (57%) sectors
- those in health (51%), education (48%) arts and entertainment (47%) and finance and real estate (42%) were most likely to plan to introduce new working practices
- those in transport and storage (48%), manufacturing (43%) and primary (40%) sectors were most likely to plan to work towards a target to reduce carbon/greenhouse gas emissions/other emissions
- those in other services (56%), health (48%) and manufacturing (46%) were most likely to plan to increase leadership capability
- those in information and communications (61%) and manufacturing (55%) were most likely to plan to develop and launch new products and services
- those in primary (51%) and manufacturing (47%) sectors were most likely to plan to make capital investments in the UK
- those in manufacturing (42%), information and communications (40%) and professional and scientific (25%) were most likely to plan to invest in R&D
- those in manufacturing and information and communications (both 32%) were most likely to plan to begin selling to new overseas markets
13. Profiles of SMEs
This section provides a snapshot of SME employers in terms of their characteristics and ownership.
13.1 Changes in the organisation in the last 12 months (panel only)
In the data tables accompanying this publication, table 4 outlines the changes in the business in the last 12 months.
SME employers that were panellists – that is, those that had also taken part in 2024 – were asked whether a number of changes had occurred in the last 12 months. The changes and the percentage of respondents reporting that such changes had occurred are as follows:
- 17% had gained or lost directors in day-to-day control of the organisation
- 7% had changed their ownership structure
- 4% had opened or closed a new branch, site or office
- 1% had moved their head office
- 1% had changed their legal status
- 1% had changed the principal activity of their business
- less than 1% became VAT registered for the first time
- for 76%, none of these changes had occurred
13.2 Number of sites
In the data tables accompanying this publication, table 6 provides detail on the number of sites operated from by SME employers.
The majority of SME employers (89%) reported operating from a single site and 11% reported operating from multiple sites. The percentage of SME employers operating from a single site was up 1 percentage point on 2024 and 2023.
The proportion of SME employers operating from multiple sites increases as the number of employees within the enterprise increases, with 48% of medium-sized businesses reporting multiple sites, compared with 23% of small and 8% of micro businesses. This compared with 51%, 22% and 8% respectively in 2024.
SME employers operating in transport and storage (17%, 3 percentage points down on 2024), health (17%, 2 percentage points down) and finance and real estate (15%, up 3 percentage points) sectors were most likely to have multiple sites.
13.3 Business premises in residential settings
In the data tables accompanying this publication, table 22 shows whether they have a separate business premises or work from home premises.
Around 31% of SME employers have business premises in their home or the home of the business owner. This is 1 percentage point higher than in 2024, 2 percentage points higher than in 2023 and 7 percentage points higher than in 2022, and as in 2021. There continues to be a higher level of home-based businesses compared with pre-COVID-19, when, in 2019, just 19% of SME employers reported working out of a home.
By employment size, 36% of micro businesses run their business from a domestic address (as in 2024, 2 percentage points higher than in 2023), compared with 6% of small businesses (1 percentage point higher than in 2024 and 2023) and 1% of medium-sized businesses (1 percentage point lower than in 2024 but the same as in 2023).
By sector, the proportions of SME employers that operate out of a domestic address are highest in primary (62%, 60% in 2024), information and communications (51%, 46% in 2024), construction (46%, 47% in 2024), professional and scientific (46%, 45% in 2024), and administration (37%, 34% in 2024,) sectors.
Those in manufacturing (8%, 11% in 2024), retail and wholesale (12%, 10% in 2024), health (14%, 18% in 2024) and other services (15%, as in 2024) sectors were least likely to be home based.
Home-based businesses were most prevalent in Northern Ireland (34%, 32% in 2024) than in England (31%, 30% in 2024) and Wales (30%, 32% in 2024) and Scotland (28%, 29% in 2024).
13.4 Age of business
In the data tables accompanying this publication, table 18 shows the summary age of the business.
Among all SME employers, 7% had started trading within the preceding 5 years, that is between 2020 and 2025 (down 2 percentage points on 2024); 14% had started trading between 6 and 10 years previously (as in 2024); 30% had started trading between 11 and 20 years previously (up 1 percentage point), while 49% have been established 21 years or more (up 1 percentage point).
Small and medium-sized businesses tended to be older than micro businesses. Some 7% of micro businesses were aged between 0 and 5 years (10% in 2024), compared with 3% of small businesses (6% in 2024,) and 3% of medium-sized ones (5% in 2024). At the other end of the scale, 46% of micro businesses were aged 21 or more years (as in 2024), compared with 59% of small businesses (57% in 2024), and 64% of medium-sized businesses (63% in 2024).
By sector, those most likely to be aged between 0 and 5 years were in accommodation and food services (12%, 13% in 2024). Those most likely to have been trading 21 years or more were in primary (72%, 73% in 2024), other sectors (65% as in 2024) and manufacturing (63%, 59% in 2024).
By nation, SME employers in Northern Ireland (18%, 14% in 2024) were more likely to be aged between 0 and 5 years than those in Wales (10%, 12% in 2024), Scotland (8%, 7% in 2024) and England (6%, 9% in 2024).
13.5 Legal status
In the data tables accompanying this publication, tables 15 and 16 show the legal status of the SME employer.
Some 74% of SME employers in our survey were private limited companies, limited by shares (as in 2024), 7% were sole proprietors (up 1 percentage point on 2024), 6% were partnerships (7% in 2024), 6% were private companies limited by guarantee (CLGs) (down 1 percentage point on 2024), and 1% were limited liability partnerships (LLPs) while 2% were charitable incorporated organisations (CIOs) (both as in 2024).
Micro businesses were more likely than larger businesses to be sole proprietorships – 8%, compared with 3% of small and less than 1% of medium-sized businesses. Small (77%) and medium-sized (82%) businesses were more likely than micro (73%) businesses to be private companies limited by shares.
Not-for-profit enterprises often had alternative legal statuses, tending not to be limited by shares, sole proprietors, or any form of partnership. They were mainly CLGs, although others were IPS (Industrial and Provident Societies), CIOs, CBS (Community Benefit Society), CICs (Community Interest Company) or described themselves as trusts, friendly societies, co-operatives, royal charter companies or unincorporated associations. Overall, 3% of SME employers had these alternative legal statuses (7% in 2024).
These alternative legal statuses were most common in other services (26%), health (17%), education (16%) and arts and entertainment (10%) sectors.
13.6 Registered charity status
In the data tables accompanying this publication, table 5 shows if the SME employer is a registered charity.
In 2025, 6% of SME employers were registered charities (as in 2024). Micro businesses were less likely than small and medium-sized businesses to be registered charities. Some 6% of micro businesses were registered charities, compared with 7% of small and 8% of medium-sized businesses.
Of those with alternative legal statuses, as described above, 51% had charitable status (45% in 2024). Of those with more common legal statuses (sole proprietorships, companies, partnerships), no more than 3% were registered charities.
Charitable status was most common in the health (43%), other services (41%), education (29%), and arts and entertainment (21%) sectors.
13.7 Number of owners/partners/directors
In the data tables accompanying this publication, tables 28 and 29 provide the number of owners, partners and directors.
In 2025, 62% of SME employers had no directors in day-to-day control of the business who were not owners or partners (69% in 2024 and 75% in 2023), while 18% reported having one director (15% in 2024 and 12% in 2023), 12% had 2 directors (9% in 2024 and 7% in 2023), 5% had between 3 and 5 (4% in 2024 and 3% in 2023) and 1% had 6 or more (as in 2024 and 2% in 2023).
There was little change in the number of owners, partners or directors reported by SME employers compared with 2024, around 41% of SME employers reported having no more than one owner, partner or director (as in 2024 and 42% in 2023), 37% reported having 2 (as in 2024 and 2023), 19% reported having between 3 and 5 (17% in 2024 and 2023) and 4% having 6 or more (as in 2024 and 2023).
The number of owners, partners and directors increases with employment size, with 43% of micros having no more than one owner, partner or director compared with 28% of small and 22% of medium-sized businesses.
13.8 Family-owned businesses
In the data tables accompanying this publication, tables 25, 26 and 27 show whether the business is classified as family owned.
Overall, 69% of SME employers were majority-owned by the person or family who set it up (down 4 percentage points on 2024 and down 2 percentage points on 2023). In 2025, as previously, 98% of these businesses, the person or family who majority-owned the business was actively involved in managing it. Note that we classify businesses with just a single owner or partner as family businesses, but not those without any owners.
Family-owned businesses were more common among smaller enterprises, comprising 71% of micro businesses, 60% of small businesses and 51% of medium-sized businesses.
By sector, family businesses were most likely in primary (80%), retail and wholesale (76%) construction (76%) and administration (74%) sectors.
13.9 Women-led businesses
In the data tables accompanying this publication, tables 39 and 40 show whether the business is classified as women-led, table 30 provides more detail on the proportion of women owners and directors.
Women-led businesses are defined as those majority-led by women, that is, controlled by a single woman or having a management team of which a majority are women. In 2025, 19% of SME employers were women-led. This was 5 percentage points higher than in 2024 and 4 percentage points higher than in 2023.
There were fewer women-led medium-sized businesses (15%), compared with small and micro businesses (both 19%), which is a consistent trend across the years.
Women-led businesses were most likely in health (42%), education (36%), other services (30%), accommodation and food (26%) and professional and scientific (23%) sectors. It should be noted that in the service sectors of education, health, arts and entertainment and other services, about one in 5 respondents were unable to provide sufficient information in order to identify them as women-led or not.
While 19% of SME employers were women-led, a further 22% were ‘equally-led’, with an equal number of men and women in the management team (4 percentage points down on 2024 and3 percentage points down on 2023).
A further 10% of SME employers had women in the minority in the management team (as in 2024, 9% in 2023 and 11% in 2022), and 45% were entirely male-led (43% in 2024, 44% in 2023).
It was not possible to classify 4% of all SME employers as women-led or male-led, as there was insufficient information provided for these businesses (uncertainty regarding owners/partners’ gender or refusal to supply the information). The 2025 survey findings suggest that more SME employers were women-led reversing the recent downward trend in this respect, however, there is a 1 percentage point decrease in SME employers who included any women in their management teams.
13.10 Minority Ethnic Group-led businesses
In the data tables accompanying this publication, table 41 shows whether the SME employer is classified as led by people from minority ethnic groups.
About 6% of SME employers were minority ethnic group led (MEG-led), defined as having a person from an ethnic minority in sole control of the business or having a management team with at least half of its members from minority ethnic groups. This proportion has changed little over the course of the survey that has run from 2015 to 2025 (no change on 2024, 1 percentage point lower than in 2023), and there has also been little change in the proportions of MEG-led SME employers by employment size; 6% of micros, 6% of small and 7% of medium-sized businesses.
MEG-led SME employers were more likely in health (13%) and professional and scientific (8%) sectors. They were less likely in primary (1%), manufacturing (3%) and construction (4%) sectors.
Overall, 7% of all SME employers could not be classified as either MEG-led or non-MEG-led as there was insufficient information provided for those businesses (uncertainty regarding owners/partners’ ethnicity or a refusal to provide it).
13.11 Businesses leaders with a disability
In the data tables accompanying this publication, table 33 shows the number of owners, directors or partners with a disability, table 42 shows whether the sole owner has a disability, while table 37 shows whether the SME employer is classified as led by people (someone) with a disability.
Of those with more than one owner, director or partner, 9% reported one or more having a disability (as in 2024). This was higher among micro than small and medium-sized businesses (10%, 7% and 4% respectively).
By sector, SME employers in other services (25%), arts and entertainment (24%), transport and logistics (21%) and health (16%) were most likely to have at least one owner, director or partner with a disability. Those in construction (5%), manufacturing (6%) and wholesale and retail (6%) were least likely to report one of their senior leadership team having a disability.
Where there was just one owner, 5% were reported to have a disability (4% in 2024). This was higher in micro than small and medium-sized businesses (6%, 2% and 1% respectively).
By sector, sole owners with a disability were most common in other services (14%), transport and logistics (10%), arts and entertainment (10%), accommodation and food services (9%) and education (9%).
About 5% of SME employers reported being led by people with a disability (2% in 2024). This was defined as having a person with a disability in sole control of the business or having a management team with more than half of its members with disabilities. By employment size; 6% of micros, 2% of small and less than 1% of medium-sized businesses.
The term ‘disability’ was not defined in the question and survey participants were not asked about the nature of the disability.
Figure 23: Ownership of organisation, by year
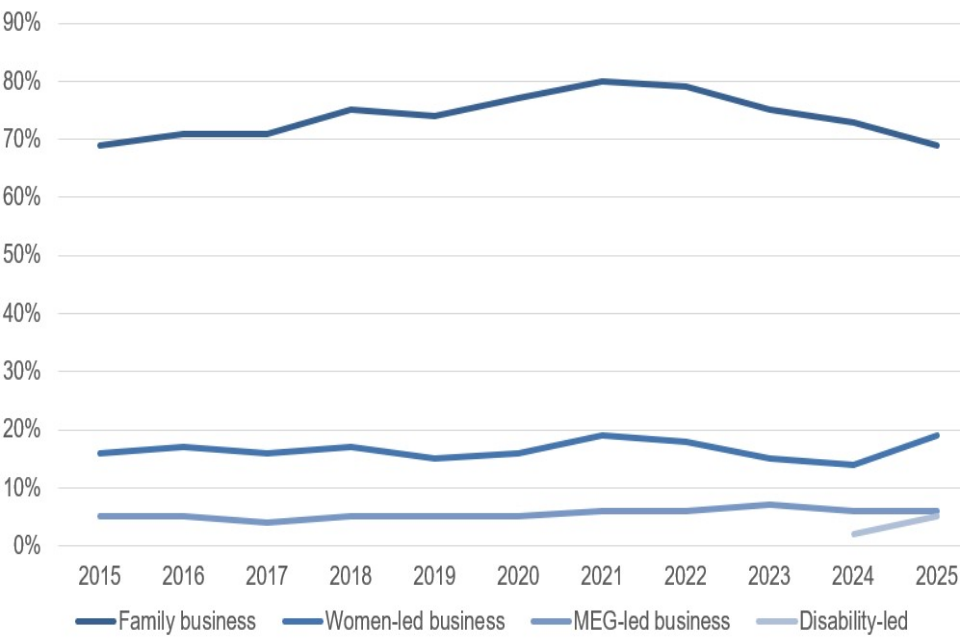
13.12 Businesses leaders that have served in the armed forces
In the data tables accompanying this publication, table 34 shows the number of owners, directors or partners that have served in the armed forces, table 38 shows whether the sole owner is an armed forces veteran, while table 43 shows whether the SME employer is classified as led by veteran (or veterans) of the armed forces.
When asked (for the first time in 2025) if any owners, directors or partners had previously served in the armed forces, of those with more than one owner, director or partner, 5% reported one or more as a veteran. This varied little by size of business: 5% within micro and small businesses, and 7% within medium-sized businesses.
By sector, SME employers in arts and entertainment (16%), transport and logistics (12%) and education (10%) were most likely to have at least one owner, director or partner who was a veteran of the armed forces. Those in information and communication (2%), primary industries (3%), wholesale and retail (3%) and finance and real estate (3%) were least likely to report one of their senior leadership team being a veteran.
Where there was just one owner, 3% were reported to be a veteran. It was low across all business sizes, but lower in larger businesses (3% in micros, 2% in small and 1% in medium-sized businesses.
By sector, sole owners who were veterans were most common in education (6%), transport and logistics (5%) and primary industries (5%).
About 3% of SME employers reported being led by veterans of the armed forces. By employment size; 3% of micros, 2% of small and 1% of medium-sized businesses.
14. Accompanying tables
The data tables below are available in Excel format and ODS for this publication:
- Longitudinal Small Business Survey 2025 SME employers – data
- Longitudinal Small Business Survey 2025: SME employers – data – Cohort A
- Longitudinal Small Business Survey 2025: SME employers – data – Cohort B
- Longitudinal Small Business Survey 2025: SME employers – data – Cohort C
The survey microdata will be deposited with the Secure Research Service and the UK Data Service during the autumn of 2026. This will be available to approved researchers.
15. Technical information
15.1 Aims of the survey
This report sets out some of the key findings for the 2025 Longitudinal Small Business Survey (LSBS), a large-scale telephone CATI (Computer Assisted Telephone Interviews) and online CAWI (Computer Assited Web-based Interviews) survey of 10,481 UK small business owners and managers, commissioned by the Department for Business, Innovation, Science and Trade (formerly Department for Business and Trade).
This survey is the latest in a series of annual and biennial Small Business Surveys (SBS) dating back to 2003. The 2025 survey was conducted between October 2025 and April 2026 by BMG Research Ltd.
The 2025 survey follows surveys conducted annually since 2015. Sample bases for each year from 2015 to 2025, are summarised in Table 1. The 2015 survey was the largest SBS undertaken, while the second highest sample was undertaken in 2018. The main reason for large sample sizes in both 2015 and 2018 was to enable the survey to have a longitudinal tracking element, so, in 2015, establishing, and in 2018 further boosting, a ‘panel’ of businesses that might be re-surveyed in subsequent years, enabling a detailed analysis of how combinations of factors affect business performance through time. Any panel has an element of attrition, hence the need for a large sample size in 2015 and a boost in 2018.
Table 1
| Year | Sample size |
|---|---|
| 2025 | 10,481 |
| 2024 | 10,611 |
| 2023 | 9,681 |
| 2022 | 9,524 |
| 2021 | 9,325 |
| 2020 | 7,636 |
| 2019 | 11,002 |
| 2018 | 15,105 |
| 2017 | 6,619 |
| 2016 | 9,248 |
| 2015 | 15,502 |
In 2025, 4,629 top-up interviews were conducted. This was in addition to 5,832 interviews with enterprises that had already completed at least one LSBS survey between 2015 and 2024. Top-ups were needed for the following reasons:
- to represent sections of the SME population that were not active in the 2024 survey fieldwork period (businesses less than one-year old)
- to represent sectors in the raw data that may be under-represented due to businesses in the panel closing, or being hard to secure an interview with (for example, in cases where businesses work away from their main offices)
All interviews were conducted with owner/proprietors, Managing Directors or other senior directors in UK-based enterprises. For the top-ups, named contact details were not supplied, and it was necessary to screen to find an appropriate respondent. The average interview length was 20.0 minutes (17.2 minutes for panellists, 22.9 minutes for top-ups).
The main aim of the survey is to collect a range of information on SMEs. The survey measures:
- recent turnover and employment growth
- capabilities (in terms of their ability to innovate, export, train staff, and so on)
- experience of accessing finance
- use of business support
- expectations of growing turnover and employment
- the major obstacles that prevent SMEs fulfilling their potential
- the characteristics of SMEs such as the number of sites they occupy, the number of owners, whether they have separate business premises, whether they are a social enterprise and so on
- the characteristics of their owners and leaders
There are 3 main reports based on the 2025 LSBS:
- a cross-sectional report based on SME employers. A cross-sectional report is a snapshot of the state of SMEs at any stage in time, this one being from the latter quarter of 2025 up to and including the first quarter and first half of the second quarter of 2026
- a cross-sectional report based on businesses with no employees
- a longitudinal report based on those businesses that responded in the last 4 years of the survey. This looks at the main changes that apply to the ‘panellists’ from year to year, and what appears to influence these changes
Some 20 of the 10,481 interviews were with large employers with 250 or more employees. The reason for interviewing these is that these businesses were SMEs when first interviewed but have grown since. They form a part of the longitudinal analysis, but not the cross-sectional.
15.2 Survey method
Of the 10,611 interviews conducted in 2024, 8,919 (84%) agreed to a follow-up interview. The objective was to obtain the highest possible number of repeat interviews with these panellists. 4,406 were interviewed between October 2025 and April 2026 (49%, lower than in 2024 – 57%, and 2023 – 54%, 2022 – 60% and 2021 – 62%). Of these, 706 had no employees, 12 were large businesses with 250 or more employees, and the remainder (3,700) were SME employers. This group is known as the ‘full panel’.
In addition, 9,389 businesses interviewed from 2015 to 2023 but not in 2024 could be re-approached for interview (they had given permission for re-interview and had not refused to take part between 2015 and 2023 and had not ceased trading). 1,426 of these were interviewed in 2025, a response rate of 15% (16% in 2024, 18% in 2023, 16% in 2022 and 18% in 2021), of which 196 had no employees, 1,230 were SME employers, and 8 were large businesses with 250 or more employees. This group is known as the ‘past panel’.
In addition to these, 4,629 ‘top-up’ interviews were conducted, of which 1,537 had no employees and 3,092 were SME employers. As a result, the total sample size in the 2025 survey was 10,481, of which 2,439 had no employees, 8,022 were SME employers and 20 were large employers (250 or more employees).
The top-ups were sampled using a method consistent with the 2015 to 2024 surveys:
- the sample was stratified within each of the 4 UK nations
- targets were set according to the employment size of enterprises and, within those targets, by 1-digit sector (using SIC 2007)
- the targets over-represented businesses with 5 to 249 employees substantially in comparison to their actual numbers within the business population
For registered businesses, the Inter Departmental Business Register (IDBR) was used as the sample source. For unregistered businesses with no employees, a database from the commercial database provider MailingLists was used. These contacts were screened out if they either had employees on their payroll or paid VAT, as these would have duplicated contacts found within the IDBR.
In addition, in 2025, as in 2024, we used a commercial panel to identify very small-scale unregistered businesses within the general UK population. Many unregistered businesses promote themselves via word-of-mouth and social media and may be missing from traditional business lists as a result.
The IDBR is a record of all UK enterprises that pay VAT or PAYE, which contains around 2.7 million unique entries for enterprises. The BIST Business Population Estimates (BPE) publication 2025 estimated around 5.7 million enterprises in the UK in total. The difference in the figures is explained by the number of unregistered enterprises that do not pay VAT or PAYE, estimates of which derive from the Labour Force Survey (LFS). For unregistered businesses with no employees, therefore, a database from the commercial database provider Market Location was used to identify these businesses that were missing from the IDBR. These contacts were screened out if they either had employees on their payroll or paid VAT, as these would have duplicated contacts found within the IDBR.
The targets within the sample stratification matrix were informed by the 2024 BPE, the latest available at the start of fieldwork. However, survey findings were weighted to the 2025 BPE which were published a few months into the fieldwork period. The 2025 BPE was used for weighting as it more accurately represents the IDBR contacts used for the survey, as well as providing a more up-to-date picture of UK small businesses than the 2024 BPE.
A 336-cell sample stratification matrix was devised, the targets within each cell informed by the 2022 BPE. These cells were defined by cross classifying the following 3 categories:
- 14 ‘one digit’ SIC 2007 categories (ABDE, C, F, G, H, I, J, KL, M, N, P, Q, R, S)
- 6 size categories (unregistered 0 employees, registered 0 employee, 1 to 4 employees, 5 to 9 employees, 10 to 49 employees, 50 to 249 employees)
- 4 nations (England, Scotland, Wales, Northern Ireland)
Once the sample was drawn, with sample sizes informed by differential likely tele-matching success rates for each cell (based upon experience from the previous surveys), no quotas were employed on size, sector or any other criteria except for country, where minimum sample sizes were sought within Northern Ireland, Scotland and Wales.
A review of the 2024 questionnaire was undertaken through consultations with stakeholders. This resulted in a number of alterations to existing questions from previous surveys, new question additions and deletions. The changes were informed by the requirement to balance stakeholders’ latest needs with the desire to exploit the longitudinal power of the survey. The consultation was followed up by a ‘live’ pilot of 100 interviews of the adjusted year 10 questionnaire.
Based on the whole sample, the response rate for full panellists was 49%, 8 percentage points lower than in 2024 and 5 percentage points lower than in 2023. For past panellists the response rate was 15%, 1 percentage point lower than in 2024 and 3 percentage points lower than in 2023. For IDBR top-ups the response rate was 4%, as in 2024 and 2023. There is more detail in the technical report, which includes tele-matching rates and other forms of non-response.
15.3 Note on this report
Please note that the findings presented in this report relate to SME employers only - Enterprises with no employees, and large employers, have been excluded from the dataset on which this report is based. This procedure is consistent with reporting of previous surveys. The overall sample size for SME employers across the UK in 2025 was 8,022.
15.4 Sample cohorts
One of the main reasons given by respondents who do not want to participate in LSBS is that the interview length is too long. In 2018, the department made a commitment to bring down the average interview length and introduced ‘cohort questions’, which we used again in 2025.
Three cohorts (A, B and C) were created. Each cohort was exclusively asked a series of non-key questions. For example, only Cohort A was asked questions on business energy usage. Cohorts were chosen for respondents at random during their interview.
There were approximately 3,500 respondents in each 2025 cohort: 3,566 in Cohort A, 3,503 in Cohort B and 3,412 in Cohort C. Each respondent is part of one cohort only. Where a business is in each of the datasets from 2018 to 2025, its cohort for 2025 is entirely independent of its cohorts between 2018 and 2024 (for example, knowing a business was in Cohort A in 2018 tells you nothing about which cohort it is in in 2024). Because of the different respondents answering questions for different cohorts, we have calculated separate cohort weights for analysing responses to the cohort questions. To analyse questions asked of Cohort A in 2018, analysts should use the 2018 Cohort A weights, for questions to Cohort C in 2019 they should use the 2019 Cohort C weights, and so on.
15.5 Sector definitions
Throughout this report, data tables show sectoral analysis by one-digit SIC 2007 codes. Because of relatively small numbers in the business population and survey sample, some of these sectors are grouped together: ABDE, labelled as ‘primary’, comprises:
- (A) agriculture, fishing and forestry
- (B) mining and quarrying
- (D) electricity and gas
- (E) water, sewerage and waste management
KL, labelled as ‘financial and real estate’, comprises (K) finance and insurance, and (L) real estate.
To gain a better picture of the types of businesses that fall into each sector category, the following gives the most populous sub-sectors for SME employers at the 3-digit level:
- ABDE (primary) – there were 59,100 UK SME employers in this sector in 2025. The sector is dominated by farming but also includes mining and quarrying, and utilities such as electricity and gas. The 3 most populous sub-sectors within the category were animal production (38%), growing of non-perennial crops (21%) and mixed farming (12%)
- C (manufacturing) – there were 83,100 UK SME employers in this sector in 2025. Manufacturing is the most classified sector, with 95 3-digit SIC codes. The most populous sub-sectors within the category were treatment and coating of metals (9%), manufacture of wood, cork, straw products and printing (each 7%) and repair of fabricated metal products, machinery and equipment (8%)
- F (construction) – there were 193,400 UK SME employers in this sector in 2025. The most populous sub-sectors within the category were electrical and plumbing (30%), building completion (23%) and building construction (19%)
- G (retail and wholesale) – there were 241,300 UK SME employers in this sector in 2025. The most populous sub-sectors within the category were retail sale of other goods in specialised stores (16%), maintenance and repair of motor vehicles (14%), and retail sale in non-specialised stores (13%)
- H (transport and storage) – there were 45,000 UK SME employers in this sector in 2025. The most populous sub-sectors within the category were road freight transport (47%) and other passenger land transport (mainly taxi businesses, 18%)
- I (accommodation and food service) – there were 144,900 UK SME employers in this sector in 2025. The most populous sub-sectors within the category were restaurants (66%) and beverage serving activities (pubs and bars – 18%)
- J (information and communications) – there were 76,300 UK SME employers in this sector in 2025. The most populous sub-sector within the category was computer programming and consultancy (68%)
- KL (financial and real estate) – there were 76,800 UK SME employers in this sector in 2025. The most populous sub-sectors within the category were estate agents (34%), property rentals (31%) and auxiliary financial services (13%)
- M (professional and scientific) – there were 186,000 UK SME employers in this sector in 2025. The most populous sub-sectors within the category were management consultancy (28%), architecture and engineering (19%) and accountancy (13%)
- N (administrative services) – there were 120,700 UK SME employers in this sector in 2025. The sector was dominated by ‘business support services not elsewhere classified’ (40%). This is a miscellaneous category. Sector N also included house and business cleaning (16%) and landscaping (10%), and employment placement agencies (9%)
- P (education) – there were 22,400 UK SME employers in this sector in 2025. The most populous sub-sector within the category was ‘other education’ (60% for example, driving schools and sports coaches). The next most populous was pre-primary education (13%)
- Q (human health and social work) – there were 63,400 UK SME employers in this sector in 2025. The most populous sub-sectors within the category were medical and dental (40%), non-residential social work activities and other human health activities (each 19%)
- R (arts and entertainment) – there were 29,000 UK SME employers in this sector in 2025. The most populous sub-sectors within the category were sports activities (45%), creative and arts (33%) and amusement and recreation (17%)
- S (other services) – there were 68,200 UK SME employers in this sector in 2025. The sector was dominated by ‘other personal service activities’ (87%). This includes hairdressing and beauty, funeral directors and dry-cleaning
Much more detail on the sectors is available in the BIST Business Population Estimates.
15.6 Uncertainty
Since the LSBS questioned a sample of UK SMEs, rather than all of them, there is inevitably a level of uncertainty around the estimates we derive from the survey and how close they will be to the true values.
15.7 Coverage and representativeness
Users might wonder if the sample we have used is adequately representative of the target population (the UK SME population). We have drawn our sample from 3 sampling frames. One is the IDBR from the Office for National Statistics (ONS), which has excellent coverage of registered businesses in the UK, as it is regularly updated with information from HMRC and ONS surveys. We use the commercial database provider Market Location to provide us with a sample of unregistered businesses, and a commercial panel to include businesses not registered for VAT or PAYE.
The coverage of the unregistered business population is less well understood. It is likely that the Market Location frame is good for well-established businesses that advertise their presence in trade directories for example. Small businesses that rely on word of mouth, or platforms such as Facebook or Instagram for business and have no wish to expand are unlikely to be included in either of the sampling frames.
Our sample is deliberatively unrepresentative in the sense that it overrepresents larger SMEs, and also over-represents non-English businesses. This is to ensure that we have reasonable sample sizes for medium-sized businesses, Scottish businesses and so on, otherwise we would not be able to obtain robust estimates for important subgroups. A truly proportionate sample would otherwise contain just a handful of medium-sized businesses. We produce survey weights so that analysts can nevertheless arrive at estimates that take due account of the actual distributions in the population – micro businesses have larger weights than medium-sized businesses for example.
Another way that our sample might be unrepresentative is that the businesses that take part in the survey (which is after all voluntary) are different from the businesses that we sample but do not agree to take part, with respect to the various questions we ask. This is known as non-response bias. For example, if struggling businesses are more likely to refuse to take part than thriving ones, then our final achieved sample will underrepresent struggling businesses, and estimates of things like future ambition, that might differ considerably between struggling and thriving businesses.
It is hard to quantify non-response bias. We have taken a number of standard steps to try to minimise its risk. The research company that conducted our interviews made multiple attempts for each sampled business for which we could obtain a telephone number, so that we can get more of the reluctant businesses, and we did not have hard quotas for each of our ‘target cells’ (quotas for a target cell, for example 25 interviews of micro businesses in finance and real estate in Wales, can encourage an interviewer to give up quickly on reluctant businesses and focus on snapping up as many easier businesses as possible in order to meet their quota as quickly as possible). Sampled businesses were also given contact details for government officials so they could confirm the survey was genuine and official.
15.8 Sampling uncertainty
It is possible to quantify the amount of uncertainty that arises from using a sample instead of interviewing the entire population. There are a few ways of doing this, but we will focus on using a statistical tool known as confidence intervals.
In order to run our survey, we drew a random sample. This means that on another day we would have drawn a different sample. With our actual sample, we estimated that 76% of SME employers in 2025 made a profit or generated a surplus in the previous financial year. But it is possible that another random sample might have found that number to be within +/-1.0% even though the actual true figure is unchanging. This is known as sampling variability.
What we can do is produce a 95% confidence interval around an estimate. The interval is calculated using a method that, for 95% of the possible random samples we could have drawn, will produce an interval that contains the true value of this profitability measure. Each different random sample would have a different confidence interval, but 95% of the time the interval produced will contain the true value. So, our actual survey estimate is 76%, and we are 95% confident that the true value is in the range 75% to 77%.
Our survey contains hundreds of measures, and it is not practical to produce confidence intervals for each one of them. Instead, Table 2 summarises the sampling uncertainty for the key measures reported in this publication.
Most of the estimates from this survey are presented as proportions or percentages (such as 10%). If this was an estimate relating to all UK SME employers, then we look at the ‘all UK’ row and the column for estimates at 10%. The confidence interval is given as +/- 0.7%. So, our confidence interval around the 10% estimate is 10% +/- 0.7%, that is, from 9.3% to 10.7%. We are 95% confident that the true figure is between 9.3% and 10.7%.
If the estimate had been closer to 30% or to 70%, then our interval would have used +/-1.0% according to Table 2. When estimates are close to 50%, that is the ‘worst case scenario’ in the sense that the confidence intervals are at their widest. They narrow more as the estimate moves away from 50% (in either direction). So, the intervals are slightly narrower for 30% or 70% estimates, and narrower still for 10% and 90% estimates.
Confidence intervals get narrower when you have larger sample sizes too. If our 10% estimate is for medium-sized SME businesses rather than for all UK SME employers, we use a different row of the table and find the confidence interval to be 10% +/- 1.7%. If we have an estimate of 65% for the medium-sized businesses, that is close to 70% so we use that column of the table and arrive at an approximate confidence interval of 2.6%.
Table 2 is useful for estimates of proportions but cannot be used for other measures. For example, we have estimated a mean amount of external finance sought by SME employers as £480,600.
Table 2 cannot be used to produce a confidence interval for this estimate, though it can be done, it is +/- £197,980. The underlying data tables published alongside this report contain ‘standard errors’ for estimates that are not proportions, such as amount of finance sought, or number of employees. Standard errors are another way of quantifying the sampling variability. As a rule of thumb, twice the standard error gives you the ‘+/-’ for a 95% confidence interval, which is how we calculated the +/- £197,980 figure above.
Table 2
| Sample size | Confidence interval for an estimate of 10% or 90% +/- (%) | Confidence interval for an estimate of 30% or 70% +/- (%) | Confidence interval for an estimate of 50% +/- (%) | |
|---|---|---|---|---|
| All UK | 8,022 | 0.7 | 1.0 | 1.1 |
| England | 6,039 | 0.8 | 1.2 | 1.3 |
| Scotland | 887 | 2.0 | 3.0 | 3.3 |
| Wales | 646 | 2.3 | 3.5 | 3.9 |
| Northern Ireland | 450 | 2.8 | 4.2 | 4.6 |
| Micro businesses (1 to 9 employees) | 3,893 | 0.9 | 1.4 | 1.6 |
| Small businesses (10 to 49 employees) | 2,978 | 1.1 | 1.6 | 1.8 |
| Medium-sized businesses (50 to 249 employees) | 1,151 | 1.7 | 2.6 | 2.9 |
| ABDE. Primary sector | 253 | 3.7 | 5.6 | 6.2 |
| C. Manufacturing | 755 | 2.1 | 3.3 | 3.6 |
| F. Construction | 908 | 2.0 | 3.0 | 3.3 |
| G. Retail and wholesale | 1,426 | 1.6 | 2.4 | 2.6 |
| H. Transport and Storage | 318 | 3.3 | 5.0 | 5.5 |
| I. Accommodation and Food | 757 | 2.1 | 3.3 | 3.6 |
| J. Information and communication | 343 | 3.2 | 4.8 | 5.3 |
| KL. Finance and real estate | 341 | 3.2 | 4.9 | 5.3 |
| M. Professional and scientific | 930 | 1.9 | 2.9 | 3.2 |
| N. Administration and support | 633 | 2.3 | 3.6 | 3.9 |
| P. Education | 197 | 4.2 | 6.4 | 7.0 |
| Q. Human health | 603 | 2.4 | 3.7 | 4.0 |
| R. Arts and entertainment | 236 | 3.8 | 5.8 | 6.4 |
| S. Other services | 322 | 3.3 | 5.0 | 5.5 |
For cohort questions, the margins of error increase by about 70% – for example +/- 2.0% becomes +/- 3.4% (to increase a number by 70%, multiply it by 1.7). This table applies to estimates of proportions.
15.9 Statistically significant differences
Generally, throughout this report where we talk about differences (between the estimate for a subgroup and the total, say, or between 2 subgroups) we mean they are different even after taking account of the sampling variability. This is often described as statistically significant. Where we simply list numbers that are different – for example ‘England (41%), Scotland (38%), Wales and Northern Ireland (both 36%)’ – this does not necessarily mean that they are statistically significantly different from each other. Where we draw attention to some estimate being ‘higher’, or a subgroup being ‘most likely’, or single out a sector as higher than the rest, this is a statistically significant difference.
For example, suppose we have stated the following: exporters were most likely in manufacturing (45%, down 1 percentage point on 2024 and down 2 percentage points on 2023), information and communications (42%, up 2 percentage points on 2024 and up 1 percentage point on 2024), retail and wholesale (28%, up 2 percentage points on 2024, down 1 percentage point on 2023), and professional and scientific sectors (25%, down 1 percentage point on 2024 and down 2 percentage points on 2023). The sectors least likely to have exported were accommodation and food service (2%), health (2%), construction (4%), finance and real estate (4%) and other services (6%).
This does not mean that manufacturing businesses were statistically significantly more likely to have exported than those in information and communications, but both sectors were statistically significantly more likely than the rest of the SME employers to have done so, that is, they are more likely than average. Similarly, we are 95% confident that the 6 other sectors mentioned were less likely than average, even though there is some uncertainty over those specific figures of 1% and 2%.
16. Definitions
| Term | Description |
|---|---|
| Business, enterprise, firm | In this report these terms all mean the same – they are interchangeable. |
| Cohort | We use this term to describe the way the survey samples since 2018 are divided into 3 separate groups (the cohorts) and answer some questions that are for their cohort only. This was done to increase the number of questions asked in the survey without increasing the average length of interview. |
| Disability-led business | A business where at least half of the leadership team is reported as having a disability (the term, ‘disability’ was not defined for respondents, nor were respondents asked about the nature of the disability). |
| EFTA | European Free Trade Association. This comprises the countries of Iceland, Liechtenstein, Norway and Switzerland. The 3 countries apart from Switzerland are part of the European Single Market as members of the European Economic Area. |
| EU | The EU is the European Union. This comprises the countries of Austria, Belgium, Bulgaria, Croatia, Republic of Cyprus, Czechia, Denmark, Estonia, Finland, France, Germany, Greece, Hungary, Ireland, Italy, Latvia, Lithuania, Luxembourg, Malta, Netherlands, Poland, Portugal, Romania, Slovakia, Slovenia, Spain and Sweden. |
| Exports | In this report this means a British business selling goods or services to a customer outside the UK. An English business selling to a Northern Irish business is not exporting, but a Northern Irish business selling to a customer in the Republic of Ireland is exporting. |
| Family-owned business | This means a business where a majority of owners are in the same family. A business with a single owner is automatically a family-owned business, although a business with no owners is not. ‘Majority’ means more than half, but ultimately, we require the respondent to the survey to interpret this: where a business has more than one working owner or partner, they are simply asked if the business is family-owned and this is defined in the questionnaire as ‘majority-owned by members of the same family’. |
| Finance | In this report when we talk about businesses accessing finance or applying for finance, we usually mean borrowing money for business reasons. This might be from banks or other financial institutions or might be less formal arrangements such as money borrowed from friends and family. |
| Health sector | The health sector in this report is more accurately described as the ‘human health and social work sector’. It does not include veterinary services (which fall under the professional and scientific sector). As this survey covers the private sector, the National Health Service (NHS) does not come under the health sector for this survey; but private sector healthcare providers do. |
| Imports | In this report this means a British business buying goods or services from a business outside the UK. A Northern Irish business buying from a Welsh business is not importing, but a Northern Irish business buying from a business in the Republic of Ireland is importing. |
| Innovation | This refers to a business implementing a new or significantly improved product or process (which can also include new marketing methods or organisational methods). The international manual on collecting data about innovation is known as the Oslo Manual. |
| Longitudinal | A longitudinal study is one which collects data from the same unit at different times. We call this survey longitudinal because each year we try to re-interview businesses that took part in the survey in previous years. Analysts have specific methods for analysing longitudinal data. This report focusses on cross-sectional analysis – even when we refer to results from earlier years of the survey, we take no particular account of the fact that some businesses will have contributed to both years of the survey (in other words, the analysis is not longitudinal). We have longitudinal analysis in the panel report which we publish separately, and the dataset is available to approved researchers to perform their own longitudinal analysis if they wish. |
| Mean | A measure of the average which takes the total of whatever is being measured and divides it by the number of units being measured. (For example, mean turnover of micro businesses in 2025 is the total turnover of micro businesses in 2025 divided by the total number of micro businesses in 2025.) As the LSBS is a sample survey, the mean is estimated, as we can only estimate the relevant total for example. The mean is a common and well-known statistical measure, but it can be affected by extreme values which make it poor as a measure of the ‘typical’ value of whatever is being measured. This is often a problem with business statistics as there are often many ‘extreme’ values. |
| Median | The median is an alternative measure of the average which is not affected by extreme values in the way that the mean can be. As such it is often a better way of finding a ‘typical value’ of whatever is being measured. The median is the middle value of what is being measured if all the measured values are put into order from smallest to largest value. As with the mean, in the LSBS we can only estimate the median as we are working from a sample. |
| Medium-sized business | A business which has between 50 and 249 employees (whether they are full-time or part-time). These are the largest SMEs, since businesses with 250 or more employees are defined as large businesses in this survey. Alternative definitions of business size are sometimes used by other studies (which might include consideration of annual turnover or total assets belonging to a business). |
| MEG-led business | A business where at least half of the leadership team comes from minority ethnic groups (as this is a UK survey, minority ethnic groups are those that are not of any White background, including White British, where White British includes White English, White Scottish and so on). The leadership team comprises the directors and working owners. We can include members of several ethnic groups and can include people who describe themselves as mixed ethnicity where White British background is one of those ethnicities. |
| Micro business | A business which has between one and 9 employees (whether they are full-time or part-time). |
| National Minimum Wage, National Living Wage | The National Minimum Wage has been in operation in the UK since 1999. This sets a minimum value for the hourly rate of pay that employers must pay, though this level depends on the age of the employee and differs for apprentices. It does not depend on the size of the employing business. It is usually updated once a year following a (non-binding) recommendation by the Low Pay Commission but ultimately determined by the UK Government. The National Living Wage is a minimum wage that applies to workers from the age of 25 and has been in place since 2016. It was extended to 23-year-olds and 24-year-olds on 1 April 2021. As it is higher than the National Minimum Wage it effectively supersedes it for employees aged 25 or more. |
| PAYE | This stands for ‘pay as you earn’ and describes the system where employees’ taxes on income are deducted automatically from their pay before they are paid. If this is done accurately then the employee does not face an annual tax bill for these taxes. The relevance for this survey is that businesses that we describe as ‘unregistered’ will not be registered for PAYE with the UK tax authorities – so if a business is registered for PAYE, we know that it ought to be included in our sampling frame for registered businesses, the IDBR. |
| Private sector, public sector | The survey is one of private sector businesses, which are businesses where the government ‘does not exercise significant control over the general corporate policy’ of the business. The Office for National Statistics follows international guidance to determine whether something is in the public sector. For more information on their process, see UK economic statistics sector and transaction classifications: the classification process. Note that the private/public sector distinction is not the same as the market/non-market distinction, and in particular note that charities and social enterprises can be in the private sector (in fact the majority of these are). The ONS page has more detail on this. |
| R&D | This stands for ‘research and development’ and in this survey is usually referred to in the context of ‘R&D spending’, meaning spending on creative and systematic work to increase the stock of knowledge or to devise new applications of existing knowledge. The international manual on collecting data about R&D is known as the Frascati Manual. |
| Red tape | This is an informal term used to refer to regulations or requirements that are imposed on a business or person. In this survey it is sometimes cited by businesses as an obstacle. Different businesses may have different ideas as to what counts as red tape, and the ultimate source of regulations that are perceived as red tape could be governmental or non-governmental. |
| Registered business | In our survey we use ‘registered’ businesses to mean those that are registered for PAYE (and so are employers) or registered for VAT (and so have an annual turnover above a certain threshold set by the UK Government). In either of these cases such businesses ought to be included in our sampling frame for registered businesses, the IDBR. Some unregistered businesses do appear in the IDBR, but we use a separate sampling frame for unregistered businesses which has better coverage of them. |
| Sector | In this report businesses are classified into one of a number of non- overlapping sectors. We use the Standard Industrial Classification but have combined some of the categories to make them more practical for our survey. See the ‘sector definitions’ section of this report for more detail. |
| SIC 2007 | This is the specific version of the Standard Industrial Classification that is used for this survey, in common with most official statistics in the UK. For more detail on SIC 2007, see the ONS website. |
| Small business | A business which has between 10 and 49 employees (whether they are full-time or part-time). In some contexts, people use the term ‘small business’ to refer to all businesses that are smaller than large and medium- sized businesses (in other words all businesses with fewer than 50 employees) but in the LSBS we always use the narrower definition when referring to small businesses specifically. |
| SME | This stands for ‘small and medium-sized enterprises’, but this is commonly meant to refer to all businesses, firms and enterprises that have fewer than 250 employees, including those that have no employees at all. This means that in the LSBS ‘SMEs’ actually comprise business with no employees, micro businesses, small businesses and medium-sized businesses. |
| Surplus | Our survey includes not-for-profit enterprises and for many of these it is more appropriate to use the term ‘surplus’ to refer to an excess of revenue (money coming in, from all sources) over expenditure (money going out, for all reasons). |
| Trade credit | Trade credit is typically used to refer to when a business receives goods or services from another business but does not pay for it in full at the time of delivery. We ask about it in the survey in the section on finance, but we do not treat it as a form of external financing – rather, it is contrasted with late payments, so it is better thought of as a form of agreed delayed payment, with late payments a delayed payment that has not been agreed. |
| Turnover | In the LSBS this term is usually synonymous with ‘sales’. Although for the purposes of preparing accounts ‘turnover’ may be defined differently from ‘revenue’ or ‘sales’ we do not specify a particular definition in our questionnaire and assume that respondents interpret it to mean revenue from sales which do not take account of costs. |
| VAT | Value-added tax is tax which businesses are liable to pay if their annual turnover is above a certain threshold. Businesses which are registered for VAT with the UK tax authorities are considered to be ‘registered’ businesses for this survey and ought to be included in our sampling frame for registered businesses, the IDBR. |
| Veteran-led business | A business where at least half of the leadership team is reported as having served in the armed forces previously. |
| Women-led business | Women-led businesses are defined as those majority-led by women, that is controlled by a single woman or having a management team of which a majority are women. ‘Majority’ here means more than 50%. |
17. Further information
17.1 Future updates to these statistics
The Department for Business, Innovation, Science and Trade (BIST) intends to continue the survey for at least another wave. Fieldwork begins in October and runs up until the end of April each year. Interviewing for the 2025 survey took place between 27 October 2025 and 30 April 2026. We anticipate that the field dates for the 2026 survey will be similar to those of 2025.
17.2 Related statistics
The publication of statistics relating to businesses with no employees derived from the same survey is on the same day as this publication. Also, we will publish a panel report on the same day which focuses on businesses that have taken part in several waves of this survey and associated longitudinal analysis. The associated technical report, which will include the questionnaire used for the 2025 survey, will be published in autumn 2026.
The Scottish Government usually produces its own publication based on the same data but focused on Scottish businesses: Small Business Survey Scotland: 2024 to 2025.
BIST publishes the Innovation Survey which covers the topic of innovation in much greater detail, and covers large businesses (which the LSBS excludes) but not micro businesses and non-employers (which the LSBS includes). Also the National Survey of Registered Businesses (NSRB) which covers business sentiment around exporting and trade. The survey focuses on businesses with a turnover over £500,000 or more due to their higher potential to export.
As outlined elsewhere in this report BIST publishes the Business Population Estimates (BPE) which details the structure of the UK’s business population (and which the LSBS uses for determining sample sizes and for weighting). The BPE contains information about employment and turnover in different sectors and includes information at regional level as well as nationally.
The Office for National Statistics conducts many surveys of businesses, many of which cover topics that the LSBS examines too. A good starting place is the Annual Business Survey, which does not cover all the sectors of the economy but has very good coverage of large businesses.
The Department for Culture, Media and Sport (DCMS) publishes Social Enterprise Market Trends, which takes a deeper look at the social enterprises that are identified in the LSBS. BIST and DCMS worked to improve the survey questions used to identify social enterprises, with the new questions being used in the 2017, 2019, 2021, 2023 and 2025 surveys.
The Department for Education (DfE) conducts the Employer Skills Survey. The 2024 Employer Skills Survey was published in July 2025. For more information, see Employer Skills Survey.
17.3 Uses of these statistics
As a wide-ranging survey of SMEs, the LSBS is of interest to many government departments and agencies. Department for Energy Security and Net Zero makes use of the questions on energy use by SMEs to develop policies on business energy such as non-domestic smart meters. Statistics are used by the Government Equalities Office to monitor rates of women-led businesses in the SME population. The figures for MEG-led SMEs are published by the government’s Race Disparity Unit as part of its Ethnicity Facts and Figures service. BIST utilises LSBS data to analyse the export and import behaviours of UK SMEs, as well as the operation of the UK internal market. These insights also helped to inform the Small Business Strategy, as outlined in Backing your business: our plan for small and medium-sized businesses.
As mentioned above DCMS makes use of the social enterprises data and the Scottish Government uses the data for evidence and analysis on a broad range of policy areas.
In the past the Department for the Environment, Food and Rural Affairs (Defra) has analysed rural SMEs, and the Low Pay Commission has looked at what businesses say about the National Minimum Wage and National Living Wage. HM Revenue and Customs has sponsored questions looking at SME preparedness for the Making Tax Digital Programme. Innovate NI looks at Northern Irish companies and their innovation activities. The British Business Bank makes use of the data on access to finance.
The LSBS is increasingly widely used in the academic and research community, in the UK and abroad. We will run a mini competition later in 2026 for research teams to apply for small grants to conduct research using the latest LSBS data. For previous research papers, see Enterprise Research Centre’s Longitudinal Small Business Survey Research Showcase event.
The data will continue to be made available by the ONS Secure Research Service and the UK Data Service for approved researchers. The Family Business UK makes use of the survey in its ‘State of the Nation’ reports, and the Federation for Small Businesses has used the LSBS in its research work, for example the Unlocking Opportunity report.
17.4 User engagement
Users are encouraged to provide comments and feedback on how these statistics are used and how well they meet user needs. Comments on any issues relating to this statistical release are welcomed and should be sent to business.statistics@businessandtrade.gov.uk.
The department statement on statistical public engagement and data standards sets out the department’s commitments on public engagement and data standards as outlined by the Code of Practice for Statistics .
17.5 Statistics error and revision policy
The department statistics error and revision policy sets out the revisions policy for these statistics, which has been developed in accordance with the UK Statistics Authority Code of Practice for Statistics.
18. Pre-release access to statistics
Principle T3 of the Code of Practice for Statistics requires that access to official statistics before their public release is limited to certain individuals. This includes those involved in the production of the statistics and the preparation of the release, and those involved for quality assurance and operational purposes. Pre-release access may only be granted in accordance with the rules and principles set out in the Pre-release Access to Official Statistics Order 2008. In addition, the order requires that records are published of those who have access prior to public release.
Below is the list of roles for people who received pre-release access to Longitudinal Small Business Survey 2025:
- BIST Parliamentary Under Secretary of State
- BIST Special Advisers
- BIST Director, Analysis
- BIST Press Officers x2
- BIST SME Analyst x2
- Scottish Government Analyst x2
19. Contact
Responsible statistician: Jayshree Varsani
Email: business.statistics@businessandtrade.gov.uk
Media enquiries: 020 7215 2000
Public enquiries: 07741 703241