Segment Tool: statistical commentary, May 2022
Published 18 May 2022
Applies to England

© Crown copyright 2022
This publication is licensed under the terms of the Open Government Licence v3.0 except where otherwise stated. To view this licence, visit nationalarchives.gov.uk/doc/open-government-licence/version/3 or write to the Information Policy Team, The National Archives, Kew, London TW9 4DU, or email: psi@nationalarchives.gov.uk.
Where we have identified any third party copyright information you will need to obtain permission from the copyright holders concerned.
This publication is available at https://www.gov.uk/government/statistics/segment-tool-2022-data-update/segment-tool-statistical-commentary-may-2022
Main findings
This release of the Segment Tool provides aggregated data for the 2-year period 2020 to 2021, providing information on drivers of inequality in life expectancy during the COVID-19 pandemic.
The main findings are:
- in 2020 to 2021, provisional life expectancy for males in England was 8.6 years lower in the most deprived fifth of areas compared with the least deprived fifth of areas. For females, the gap was 7.1 years [footnote 1]
- for both sexes, 15% of the gap in life expectancy in England was due to higher mortality from COVID-19 in the most deprived fifth of areas compared with the least deprived fifth of areas. This equates to 1.3 years of the gap for males and 1.1 years for females
- over half of the gap in England was due to higher mortality rates from circulatory disease (heart disease and stroke), cancer and respiratory disease in the most deprived fifth of areas compared with the least deprived fifth. For males, just under a quarter of the gap (23%) was due to higher mortality from circulatory disease in the most deprived fifth of areas. 16% of the gap was due to higher mortality from cancer
- for females, higher mortality rates from circulatory disease and cancer in the most deprived fifth of areas made similar contributions to the gap (19% each)
- the tool also provides breakdowns for a more detailed set of causes of death. This shows that, within the 3 broad cause groups above, heart disease, lung cancer, and chronic lower respiratory disease were the key contributors to the life expectancy gap for both males and females
- the tool also provides this data at region and upper tier local authority level. In many areas, higher mortality from COVID-19, circulatory disease, cancer, and respiratory disease are key contributors to the life expectancy gap. However, there are variations at local level, and some areas where other causes of death make large contributions to the gap
- for example, in London, for both males and females, around a quarter of the gap between the most and least deprived quintiles was due to COVID-19. This compares with COVID-19 contributing to only 6% of the gap in the South West region. In the North East region, deaths from external causes (which include injury, poisoning and suicide) contributed to 17% of the gap for males, a notably larger percentage than in any other region (see figures 1 and 2)
- the breakdown of the gap by age group shows that for males, 58% of the life expectancy gap in England was due to higher mortality rates amongst those aged over 60 in the most deprived fifth of areas compared with the least deprived fifth, while for females this figure was 68%. As with the breakdowns by cause of death, there are variations at local level
Figure 1: breakdown of the life expectancy gap between the most and least deprived fifth of areas within England, and within each region, 2020 to 2021, males (provisional)
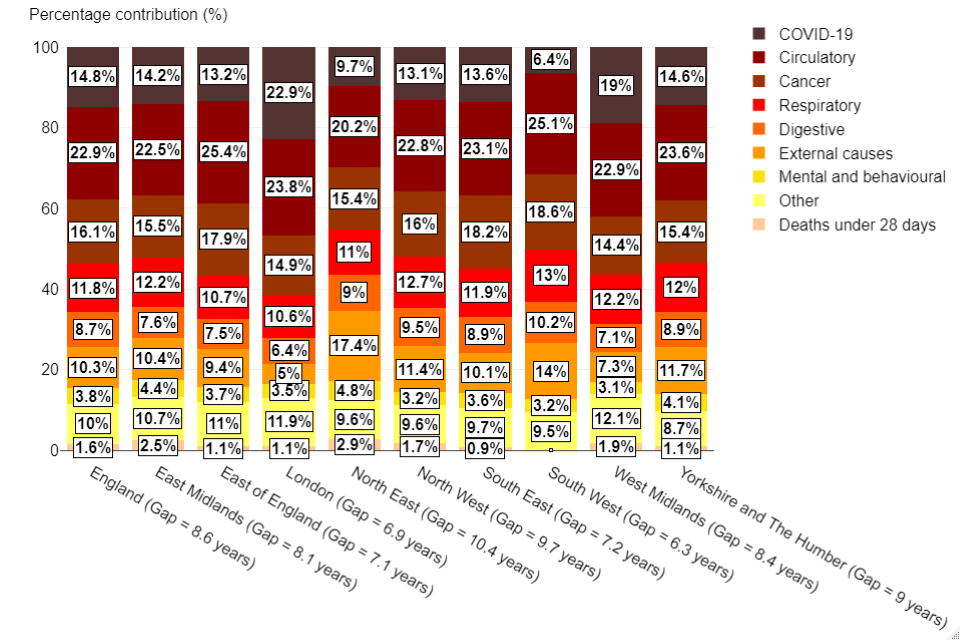
Source: Segment Tool data
Figure 2: breakdown of the life expectancy gap between the most and least deprived fifth of areas within England, and within each region, 2020 to 2021, females (provisional)

Source: Segment Tool data
Background
The Segment Tool provides information on the causes of death and age groups that are driving inequalities in life expectancy at local area level. Targeting the causes of death and age groups which contribute most to the life expectancy gap should have the biggest impact on reducing inequalities.
The Segment Tool was first published in January 2014, and last updated in January 2020. The following changes have been made to the Segment Tool since the previous update:
- provisional data was added for 2020 to 2021 (2 years aggregated)
- the user interface of the tool has been redesigned to make data more easily accessible and the charts more interactive
- COVID-19 has been added to the cause breakdowns
Data for 2015 to 2017 has been removed from the tool as it is not comparable with the latest data, but is available on request.
Provisional data for 2020 to 2021 has been included in this version of the tool to allow users to view the breakdown of inequality in life expectancy during the COVID-19 pandemic.
This data is based on provisional mortality data for 2021, and 2020 population estimates. The tool will be updated once final data becomes available.
Data for lower tier local authorities has not been included as the breakdowns based on 2 years of data are not robust due to small numbers.
Data for NHS geographies has not been provided in this update but it is anticipated that, where possible, these will be added in a future update.
View the Segment Tool.
Responsible statistician, product lead: Charlotte Fellows
For queries relating to this document, please contact: eands-enquiries@phe.gov.uk.
-
The absolute gap between the most and least deprived quintile used in the Segment Tool differs from the inequality measure presented in Public Health Outcomes Framework, which is based on 3 years aggregated data and uses the slope index of inequality measure which divides the population into 10 groups based on deprivation. ↩