Section 2: further statistics
Published 23 September 2020

© Crown copyright 2020
This publication is licensed under the terms of the Open Government Licence v3.0 except where otherwise stated. To view this licence, visit nationalarchives.gov.uk/doc/open-government-licence/version/3 or write to the Information Policy Team, The National Archives, Kew, London TW9 4DU, or email: psi@nationalarchives.gov.uk.
Where we have identified any third party copyright information you will need to obtain permission from the copyright holders concerned.
This publication is available at https://www.gov.uk/government/statistics/scottish-income-tax-outturn-statistics-2018-to-2019/section-2-further-statistics
Background information
What do these statistics tell me?
In addition to showing the Scottish Income Tax (SIT) outturn by component this publication also shows:
- how many Scottish taxpayers are liable at each rate of tax
- the SIT outturn amount at each rate of tax, and
- an estimate for how much SIT is collected via Pay As You Earn (PAYE) and how much via payments made in Self Assessment
Additionally, these tables also provide equivalent information for Rest of UK (rUK) taxpayers, on the same basis, so that comparisons can be made.
Tables 1 to 3 relate to the SIT outturn. The outturn is the definitive measure of SIT which is published in HMRC’s Annual Report and Accounts.
Table 4 shows information about PAYE receipts for Scottish taxpayers and rUK taxpayers which is taken from HMRC’s Real Time Information system (RTI). Table 4 is not calculated on the same basis as the SIT outturn and is not directly comparable with the information in Tables 1 to 3. However, this information is useful to compare how some components of Income Tax have changed for both Scottish and rUK taxpayers, since a complete year of RTI data becomes available 12 months before the SIT outturn is compiled.
What does it mean that these are Experimental Statistics?
Experimental Statistics are statistics that are within their development phase and are published to involve potential users at an early stage in building a high-quality set of statistics that meet user needs. On the completion of this development phase HMRC will consider applying to the Office for Statistics Regulation to have these statistics assessed for designation as National Statistics.
The Experimental Statistics label highlights to users that HM Revenue and Customs (HMRC) are still working on further developing the style and content for the tables and commentary in this publication. We hope that it also encourages users to provide us with their thoughts and suggestions of how useful the statistics are and what can be done to improve them. Users can send us their thoughts and suggestions via the email address on the cover of this release.
It should be emphasised that the label of Experimental Statistics does not mean that the statistics are of low quality, but it does signify that the statistics are novel and what statistics are reported and how is still being developed. There is a detailed methodology guide in Section 4 of this publication. Users should refer to this methodological information when judging whether their particular use of the statistics is appropriate.
1. SIT outturn and rUK comparison
Definitions of “non-saving non-dividend” and “rUK”
The statistics in Tables 1 to 3 provide information about Income Tax due on non-saving non-dividend (NSND) income. NSND income includes earnings from employment, pensions, profits from self-employed sources and property.
Only Income Tax due on NSND income is devolved to Scotland, and therefore these tables provide a comparison of how NSND Income Tax for Scottish taxpayers compares to that of taxpayers in rUK. For tax years 2016 to 2017, 2017 to 2018 and 2018 to 2019, rUK is defined as UK taxpayers that are not Scottish taxpayers. For the tax year 2019 to 2020, NSND income tax becomes devolved for Wales, under the Welsh Rates of Income Tax (WRIT). Table 4 presents RTI data for the tax year 2019 to 2020, and ‘All UK’ refers to RTI tax due in England, Scotland, Wales and Northern Ireland, however it should be noted that tax due on NSND income is devolved for Wales, from this point.
Tax on NSND income in these tables is measured as the Income Tax liability expected to be collected by HMRC. There is also an adjustment to reflect reliefs which are not allocated to individual taxpayer accounts.
Taxpayers in these tables are defined as individuals who have some Income Tax liability on NSND income after reliefs have been applied to reduce Income Tax. In Table 2 taxpayers have been assigned to a tax rate based solely on their NSND Income Tax and it is possible that they have paid tax at a higher rate on their savings/dividend income. Details of the SIT system are set out in Section 4.
Established liabilities vs. where tax is paid
Employers (and pension providers) normally must operate PAYE as part of their payroll. PAYE is HMRC’s system to collect Income Tax and National Insurance (NI) from employments and is largely paid in the same year as the taxable activity. When an employer pays their employees through payroll, they also need to make tax and NI deductions for PAYE. Employers are then obliged to report the amount of these payments and deductions to HMRC as well as paying the tax and NI deducted to HMRC.
An individual is required to file a Self Assessment (SA) return if they meet certain criteria. This is required even for individuals who are also present in PAYE if a requirement for filing in SA is met. SA returns are generally submitted in the year after the taxable activity has taken place.
For the outturn calculation, an individual who files in SA will have all their Income Tax liability established in SA when they submit their return, even if they have had some tax deducted through PAYE. An individual who is not required to file in SA will have their liability established in PAYE when their information is reconciled each year under the National Insurance and PAYE Service (NPS).
Table 3 shows whether established NSND liabilities are paid through PAYE or SA. This split in Table 3 is different to how established liabilities are split between PAYE and SA in Table 1. For instance, individuals who file an SA return, with self-employment income, and additionally have tax deducted through a PAYE scheme (e.g. for an employment), Table 3 will reflect those corresponding liabilities as paid separately through SA and PAYE, respectively.
Figure A below aims to explain in which system an individual has their liabilities established if they have an employment or pension record in PAYE and/or are expected to file an SA return. It also shows in which system each type of individual could make payments either through tax deducted as part of PAYE or making payments through SA. The colouring aims to reflect how income reportable in PAYE (blue) and income reportable in SA (orange) is treated at each level.
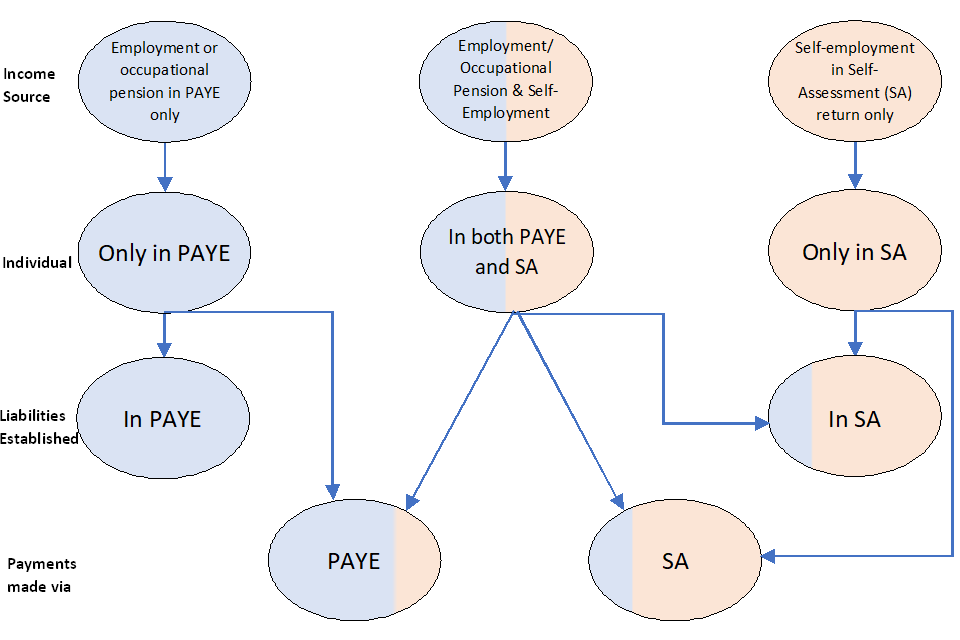
Figure A: How Income Tax liability is established and paid (see "Explanation of levels" below).
As shown in the Figure A above there are 2 ways of splitting total income tax liabilities between PAYE and SA:
- by payments - through which system tax is initially paid
- by liability established – in which system do income tax liabilities ultimately end up being established
Explanation of levels in Figure A
Income Source – The starting point is to consider the different income sources.
- Income from employments and occupational pensions are reportable through PAYE.
- Income from self-employment, partnerships and some other income (or income above certain levels) is reportable in SA.
Individual – This level shows that an individual may have income which is:
- Only reportable in PAYE,
- Only reportable in SA or
- Reportable in both PAYE and SA.
Liabilities established – Liabilities are established when a reconciliation is conducted in the PAYE system or a tax calculation is conducted in SA.
- An individual who only has income reportable in PAYE will be reconciled in the PAYE system.
- An individual who has any income reportable in SA (even if they also have income reportable in PAYE) is required to submit an SA return and will have all of their liability established via the tax calculation in SA.
Payments made – This level shows where the payments are made for each income source.
- An individual who has income reportable in PAYE will have tax deducted through PAYE, if their income is large enough.
- An individual who has income reportable in both PAYE and SA may pay some tax through PAYE as well as other payments via SA.
- An individual who only has income reportable in SA should pay all their tax via SA.
Table 3 is by payments - showing whether established NSND liabilities are paid through PAYE or SA. This split is different to Table 1 which is split by liability established (see above – ‘Explanation of levels in Figure 1’) – showing how established liabilities are split between PAYE and SA. As individuals who file in SA may have tax deducted through PAYE the split between PAYE and SA is different comparing Tables 1 and 3.
Table 4, which shows RTI tax by month, is more comparable to Table 3 and the ‘Collected through PAYE’ figures. However, there are still differences between these including that more than just NSND tax will be included in the RTI tax figures. For example, the Higher Income Child Benefit Charge (HICBC), any savings/dividends that are coded out in PAYE and underpayments from previous years.
1.1 Outturn components and established liability source
Summary of Table 1
- more NSND liability is established in PAYE than in SA for Scottish taxpayers
- more NSND liability is established in SA than in PAYE for rUK taxpayers
- PAYE established liability grew by around 4.7% for Scottish taxpayers and by around 3.6% for rUK taxpayers between 2017 to 2018 and 2018 to 2019
- SA established liability grew by just under 3% points more for Scottish taxpayers (9.7%) compared to rUK taxpayers (6.8%) between 2017 to 2018 and 2018 to 2019
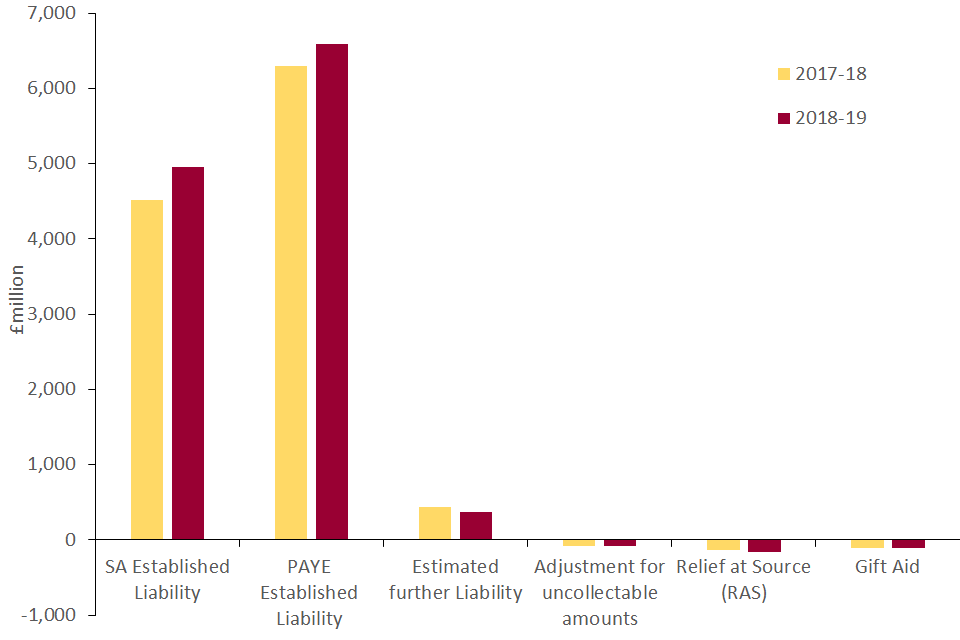
Figure 1a: SIT outturn 2017 to 2018 and 2018 to 2019 (the information used to create this graph is repeated in Table 1a below).
Table 1a: SIT Outturns for NSND income 2017 to 2018 and 2018 to 2019
| 2017-18 Scottish Income Tax | 2018-19 Scottish Income Tax | |
|---|---|---|
| Self Assessment Established Liability | £4,514m | £4,954m |
| PAYE Established Liability | £6,293m | £6,587m |
| Estimated further Liability | £431m | £366m |
| Adjustment for uncollectable amounts | £-79m | £-89m |
| Relief at Source (RAS) | £-141m | £-156m |
| Gift Aid | £-103m | £-105m |
| Total | £10,916m | £11,556m |
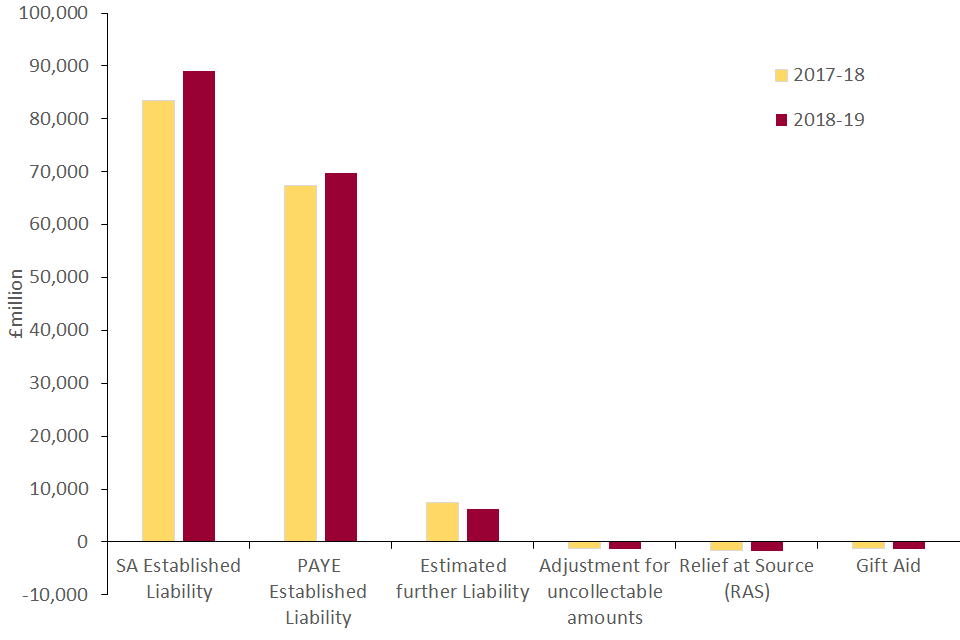
Figure 1b: rUK outturn 2017 to 2018 and 2018 to 2019 (the information used to create this graph is repeated in Table 1b below).
Table 1b: rUK Outturns for NSND income 2017 to 2018 and 2018 to 2019
| 2017-18 rUK NSND Income Tax | 2018-19 rUK NSND Income Tax | |
|---|---|---|
| Self Assessment Established Liability | £83,403m | £89,095m |
| PAYE Established Liability | £67,330m | £69,774m |
| Estimated further Liability | £7,443m | £6,237m |
| Adjustment for uncollectable amounts | £-1,198m | £-1,321m |
| Relief at Source (RAS) | £-1,587m | £-1,790m |
| Gift Aid | £-1,192m | £-1,245m |
| Total | £154,199m | £160,750m |
1.2 Tax Liabilities by tax band
Summary of Table 2
- Table 2 provides breakdowns of NSND Income Tax liabilities by tax band (rows) and taxpayer marginal rate (columns). It highlights that Higher and Additional rate taxpayers are liable for a considerable amount of tax at the Basic and Higher rates of tax
- the proportion of NSND tax at the Additional rate for rUK taxpayers is almost double the proportion for Scottish taxpayers
- between 2017 to 2018 and 2018 to 2019 the proportion of Scottish Income Tax for both the Higher and Additional tax rates, increased
- between 2017 to 2018 and 2018 to 2019 the proportion of NSND tax for rUK taxpayers at any of the tax rates changed by at most 0.6% points

Figure 2a: Share of total NSND Income Tax liable at each tax rate (the information used to create this graph is repeated in Table 2a below).
Table 2a: Share of total NSND Income Tax liable at each tax rate
| Marginal Rate | Scottish taxpayers 2017-18 | rUK taxpayers 2017-18 | Scottish taxpayers 2018-19 | rUK taxpayers 2018-19 |
|---|---|---|---|---|
| Starter rate | N/A | N/A | 7.7% | N/A |
| Basic rate | 61.6% | 50.7% | 28.3% | 50.3% |
| Intermediate rate | N/A | N/A | 24.2% | N/A |
| Higher rate | 28.7% | 29.8% | 29.5% | 29.6% |
| Additional/Top rate | 9.6% | 19.5% | 10.4% | 20.1% |
1.3 Taxpayers by tax rate on NSND income
Further summary of Table 2
- between 2017 to 2018 and 2018 to 2019, the proportion of Additional rate taxpayers remained the same, however there was a growth in the number of higher rate taxpayers by 0.4% points
- in 2018 to 2019, 12.7% of the Scottish taxpayer population are Higher rate taxpayers, compared to 12.3% for rUK
- the proportion of Basic, Higher and Additional rate taxpayers for rUK has remained static between 2017 to 2018 and 2018 to 2019

Figure 2b: Share of taxpayers by tax rate on NSND income (the information used to create this graph is repeated in Table 2b below).
Table 2b: Share of taxpayers by tax rate on NSND income
| Marginal Rate | Scottish taxpayers 2017-18 | rUK taxpayers 2017-18 | Scottish taxpayers 2018-19 | rUK taxpayers 2018-19 |
|---|---|---|---|---|
| Starter Rate | N/A | N/A | 10.2% | N/A |
| Basic Rate | 87.2% | 86.6% | 41.3% | 86.6% |
| Intermediate Rate | N/A | N/A | 35.2% | N/A |
| Higher Rate | 12.3% | 12.3% | 12.7% | 12.2% |
| Additional/Top Rate | 0.6% | 1.1% | 0.6% | 1.2% |
1.4 Tax liability share for taxpayers at each rate
Further summary of Table 2
- higher rate taxpayers and Additional rate taxpayers are contributing a greater share of the Scottish NSND tax in 2018 to 2019 than was the case in 2017 to 2018
- the share of the total NSND tax at the Additional rate grew for both rUK and Scotland, but 0.2% points higher in Scotland
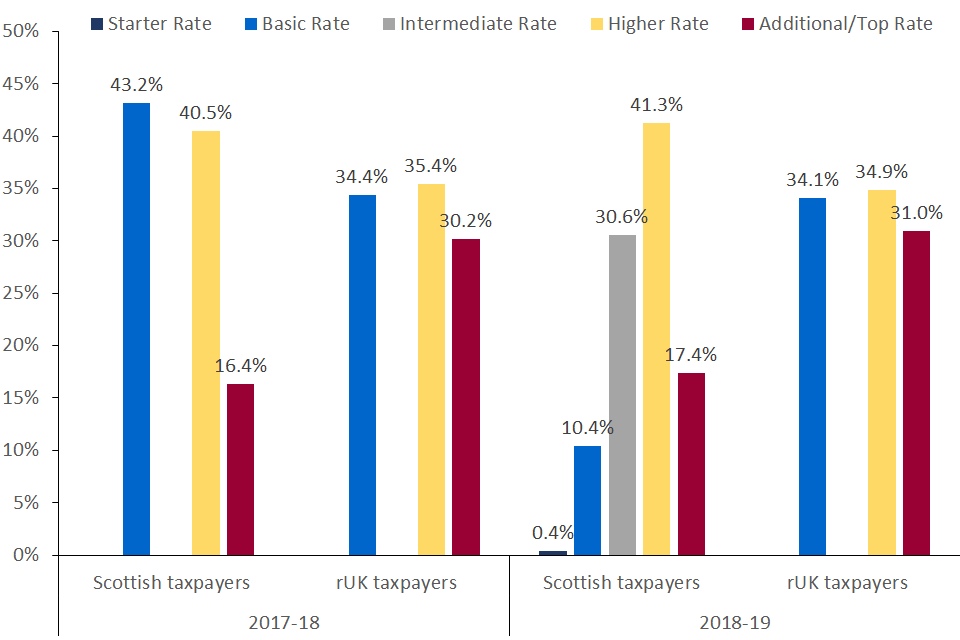
Figure 2c: NSND tax share by rate (the information used to create this graph is repeated in Table 2c below).
Table 2c: NSND tax share by rate
| Marginal Rate | Scottish taxpayers 2017-18 | rUK taxpayers 2017-18 | Scottish taxpayers 2018-19 | rUK taxpayers 2018-19 |
|---|---|---|---|---|
| Starter Rate | N/A | N/A | 0.4% | N/A |
| Basic Rate | 43.2% | 34.4% | 10.4% | 34.1% |
| Intermediate Rate | N/A | N/A | 30.6% | N/A |
| Higher Rate | 40.5% | 35.4% | 41.3% | 34.9% |
| Additional/Top Rate | 16.4% | 30.2% | 17.4% | 31.0% |
2. SIT outturn data and rUK - Experimental Statistics: Tables 1 to 3
Table 1 shows the final outturn for NSND Income Tax for Scottish and rUK taxpayers presented in the same way as they are also published in HMRC’s Annual Report and Accounts publication. The total outturn for Scotland and rUK is used for setting Scotland’s Budget as part of the Block Grant process. For Block Grant purposes these outturn figures are final.
The PAYE and SA established liabilities are based on data from individual taxpayer accounts in either PAYE or SA. The PAYE rUK established liability is estimated by using data from RTI in conjunction with how RTI data relates to outturn for Scottish taxpayers. There is a degree of estimation in the components which are not ‘established liabilities’.
Table 2 provides further detail for the Scottish and rUK outturn figures. It shows how many Scottish and rUK taxpayers there were for 2016 to 2017, 2017 to 2018 and 2018 to 2019. It also shows how many taxpayers there were by highest marginal rate of tax and how much Scottish and rUK NSND Income Tax outturn falls into each tax band.
There is a degree of estimation in assigning the estimated components of the outturn to tax rates. Where this is required the distributions from the PAYE and SA established components are used to apportion the estimated tax to each tax rate.
Table 3 shows an estimate of how much of the Scottish and rUK outturn is collected through PAYE or paid via SA. For individuals in SA any payments made at source are assumed to be prioritised to NSND Income Tax.
It is not possible to allocate the components for ‘uncollectable amounts’, ‘Relief at Source’ (RAS) and ‘Gift Aid’ to a payment source so these have been shown separately.
The percentages in Table 3, that show how much of the outturn is collected via PAYE or SA, are calculated excluding the amounts for ‘uncollectable amounts’, ‘RAS’ and ‘Gift Aid’.
3. Indicative In-Year Scottish Income Tax taken from HMRC’s RTI system: Table 4
HMRC provides in year monitoring data for SIT from the RTI data to the, the Scottish Fiscal Commission (SFC) and the Office for Budget Responsibility (OBR) each month.
Table 4 shows the information HMRC shares as a monthly time series for how much tax is collected through employers (as reported in RTI) for the UK and how much of that is from Scottish taxpayers.
The Income Tax measure in Table 4 is not the same as that presented in Tables 1 to 3 which provide a breakdown of the outturn.
The tax reported in RTI will include amounts for things other than NSND tax, including any tax code adjustments for savings income or the HICBC and non-taxable employee expenses paid through payroll with tax deducted.
These figures are a snap shot, based on the information held at the time they are compiled each month (i.e. taxpayer status was assessed at that point in time, and tax figures are prior to reconciliation at year end).
Scottish taxpayers are identified using the Scottish indicator from NPS (see section 4.1 for more details of how Scottish taxpayers are defined).
The RTI figures are provisional and subject to change specifically as taxpayer’s Scottish status changes through the year as residential address changes occur.
These monthly figures will generally not be updated after the end of the tax year.
Summary of Table 4
The following section details tax information reported through the RTI system by employers when they make payments to their employees. The data used in this section is a different source from that used in the outturn and presented in Table 1 to 3 above. The outturn data only reflects Income Tax on NSND income.
The tax reported in RTI is the amount that the employer has retained from their employees pay and will be passed to HMRC. This is determined by the individuals’ tax code which the employer applies to each employee. The tax code may include adjustments for other incomes (including savings/dividend income as well as NSND income), reliefs, underpayments from previous years and non-Income Tax charges such as HICBC.
Therefore, Table 4 is not directly comparable to Table 1 to 3. However, it can be used alongside Table 3 to give an indication of how the outturn is expected to grow between years as the RTI data becomes available around 12 months before the outturn figures are finalised.
Table 3a: Income Tax reported as withheld from RTI
| Type | 2016-17 | 2017-18 | 2018-19 | 2019-20 |
|---|---|---|---|---|
| Total UK | £144,088m | £148,472m | £156,105m | £158,384m |
| Rest of UK | £134,102m | £138,251m | £.145,277 | £147,266m |
| Scottish | £9,986m | £10,221m | £10,828m | £11,118m |
| Scottish share of RTI total tax | 6.93% | 6.88% | 6.94% | 7.02% |
Table 3b: Income Tax reported as withheld from RTI - year on year change
| Type | 2016-2017 to 2017-18 | 2017-18 to 2018-19 | 2018-19 to 2019-20 |
|---|---|---|---|
| Rest of UK taxpayers | +3.1% | +5.1% | +1.4% |
| Scottish taxpayers | +2.4% | +5.9% | +2.7% |
The monthly time series of tax withheld in RTI is relatively similar for Scottish and rUK taxpayers. There is a clear spike in tax in March each year and this reflects when bonuses are generally paid, at the end of the tax year.
The Scottish share of tax withheld in March, when tax withheld peaks in the monthly time series, is lower than all other months in the year. This likely reflects bonus payments forming a smaller proportion of remuneration for Scottish employees when compared to rUK.
There is also a smaller spike in December which is likely to reflect an increase in employment activity around the Christmas holiday period.
In 2018 to 2019 SIT was changed to introduce 2 new tax bands, the Starter rate (19%) and the Intermediate rate (21%) either side of the Basic rate (20%). The Higher and Additional rates of tax were also increased by 1% for Scottish taxpayers increasing from 40% and 45% to 41% and 46%, respectively.
For 2019 to 2020 the Personal Allowance for Scotland and rUK was £12,500. The Higher rate threshold (HRT) for rUK has risen to £50,000. For Scotland the Basic rate threshold (BRT) was set at £14,549, the Intermediate rate threshold (IRT) was set at £24,944 and the HRT was frozen at £43,430. These changes are likely to have contributed to the faster growth of NSND Income Tax for Scottish taxpayers between 2017-18 and 2018-19 compared to rUK.
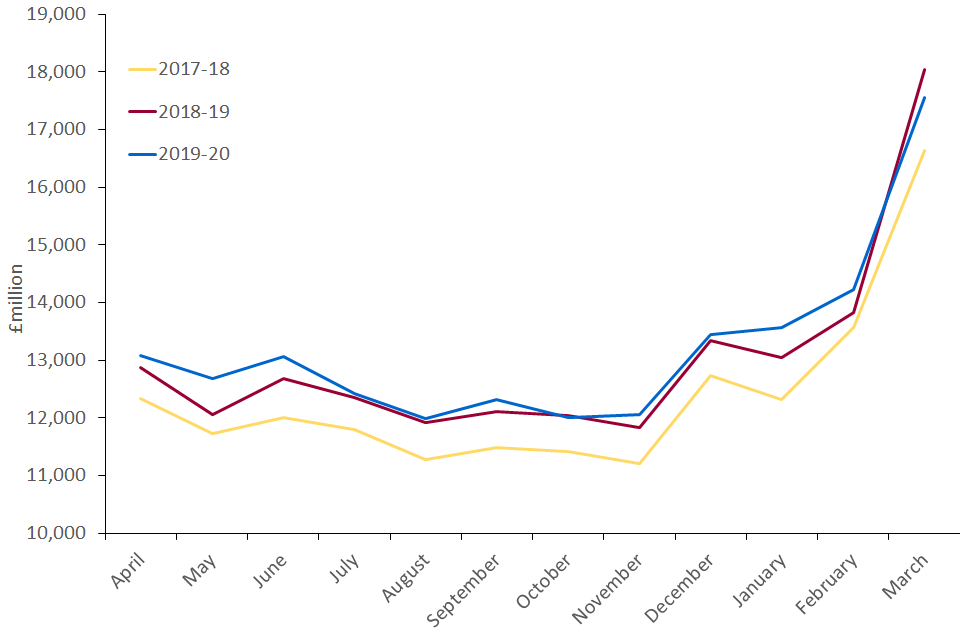
Figure 4a: RTI Income Tax reported as withheld for UK taxpayers (the information used to create this graph is repeated in Table 4a below).
Table 4a: RTI Income Tax reported as withheld for UK taxpayers
| Month | 2017-18 | 2018-19 | 2019-20 |
|---|---|---|---|
| April | £12,335m | £12,867m | £13,077m |
| May | £11,727m | £12,061m | £12,687m |
| June | £12,003m | £12,68m4 | £13,056m |
| July | £11,788m | £12,353m | £12,425m |
| August | £11,267m | £11,923m | £11,995m |
| September | £11,482m | £12,104m | £12,321m |
| October | £11,419m | £12,039m | £12,003m |
| November | £11,203m | £11,837m | £12,052m |
| December | £12,733m | £13,331m | £13,443m |
| January | £12,315m | £13,038m | £13,558m |
| February | £13,560m | £13,823m | £14,221m |
| March | £16,642m | £18,044m | £17,545m |
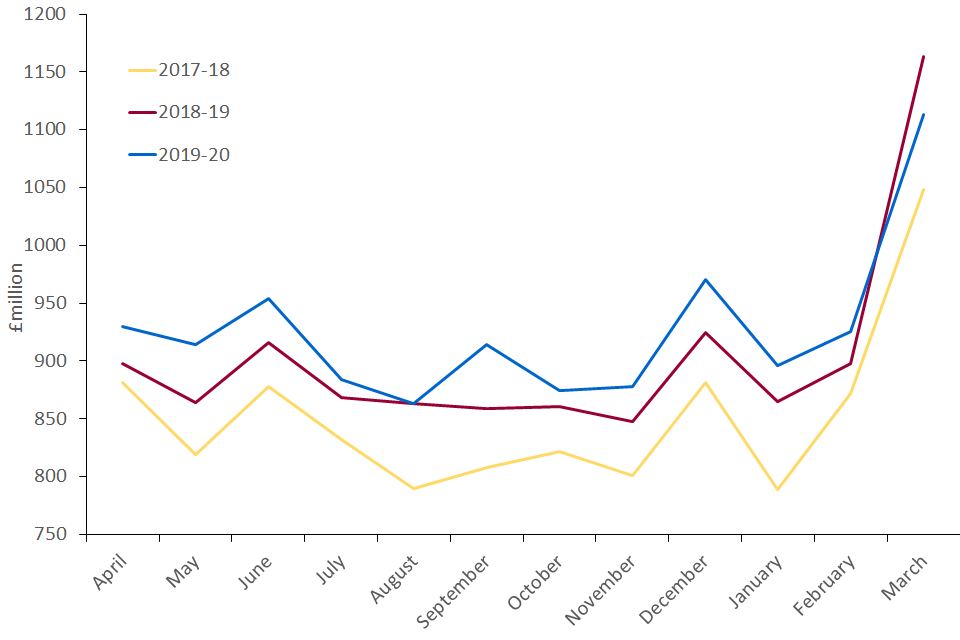
Figure 4b: RTI Income Tax reported as withheld for Scottish taxpayers (the information used to create this graph is repeated in Table 4b below).
Table 4b: RTI Income Tax reported as withheld for Scottish taxpayers
| Month | 2017-18 | 2018-19 | 2019-20 |
|---|---|---|---|
| April | £881m | £898m | £930m |
| May | £819m | £864m | £915m |
| June | £878m | £916m | £954m |
| July | £832m | £868m | £884m |
| August | £790m | £863m | £863m |
| September | £808m | £859m | £914m |
| October | £822m | £861m | £874m |
| November | £801m | £848m | £878m |
| December | £881m | £925m | £970m |
| January | £789m | £865m | £896m |
| February | £872m | £898m | £925m |
| March | £1,048m | £1,163m | £1,113m |
Figure 4c: RTI Income Tax reported as withheld - Scottish share of total (the information used to create this graph is repeated in Table 4c below).
Table 4c: RTI Income Tax reported as withheld - Scottish share of total
| Month | 2017-18 | 2018-19 | 2019-20 |
|---|---|---|---|
| April | 7.14% | 6.98% | 7.11% |
| May | 6.99% | 7.16% | 7.21% |
| June | 7.32% | 7.22% | 7.31% |
| July | 7.06% | 7.03% | 7.12% |
| August | 7.01% | 7.24% | 7.19% |
| September | 7.04% | 7.10% | 7.42% |
| October | 7.19% | 7.15% | 7.28% |
| November | 7.15% | 7.16% | 7.29% |
| December | 6.92% | 6.94% | 7.22% |
| January | 6.41% | 6.64% | 6.61% |
| February | 6.43% | 6.50% | 6.51% |
| March | 6.30% | 6.44% | 6.35% |