Road goods vehicles travelling to Europe: October 2020 to September 2021
Published 18 November 2021

© Crown copyright 2021
This publication is licensed under the terms of the Open Government Licence v3.0 except where otherwise stated. To view this licence, visit nationalarchives.gov.uk/doc/open-government-licence/version/3 or write to the Information Policy Team, The National Archives, Kew, London TW9 4DU, or email: psi@nationalarchives.gov.uk.
Where we have identified any third party copyright information you will need to obtain permission from the copyright holders concerned.
This publication is available at https://www.gov.uk/government/statistics/road-goods-vehicles-travelling-to-europe-october-2020-to-september-2021/road-goods-vehicles-travelling-to-europe-october-2020-to-september-2021
We are providing this compact HTML format for our roll-on roll-off international freight statistics releases, and we would like to hear your comments. If you have any feedback on our use of this format, or any questions about this release, see contact details.
Main points
When comparing the 12-month period ending September 2021 to the previous 12-month period ending September 2020, we see:
- the total number of trips made by road goods vehicles travelling from Great Britain to Europe increased by 1% to 3.14 million
- the number of trips made by powered vehicles decreased by 4% from 2.11 million to 2.04 million
- the number of trips made by unaccompanied trailers increased by 10% from 1.01 million to 1.11 million
When comparing the 12-month period ending September 2021 to the 12-month period ending September 2019, we see:
- the total number of trips made by road goods vehicles travelling from Great Britain to Europe decreased by 8% to 3.14 million
- the number of trips made by powered vehicles decreased by 13% from 2.34 million to 2.04 million
- the number of trips made by unaccompanied trailers increased by 3% from 1.07 million to 1.11 million
Of the 2.04 million powered vehicles that travelled from Great Britain to Europe, in the 12-month period ending September 2021 compared to the 12-month ending September 2020, we see:
- the number of trips made by UK-registered vehicles decreased by 13% from 0.29 to 0.25 million
- the number of trips made by foreign-registered vehicles decreased by 2% from 1.78 to 1.75 million
Caution should be taken when comparing these data to previous time periods because previously announced timings of the UK leaving the EU and subsequent transition period, along with the impact of the coronavirus pandemic, have caused higher levels of volatility in freight statistics over the past 2 years.
The graph below shows the total number of trips made by road goods vehicles travelling from Great Britain to Europe in each quarter since 2015.
The graph also shows the average number of trips made in the five-year period before the COVID-19 pandemic, calculated using data from 2015 to 2019, as well as the expected variance from this average. The number of trips falls within the expected variance (± 1 standard deviation) for most quarters however, there has been some wider variance (± 2 standard deviations of the average) in recent quarters. In the 12-month period ending September 2021, the level of activity of road goods vehicles travelling from Great Britain to Europe has fluctuated, coinciding with the implementation and subsequent easing of COVID-19 (coronavirus) restrictions, as well as the potential impact of the end of the EU exit transition period.
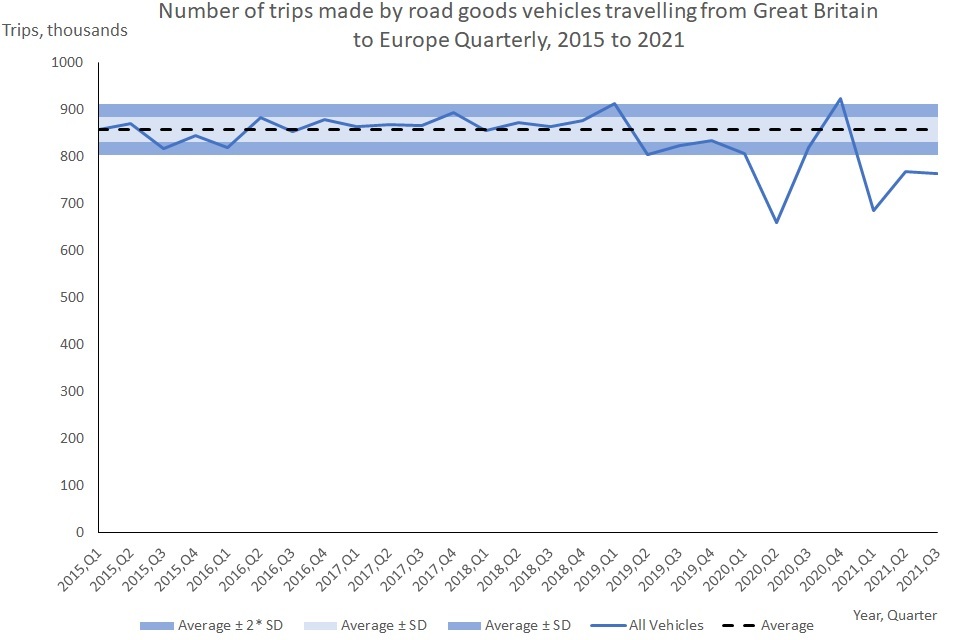
This chart shows the number of road goods vehicles travelling to Europe quarterly between 2015 and 2021.
Further information about these statistics is available, including:
- data tables for roll-on roll-off international freight statistics
- notes and definitions for roll-on roll-off international freight statistics
Instructions for printing and saving
Depending on which browser you use and the type of device you use (such as a mobile or laptop) these instructions may vary.
How to search
Select Ctrl and F on a Windows laptop or Command and F on a Mac
This will open a search box in the top right-hand corner of the page. Type the word you are looking for in the search bar and press enter.
Your browser will highlight the word, usually in yellow, wherever it appears on the page. Press enter to move to the next place it appears.
Tablets and mobile devices normally have the option to “find in text” and “print or save” in their sharing or quick options menu of their browser, but this will vary by device model.
Contact details
Roll-on roll-off international freight statistics
Email roadfreight.stats@dft.gov.uk
Media enquiries 0300 7777 878