Road goods vehicles travelling to Europe: October 2019 to September 2020
Published 12 November 2020

© Crown copyright 2020
This publication is licensed under the terms of the Open Government Licence v3.0 except where otherwise stated. To view this licence, visit nationalarchives.gov.uk/doc/open-government-licence/version/3 or write to the Information Policy Team, The National Archives, Kew, London TW9 4DU, or email: psi@nationalarchives.gov.uk.
Where we have identified any third party copyright information you will need to obtain permission from the copyright holders concerned.
This publication is available at https://www.gov.uk/government/statistics/road-goods-vehicles-travelling-to-europe-october-2019-to-september-2020/road-goods-vehicles-travelling-to-europe-october-2019-to-september-2020
Statistics on the number of trips made by road goods vehicles which travel from Great Britain to Europe between October 2019 and September 2020.
When comparing the 12-month period ending September 2020 to the previous 12 month period:
- the total number of trips made by road goods vehicles travelling from Great Britain to Europe decreased by 9% to 3.1 million
- the number of trips made by powered vehicles decreased by 10% to 2.1 million
- the number of trips made by unaccompanied trailers decreased by 6% to 1 million
Of the 2.1 million powered vehicles that travelled from Great Britain to Europe:
- the number of trips made by UK-registered vehicles decreased by 17% to 0.3 million
- the number of trips made by foreign-registered vehicles decreased by 9% to 1.8 million
These statistics cover the period following the government’s announcement of measures to limit the impact and transmission of the coronavirus (COVID-19) pandemic. In early March 2020, the UK government set out 4 phases in its response to the coronavirus pandemic. The evolving situation around the world may have also impacted road goods vehicles trips prior to this stage. Coronavirus has had a wide impact on UK society and economic activity since March 2020.
As these data are affected by the coronavirus (COVID-19) pandemic in the UK, caution should be taken when interpreting these data and comparing them with previous time periods. Intelligence from industry reports suggests that a few roll-on roll-off ferry routes ceased operating from April onwards, whilst others only carried unaccompanied trailers. A fall in activity was seen across most of the routes surveyed during the quarter 2 period (April to June), with some recovery taking place from July onwards as lockdown restrictions were relaxed.
The graph below shows the total number of trips made by road goods vehicles travelling from Great Britain to Europe each quarter since 2015, giving the number of trips in during the coronavirus pandemic period against the longer-term trend.
The graph shows the average number of trips over 2015 to 2019 as well as the expected variance from this average. The number of trips fall within the expected variance (± 1 standard deviation) for most quarters. There has been some wider variance (± 2 standard deviations of the average) in recent quarters, potentially impacted by logistics planning in the lead up to EU exit dates. 2020 quarter 2 (April to June) fell far below this expected variance, the number of trips since July has shown some return to expected variance.
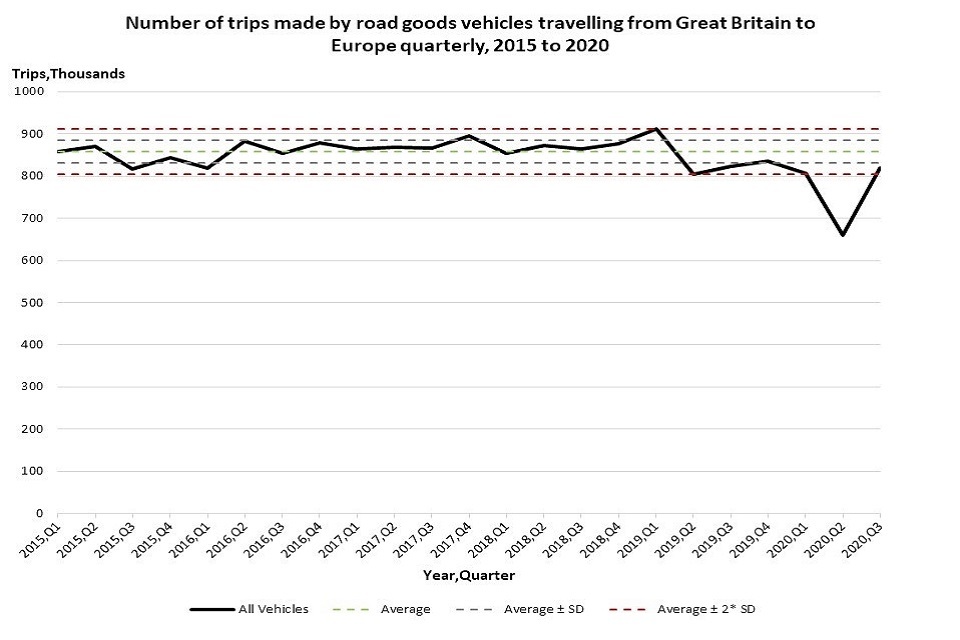
This chart shows the number of road goods vehicles travelling to Europe quarterly between 2015 and 2020.
Further information about these statistics is available, including:
- data tables for roll-on roll-off international freight statistics;
- notes and definitions for roll-on roll-off international freight statistics;
We are trialling this compact HTML format for our quarterly roll-on roll-off international freight statistics releases, and we would like to hear your comments. If you have any feedback on our use of this format, please email roro.stats@dft.gov.uk.