Restart Scheme statistics to April 2023
Published 8 June 2023

© Crown copyright 2023
This publication is licensed under the terms of the Open Government Licence v3.0 except where otherwise stated. To view this licence, visit nationalarchives.gov.uk/doc/open-government-licence/version/3 or write to the Information Policy Team, The National Archives, Kew, London TW9 4DU, or email: psi@nationalarchives.gov.uk.
Where we have identified any third party copyright information you will need to obtain permission from the copyright holders concerned.
This publication is available at https://www.gov.uk/government/statistics/restart-scheme-statistics-to-april-2023/restart-scheme-statistics-to-april-2023
The latest release of these statistics can be found in the Restart Scheme statistics collection.
1. Introduction
Coronavirus (COVID-19), and the public health measures introduced in response to it had unprecedented economic impacts in the UK and globally. The impact on out of work benefit claims was immediate, with over 1 million declarations to Universal Credit (UC) alone in the first few months of the pandemic.
At the Spending Review on 25th November 2020, HM Treasury confirmed a ‘new 3-year long £2.9 billion Restart programme’ as part of the ‘Plan for Jobs’ to provide intensive and tailored support to over 1 million unemployed people to help them into sustained work.
The Department for Work and Pensions (DWP) later reassessed the demand for the programme; it is now likely to support around 0.7 million individuals over its life, at a projected cost of around £1.7 billion. Details of this reassessment can be found in:
-
the July 2022 Accounting Officer Advice
-
the December 2022 National Audit Office report on the Restart Scheme
The initial focus for referrals at the programme’s launch in June 2021 was those who had been on UC in the Intensive Work Search Regime (IWSR) continuously for between 12 and 18 months, and who had moved into this regime after March 2020.
From January 2022, those in receipt of UC IWSR for at least 9 months were considered eligible; was expanded later in 2022 to include all claimants under UC IWSR with UC claims of at least 9 months, as well as those claimants in receipt of Income Based Jobseeker’s Allowance (JSA IB).
People are referred to the scheme by Work Coaches in Jobcentre Plus offices to external organisations (Providers) that work alongside Jobcentre Plus to give personalised support to participants for up to 12 months to help them to find, and remain in, employment.
Providers are paid a service fee to deliver this support. In addition, they receive a payment for each participant that achieves a job outcome. This is when, since starting on the scheme, a participant reaches either:
-
a specified cumulative level of earnings called the earnings threshold
-
6 months of gainful self-employment
Providers are eligible for an outcome payment for each participant that achieves a job outcome within 18 months of starting on the scheme
Restart has run alongside 2 other ‘Plan for Jobs’ schemes that were announced in July 2020:
-
Kickstart aimed at young people with referrals between October 2020 and March 2022
-
Job Entry Targeted Support aimed at shorter duration unemployed with referrals between October 2020 and September 2022
It also ran alongside employment support schemes that had been operating before the pandemic including the Work and Health Programme and the Intensive Personalised Employment Support scheme.
Since Restart’s launch it has operated in a changing labour market which can be broadly characterised by a decreasing unemployment rate that has more recently flattened, rising employment rate (but that is below pre-pandemic levels) and high levels of vacancies. This wider context should be considered throughout this publication.
2. Main Stories
The statistics show that by the end of April 2023 (numbers rounded to the nearest 1000):
-
530,000 individuals had been referred to the programme since its launch, with 450,000 of these having started on the programme
-
150,000 of these participants have achieved first earnings from employment since starting on the scheme. Note that many participants have received less than 12 months of support so far
-
84,000 participants have subsequently achieved a job outcome. This is against a tender performance level (TPL) contractual expectation of 84,000 job outcomes by this point in the programme, representing 100% of the TPL
-
the minimum performance level for the scheme (MPL) at this point is 62,000 job outcomes. The current number of job outcomes therefore represents 136% of the MPL
-
230,000 people have had the opportunity of 12 months of support on the programme by April 2023. Of these people, 42% have achieved first earnings from employment so far. 25% have achieved a job outcome so far, against an MPL expectation of 15% and a TPL expectation of 20%
-
of the 450,000 starts on the scheme, 57% were recorded as male, and 43% recorded as female. 10% are aged between 18 and 24 years old, with 63% aged between 25 and 49 years old and 27% aged 50 years or over
3. What you need to know
Definitions
The following definitions are used in these statistics.
Participants
The Restart Scheme launched in June 2021, with the first cohort of starts from July 2021, in England and Wales and aims to provide tailored and intensive support to participants to achieve sustained work. It is currently aimed at those who have claimed UC continuously for at least 9 months and are currently under the IWSR. Participants may also come from those in receipt of JSA IB for at least 9 months.
Providers
The Restart scheme is delivered across England and Wales by 8 providers across 12 areas, known as Contract Package Areas (CPAs). These CPAs represent 12 geographic areas of England and Wales, with Wales as a single area (CPA 6).
Map showing CPAs in England and Wales
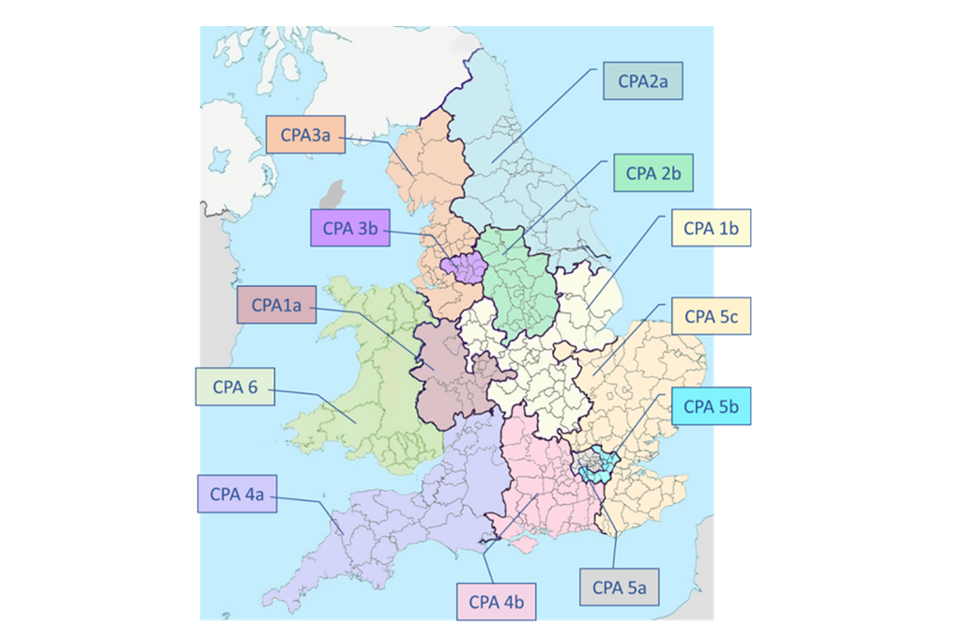
| CPA Number | Area | Provider |
|---|---|---|
| CPA 1a | West Central | Serco Limited |
| CPA 1b | East Central | Jobs22 Limited |
| CPA 2a | North East and Humberside | Reed in Partnership Limited |
| CPA 2b | S&W Yorkshire, Derbyshire & Nottinghamshire | Maximus UK Services Limited |
| CPA 3a | North West | G4S Facilities Management (UK) Limited |
| CPA 3b | Greater Manchester | Ingeus UK Limited |
| CPA 4a | South West | Seetec Pluss Limited |
| CPA 4b | South Central | Fedcap Employment Limited |
| CPA 5a | Central and West London | Ingeus UK Limited |
| CPA 5b | South and West London | Maximus UK Services Limited |
| CPA 5c | Home Counties | Reed in Partnership Limited |
| CPA 6 | Wales | Serco Limited |
Referrals
Work Coaches in Jobcentre Plus offices send details of potential participants to their provider. Before doing so, the Work Coach will consider each individual’s needs and circumstances to understand their suitability and eligibility for the scheme. This part of the participant journey is called a referral. Individuals may be referred to a provider more than once prior to starting on the scheme.
Individuals referred
Since an individual can be referred more than once, individuals referred is the number of unique individual people referred. For this value, only the individual’s first referral is counted.
Starts
A start on the programme is recorded when an individual referred to Restart attends an initial meeting with the provider. There is a period of 40 working days from the point of referral in which the participant’s start on the scheme can be recorded by the provider. In places in this document, we will use the term ‘participant’ interchangeably with ‘start’ to aid readability.
Cohort
A group of participants who start on the Restart Scheme in the same calendar month.
First earnings from employment
Information on participants’ earnings are reported to the DWP by HM Revenue & Customs (HMRC) Real Time Earnings (RTE) data. The point at which a participant first achieves earnings from their first employment whilst on the scheme is known as the first earnings. A participant who achieves first earnings may not necessarily then go on to achieve a job outcome. Statistics on first earnings from employment do not include earnings from self-employment.
Job outcomes
Job outcomes represent sustained employment. A provider is classed as achieving a job outcome when a participant, since starting on the scheme, reaches either:
-
cumulative earnings exceeding the earnings threshold. This is the equivalent of working 16 hours per week for 26 weeks at the National Living Wage
-
a minimum of 6 months of gainful self-employment
Employed job outcomes are registered by the DWP Provider Referral and Payment (PRaP) system based on earnings information reported to the department by HMRC within 21 months of the participant’s start on the scheme. The earnings threshold must be met within 18 months of starting on the scheme.
Self-Employed job outcomes are reported to the DWP by the provider. A provider is entitled to claim a self-employed job outcome when the participant has achieved a cumulative period of not less than 6 months of self-employment within a 547-day qualifying period, having started that 6-month period of self-employment within their 365 days on the scheme.
Job outcome expectation
There are 2 contractual job outcome expectation measures for Restart, set at the start of the contract:
- the Tender Performance Level (TPL)
- the Minimum Performance Level (MPL)
These expectations were reviewed in 2022 when the Restart contracts were renegotiated, and the programme was opened to a wider group of potential participants.
For the programme as a whole:
-
the MPL now represents an expectation that 27% of participants on the scheme will achieve a job outcome within the qualifying period over the life of the programme and is the minimum expectation set by the department
-
the TPL now represents an expectation that 36% of participants on the scheme will achieve a job outcome within the qualifying time period over the life of the programme. This expectation is derived from the proportion of participants that providers expected to achieve a job outcome during the commercial negotiation process
Each cohort of participants has a specific final job outcome expectation, with job outcome expectations rising for cohorts over time reflecting the economic conditions and maturity of the scheme anticipated during the planning of the scheme.
Throughout this publication, the number of actual job outcomes achieved by participants will be compared to the TPL and MPL expectations.
A cohort of starts reaches maturity after a 21-month period. This consists of 12 months where participants are actively on the programme, a 6-month tracking period where earnings made from employment count towards a job outcome, and a further 3-month data settlement period to allow for late-reported earnings. Job outcomes may be changed retrospectively due to data settling and so the total numbers of outcomes achieved for a given cohort may change in any future publication.
The job outcome expectations may be reported within this publication for the programme as a whole, for participants of a particular CPA, or for participants belonging to a particular start cohort.
Note: Inferences about the scheme’s delivery and effectiveness from changes in job outcome rates against expectation should be done very cautiously. Changes to the characteristics of participants within a cohort, such as from expansions to eligibility bringing in groups of participants with different circumstances and backgrounds, as well as changes in the wider economy can influence the movement of participants into work. Therefore, it is possible for job outcome rates to rise/fall in an improving/declining labour market without this representing an associated change in the impact and effectiveness of the scheme.
4. Joining the Restart Scheme
Since June 2021, to the end of April 2023, across England and Wales, there have been a total of:
-
530,000 individuals referred (individuals can have multiple referrals but are only counted once)
-
450,000 starts on the programme
Referrals to and starts on the Restart Scheme peaked in October 2021. Referral volumes are now reducing in line with expectations
Number of individuals referred to, and starting on, the Restart Scheme each month between July 2021 and April 2023
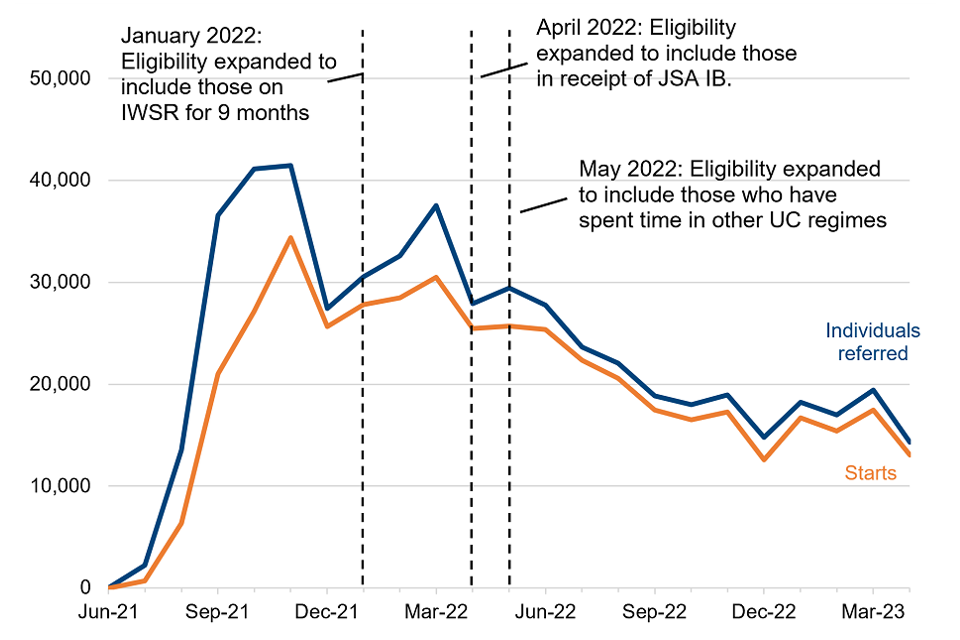
The number of individual referrals and starts increased in the months following the programme’s launch in July 2021. Eligibility rules were changed in January 2022, and again in April and May 2022. The Department reassessed the demand for the Restart Scheme and revised the number of people expected to start on the programme from 1.4 million to 0.7 million over the programme life.
The volume of referrals and starts each month has fallen since March 2022 and has shown signs of stabilising since October 2022. These volumes are in-line with the volume of referrals required to meet the revised contractual start expectation.
Nationally, 84% of individuals referred to the scheme have started to date. This varies between 82% and 87% across CPAs
Distribution of individuals referred to the Restart Scheme, and the number of which have started, in each CPA between July 2021 and April 2023
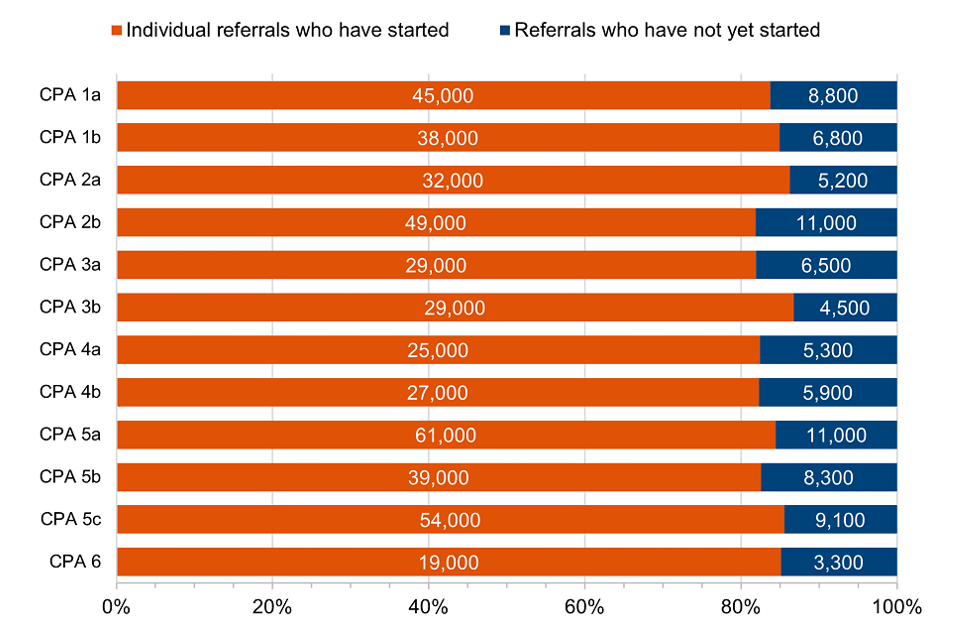
There are several reasons why an individual may not have started on the Restart Scheme having been referred. For recent referrals, this could be because the individual has not yet attended their initial meeting with the provider.
For referrals for which more than 40 working days have elapsed without a start recorded, these individuals may never go on to start. This could be because the individual found work before starting on the programme or have not attended the welcome meeting.
Up until April 2023, 84% of individuals referred have started on the programme nationally. Figures vary across areas. Cumulatively, the highest rate of individuals referred to starts is in CPA 3b (87%) and the four lowest areas are CPA 2b, CPA 3a, CPA 4a and CPA 4b (82%).
Table: Proportion of starts on the Restart Scheme by gender, from July 2021 to April 2023
Volumes and proportions of starts on Restart split by recorded gender
| Recorded Gender | Starts | Proportion of starts |
|---|---|---|
| Female | 190,000 | 43% |
| Male | 250,000 | 57% |
| Unknown | - | - |
| Total | 450,000 | 100% |
Table notes.
1. “-“ denotes nil or negligible volumes.
2. Rounding: in the table, volume of starts are rounded to the nearest 10,000. Sum of the figures may therefore not sum to 100%. These percentages are derived from unrounded figures.
Proportion of starts on the Restart Scheme by age group, July 2021
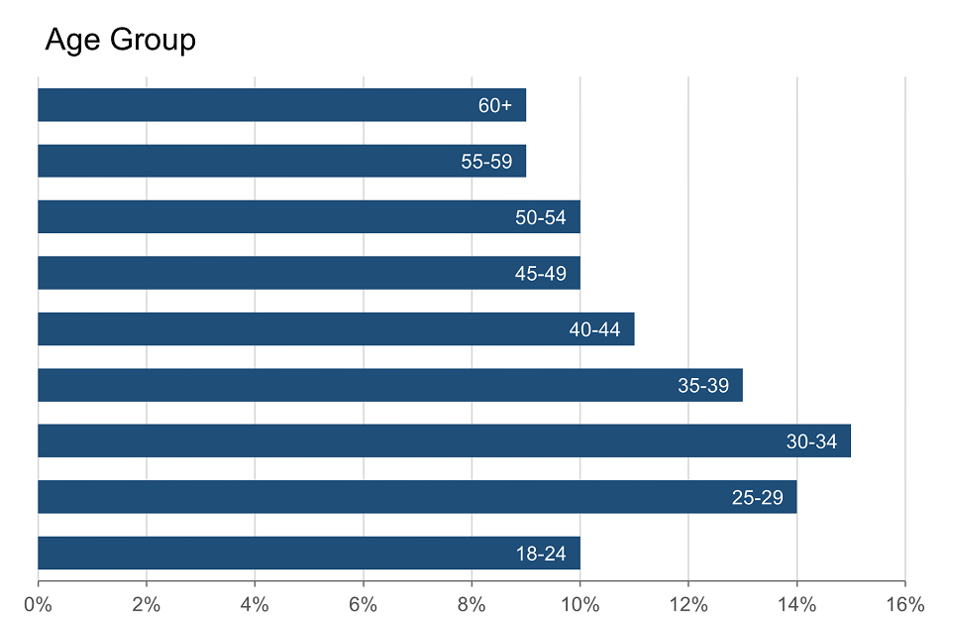
As noted in the introduction, Kickstart, a large-scale programme for young people, ran alongside Restart until April 2022. Therefore, it is likely that the numbers of young people starting on Restart during that period are lower than they would have been in the absence of Kickstart.
5. First earnings from employment, job outcomes, and job outcome rate relative to expectations
First earnings in employment are the point at which a participant achieves their first earnings from their first employment while on the programme. This excludes both first earnings from self-employment and subsequent employments.
150,000 individuals achieved first earnings between July 2021 and April 2023
July 2021 saw the first participant achieve first earnings from employment. As of April 2023, 150,000 participants have achieved first earnings from employment with 6,500 of these being achieved in the most recent month (April 2023). Some retrospection can occur in first earnings figures as recorded on HMRC Real Time Earnings (RTE) data, therefore, figures for recent months are likely to be a slight underestimate.
There was a decrease in first earnings from employment during the winter months of 2021 and 2022. A seasonal effect is seen in the first earnings data across employment provisions, where the number of participants achieving first earnings from employment decrease during the winter months each year, for example, see Work and Health Programme statistics to February 2023.
Job outcomes represent sustained employment. Not all individuals that achieve first earnings will progress to meet the criteria of a job outcome.
84,000 individuals achieved a job outcome between July 2021 and April 2023
Expectations
The expectations used in the Restart Scheme statistics are the expected number of job outcomes for the scheme, either nationally or split by CPA. These were initially set following the commercial negotiations prior to the launch of the scheme and were subsequently increased from July 2022 to reflect changes in the scheme’s eligibility criteria.
As noted in Section 3, inferences about the scheme’s delivery and effectiveness from changes in job outcome rates against expectation should be done very cautiously. Changes to the characteristics of participants within a cohort, such as from expansions to eligibility bringing different compositions of participants, and changes in the economy can influence job outcome rates. Therefore, it is possible for job outcome rates to rise/fall in an improving/declining labour market without changes to the impact and effectiveness of the scheme.
The Minimum Performance Level (MPL) is the minimum proportion of participants on the scheme that DWP expects to achieve a job outcome and is set by the department.
The Tender Performance Level (TPL) is the proportion of participants on the scheme required to achieve a job outcome and is derived from the proportion of participants Restart providers expected to achieve a job outcome.
The total number of MPL and TPL expected job outcomes is now beginning to decrease due to a lower number of people starting on the programme in-line with expectations.
84,000 participants achieved a job outcome to April 2023 compared to a TPL expectation of 84,000 (100%) and an MPL expectation of 62,000 (136%)
Job outcomes recorded each month, against the contractual TPL and MPL expectation, October 2021 to April 2023
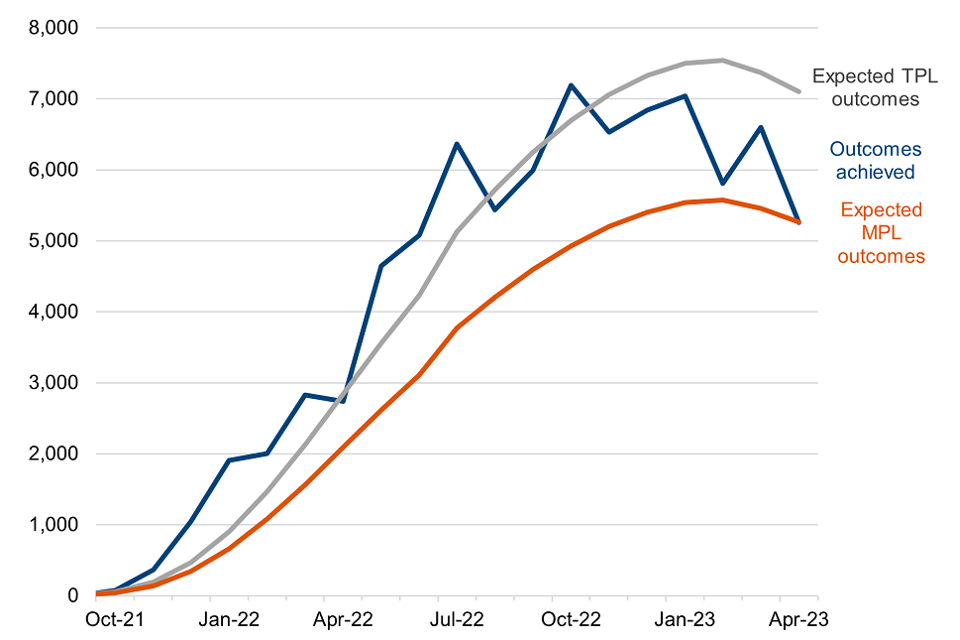
During the first year of the programme to July 2022, the number of job outcomes met or exceeded the expected in-month TPL number of job outcomes in the majority of months. From July 2022, in-month job outcomes have fluctuated, but are generally below the in-month TPL expectation and above the MPL expectation. Tracking of job outcomes is shown here from October 2021 as this is when the first meaningful contractual expectations began.
First earnings from employment and job outcomes are not directly comparable as job outcome figures include those who are self-employed, while first earnings figures do not.
In the most recent month available (April 2023) the actual number of job outcomes was 5,300, which is below the TPL expected number of job outcomes (7,100) and equal to the number of MPL expected number of job outcomes (5,300).
Actual job outcomes as a percentage of TPL and MPL expected job outcomes, by month for October 2021 to April 2023
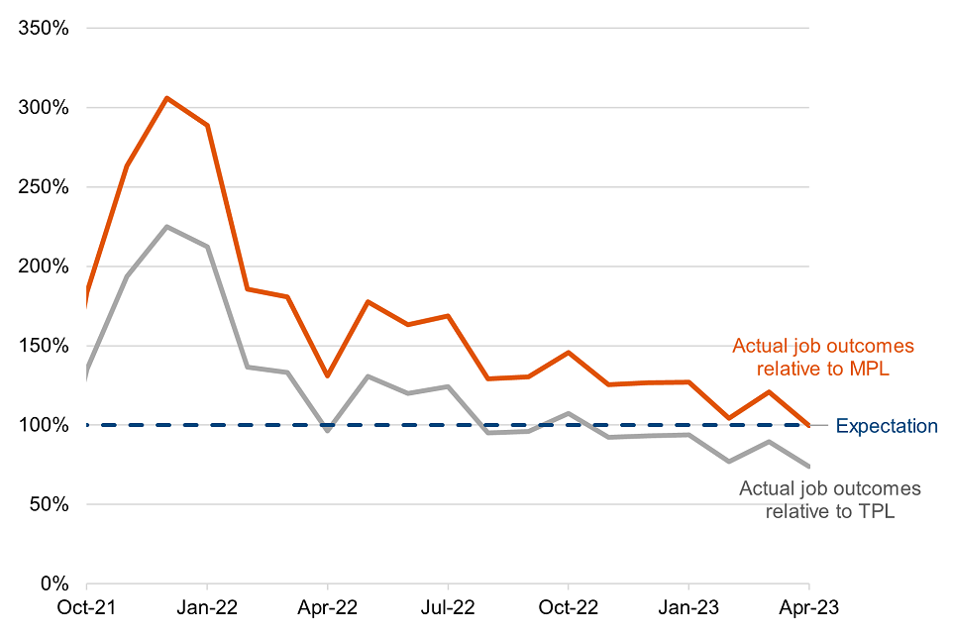
Note: The expected job outcome dashed line shows where actual job outcomes achieved are equal to the expected number of job outcomes. Tracking of job outcomes is shown here from October 2021 as this is when the first meaningful contractual expectations began. Job outcomes are recorded according to the month in which the outcome definition is achieved. For example, the 120% TPL figure for June 2022 indicates that, across all cohorts combined, the actual number of job outcomes for June 2022 was 120% of the expected number of job outcomes for this month.
The actual job outcome rate against the TPL and MPL was higher than expected in the earlier months of the scheme, with participants achieving sustained employment faster than expected in the second half of 2022. The job outcome rate has since decreased, remaining below the TPL and closer to MPL expectations since November 2022.
Nationally, overall job outcomes relative to TPL expected job outcomes has changed month to month, between 74% (April 2023) and 225% (December 2021). It can be observed that job outcome rates are lower each April. This happens alongside changes to the National Living Wage (NLW). Increases in the NLW also increase the amount participants must cumulatively earn from employment before a job outcome is recorded, creating a step change in the earnings threshold.
Table: Proportion of participants that have achieved first earnings from employment and job outcomes as of April 2023 against TPL and MPL job outcome expectation by start month, from July 2021 to October 2022
| Start Month (cohort) | First earnings rate | Job outcome rate | Current TPL job outcome expectation | Current MPL job outcome expectation | % of TPL expectation achieved | % on MPL expectation achieved |
|---|---|---|---|---|---|---|
| Jul-21 | 64% | 50% | 29% | 22% | 171% | 233% |
| Aug-21 | 59% | 44% | 30% | 22% | 148% | 201% |
| Sep-21 | 54% | 39% | 30% | 22% | 133% | 180% |
| Oct-21 | 51% | 36% | 30% | 22% | 120% | 163% |
| Nov-21 | 47% | 32% | 30% | 22% | 107% | 145% |
| Dec-21 | 44% | 30% | 29% | 21% | 103% | 140% |
| Jan-22 | 44% | 29% | 27% | 20% | 105% | 143% |
| Feb-22 | 42% | 27% | 26% | 19% | 103% | 140% |
| Mar-22 | 37% | 22% | 24% | 18% | 90% | 123% |
| Apr-22 | 34% | 20% | 22% | 16% | 87% | 119% |
| May-22 | 32% | 17% | 20% | 15% | 83% | 112% |
| Jun-22 | 31% | 15% | 18% | 13% | 82% | 111% |
| Jul-22 | 30% | 13% | 17% | 12% | 79% | 105% |
| Aug-22 | 28% | 11% | 14% | 10% | 78% | 104% |
| Sep-22 | 25% | 8% | 11% | 8% | 76% | 102% |
| Oct-22 | 23% | 6% | 8% | 6% | 71% | 95% |
Table note. These percentages are derived from unrounded figures. Later cohorts have had less time on the programme in which to move into employment as of April 2023. Please refer to table 4.2 in the supporting data tables documents for more detailed volumes.
This table shows the volume of first earnings from employment and job outcomes achieved against TPL and MPL expectations according to the participants’ start month and not the month in which the first earnings or job outcomes were achieved. Only cohorts that have matured by at least 6 months are included in this table because the volume of expected outcomes is very low during the first few months of a cohort’s time on the programme. Only cohorts up to August 2021, which were relatively small, have reached full maturity of 21 months. Further first earnings and job outcomes may still be recorded for all other cohorts.
Of the 230,000 people who have started and had the opportunity for up to 12 months of support on the scheme (those starting between July 2021 and April 2022), 42% (96,000 participants from 230,000 starts) have moved into employment (achieved first earnings). The job outcome rate for these individuals, representing sustained employment following first earnings, is 25% (against an MPL expectation of 15%, and TPL expectation of 20%). Those who have not already achieved a job outcome have a further 6 months in which to accumulate earnings towards the job outcome definition.
Some cohorts of starts have not had the full amount of time in which job outcomes may be achieved. For example, the October 2022 cohort still has 12 months in which further outcomes may be recorded. The job outcome rate against TPL and MPL expectation percentage shows how each cohort compares to the TPL and MPL job outcome expectations as of April 2023, and job outcome rates may continue to increase as each cohort matures.
All cohorts except October 2022 currently exceed or are on track to achieve MPL job outcome rate expectations, as of April 2023
Job outcome rate against current MPL job outcome expectation for cohorts that have had at least 6 months on the programme by start month, July 2021 to October 2022
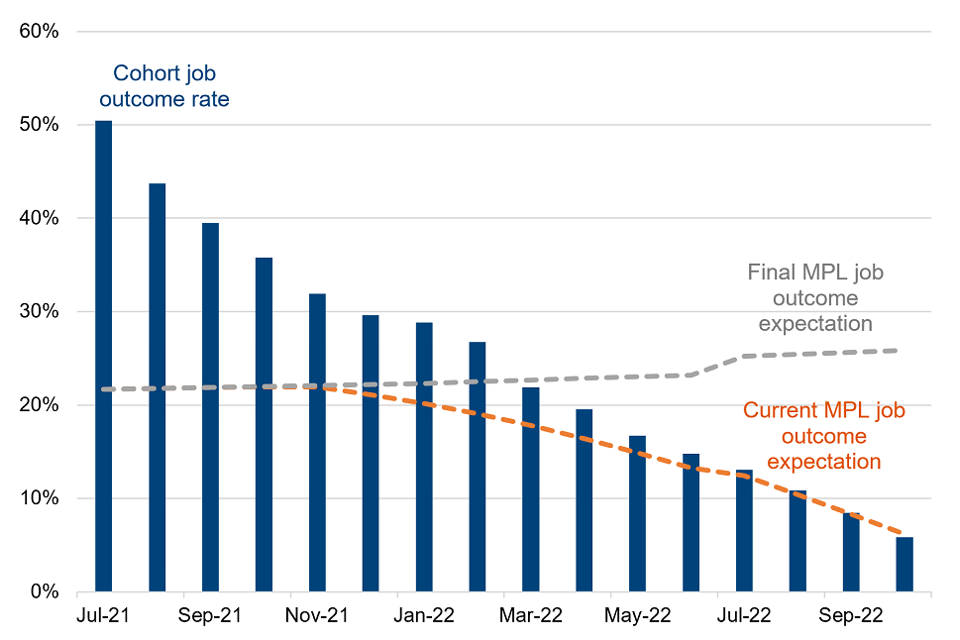
This chart shows the current job outcome rates for cohorts up to October 2022 against the MPL job outcome rate expectation for these cohorts, as of April 2023. The final MPL job outcome expectation is the minimum job outcome rate expectation for each cohort after 21 months. As of April 2023, only the July 2021 and August 2021 cohorts have fully matured.
Participants who started between July 2021 and September 2022 have met or exceeded MPL job outcome expectations so far and are on or ahead of target to achieve the final job outcome expectation for their respective cohort.
Job outcomes relative to current MPL expectation ranges between 95% (October 2022) and 233% (July 2021).
Job outcome rates of cohorts up to February 2022 currently meet or are on track to achieve TPL job outcome rate expectations, as of April 2023. Job outcome rates for cohorts from March 2022 onwards are currently lower than TPL expectations
Job outcome rate against current TPL job outcome expectation for cohorts that have had at least 6 months on the programme by start month, July 2021 to October 2022
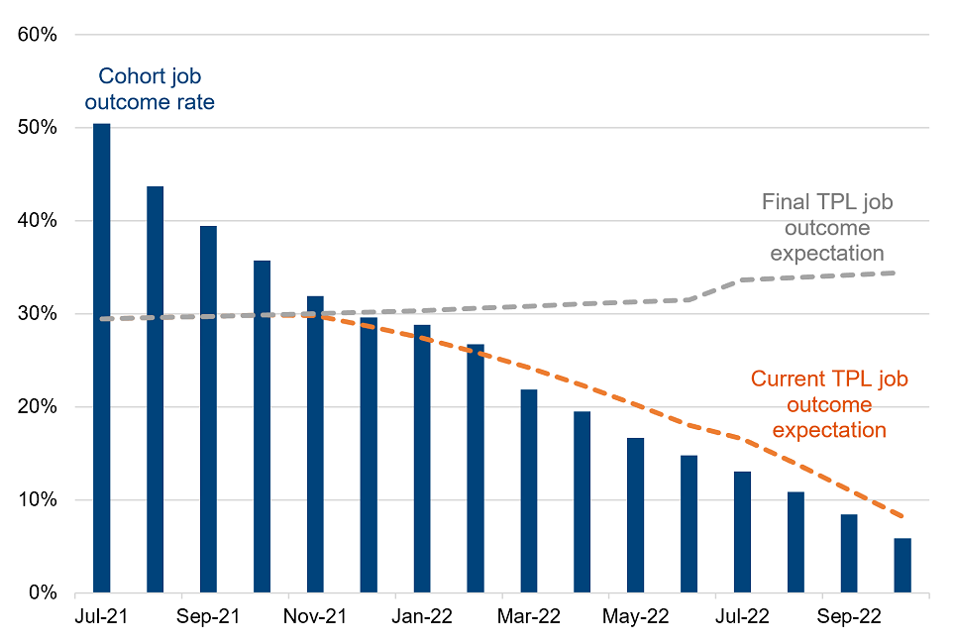
This chart shows the current job outcome rates for cohorts up to October 2022 against the TPL job outcome rate expectation for these cohorts, as of April 2023. The final TPL job outcome expectation is the job outcome rate expectation for each cohort after 21 months. As of April 2023, only the July 2021 and August 2021 cohorts have fully matured.
Participants who started between July 2021 and February 2022 have met or exceeded TPL job outcome expectations so far, and therefore are on track to meet or exceed the final job outcome expectation for their respective cohort.
Job outcome rates are between 71% (October 2022) and 171% (July 2021) of the current TPL expectation.
The July 2021 and August 2021 cohorts are comparatively small in volume to subsequent cohorts, and this should be taken into account when considering job outcome rates against expectations for these participants.
25% of participants who have had the opportunity of 12 months of support on the scheme have achieved a job outcome within 12 months
Percentage of starts achieving a job outcome within 6 months (starts July 2021 to October 2022), 12 months (starts July 2021 to April 2022), and 18 months (starts July 2021 to October 2021) against MPL expectation, by start month
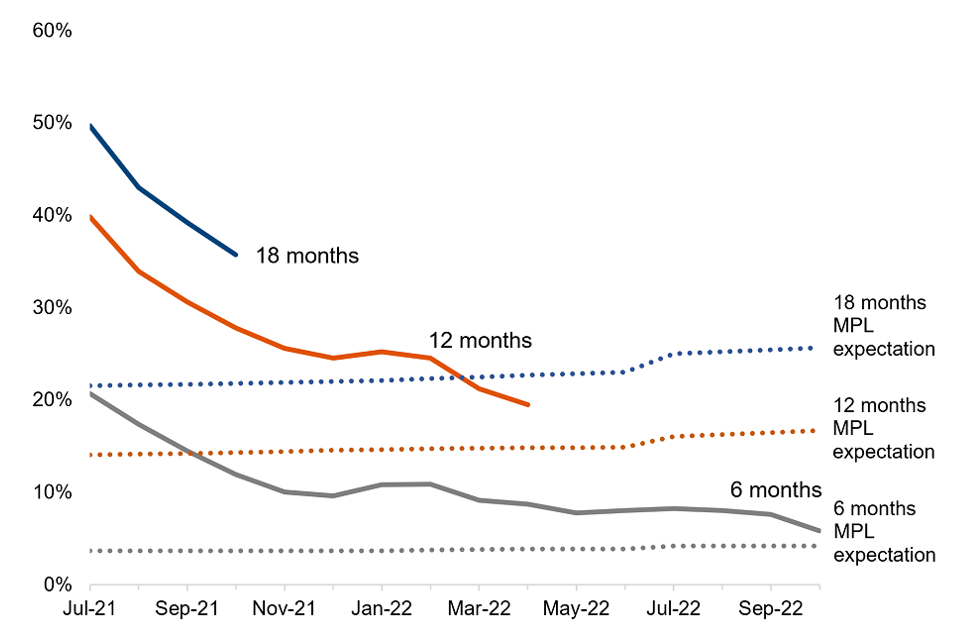
Percentage of starts achieving a job outcome within 6 months (starts July 2021 to October 2022), 12 months (starts July 2021 to April 2022), and 18 months (starts July 2021 to October 2021) against TPL expectation, by start month
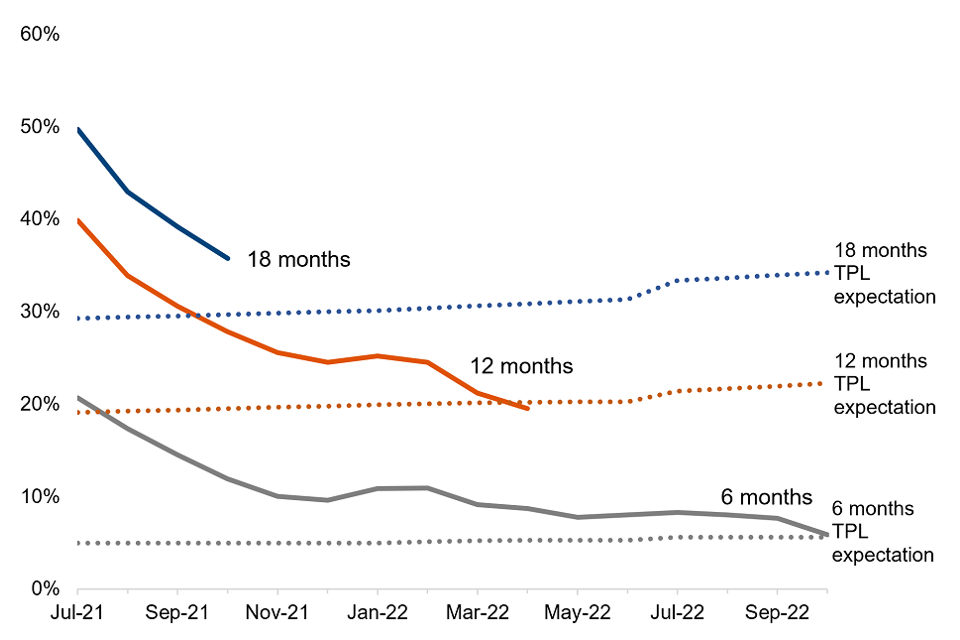
Note: Each dotted line is the corresponding MPL or TPL expectation for each maturity period (6, 12 or 18 months). For example, the percentage of each cohort that have achieved a job outcome within 6 months should be compared against the corresponding 6 months MPL or TPL expectation line.
These graphs show the percentage of cohorts achieving a job outcome within 6 to 18 months of starting on the programme and only show cohorts that have had the opportunity of at least this amount of time on the scheme. They are compared against the MPL and TPL job outcome expectation for each cohort after it matures by 6, 12 and 18-months. Whilst the 21-month measure is the key long-term measure, it is the least timely as we can currently only report it for cohorts that started before September 2021.
Over time, the percentage of starts achieving a job outcome within a given time period has decreased. It currently ranges between:
-
21% (July 2021) and 6% (October 2022) within 6 months of starting on the programme
-
40% (July 2021) and 20% (April 2022) within 12 months of starting on the programme
-
50% (July 2021) and 36% (October 2021) within 18 months of starting on the programme
Job outcome rates were higher than expected in the earlier months of the scheme, with participants moving into sustained work faster than expected in the second half of 2021. Job outcome rates are now lower and remain closer to expected levels. All cohorts that are appropriately mature currently exceed the MPL job outcome expectation after 6, 12 and 18 months. All cohorts that are appropriately mature currently exceed the TPL job outcome expectation after 6 and 18 months, however, the April 2022 cohort does not currently meet the TPL expectation after 12 months.
Overall, job outcomes exceed MPL expectations in all Contract Package Areas between July 2021 and April 2023
Actual job outcomes as a proportion of expected TPL and MPL job outcomes for each contract package area, July 2021 to April 2023
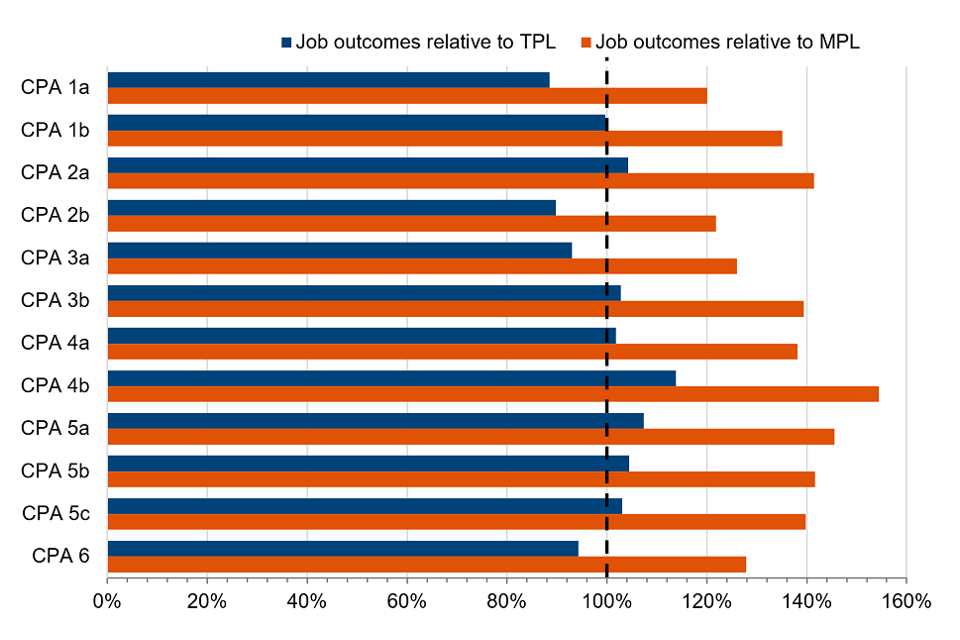
Across all contract package areas, overall actual job outcomes relative to MPL ranges between 120% (CPA 1a) and 154% (CPA 4b) of the expected minimum number of outcomes, when summed across the period July 2021 and April 2023. Compared to the TPL, job outcome rates range between 89% (CPA 1a) and 114% (CPA 4b).
8 of 12 contract package areas have an overall job outcome rate that meets or exceeds the TPL expectation between July 2021 and April 2023
Table: Job outcomes recorded, MPL and TPL job outcomes expected, and percentage of MPL and TPL expectation achieved by contract package area, July 2021 to April 2023
| Contract Package Area | Job outcome recorded | Job outcome expectation (TPL) | Job outcome expectation (MPL) | % of TPL expectation achieved | % of MPL expectation achieved |
|---|---|---|---|---|---|
| CPA 1a | 7,200 | 8,100 | 6,000 | 89% | 120% |
| CPA 1b | 6,900 | 6,900 | 5,100 | 100% | 135% |
| CPA 2a | 6,200 | 6,000 | 4,400 | 104% | 141% |
| CPA 2b | 8,100 | 9,000 | 6,600 | 90% | 122% |
| CPA 3a | 5,200 | 5,600 | 4,100 | 93% | 126% |
| CPA 3b | 5,500 | 5,400 | 4,000 | 103% | 139% |
| CPA 4a | 5,100 | 5,000 | 3,700 | 102% | 138% |
| CPA 4b | 5,900 | 5,200 | 3,900 | 114% | 154% |
| CPA 5a | 12,000 | 11,000 | 8,400 | 107% | 146% |
| CPA 5b | 7,600 | 7,300 | 5,400 | 104% | 142% |
| CPA 5c | 10,000 | 10,000 | 7,500 | 103% | 140% |
| CPA 6 | 3,300 | 3,500 | 2,600 | 94% | 128% |
| National | 84,000 | 84,000 | 62,000 | 100% | 136% |
Table note. In this table job outcomes achieved, and job outcome expectations are rounded. These percentages are derived from unrounded figures. Sum of figures may therefore not sum to national volumes. Please refer to tables 2.1 and 4.1 in the supporting data tables for more detailed volumes.
All contract package areas have either met or exceeded the MPL job outcome expectation with the last 6 and 12 months
Job outcome rate relative to MPL expectation for the latest 6 and 12 months, split by contract package area
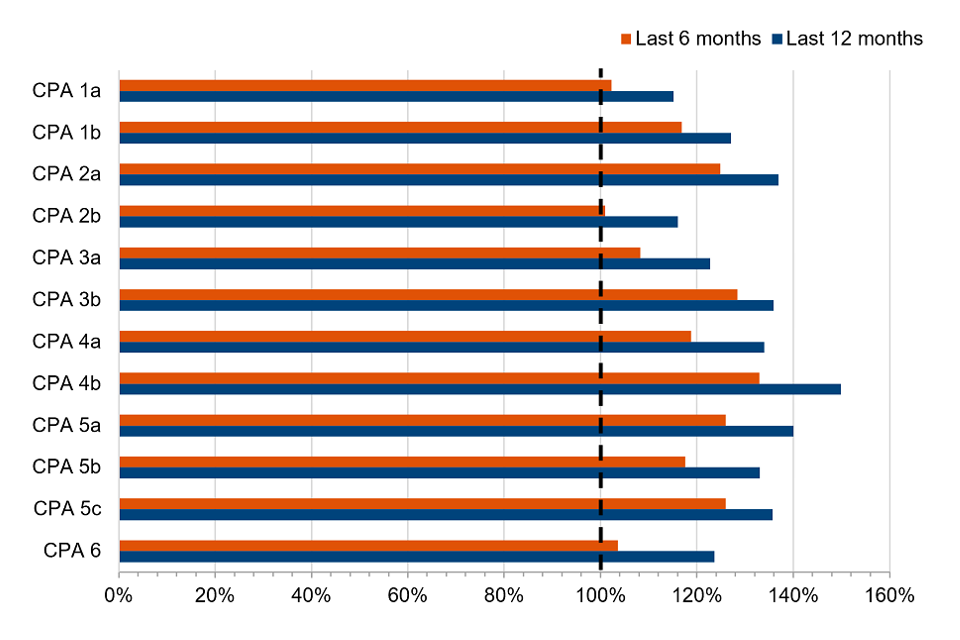
This chart shows number of job outcomes recorded in each CPA over the previous 6 and 12 month periods as a proportion of the MPL expectation for that period. For the 6-month measure, this is the number of MPL job outcomes expected between November 2022 and April 2023 and for the 12-month measure between May 2022 and April 2023.
The actual number of job outcomes exceeded the MPL expected number of job outcomes for the 12-month measure across all CPAs (May 2022 to April 2023), ranging between 115% (CPA 1a) and 150% (CPA 4b). In the most recent 6-month period available (November 2022 and April 2023), the actual number of job outcomes against expected MPL job outcomes ranges between 101% (CPA 2b) and 133% (CPA 4b).
5 of 12 contract package areas have met or exceeded the TPL job outcome expectation over the last 12 months. Job outcomes have been below the TPL job outcome expectation over the last 6 months in all contract package areas
Job outcome rate relative to TPL expectation for the latest 6 and 12 months, split by contract package area
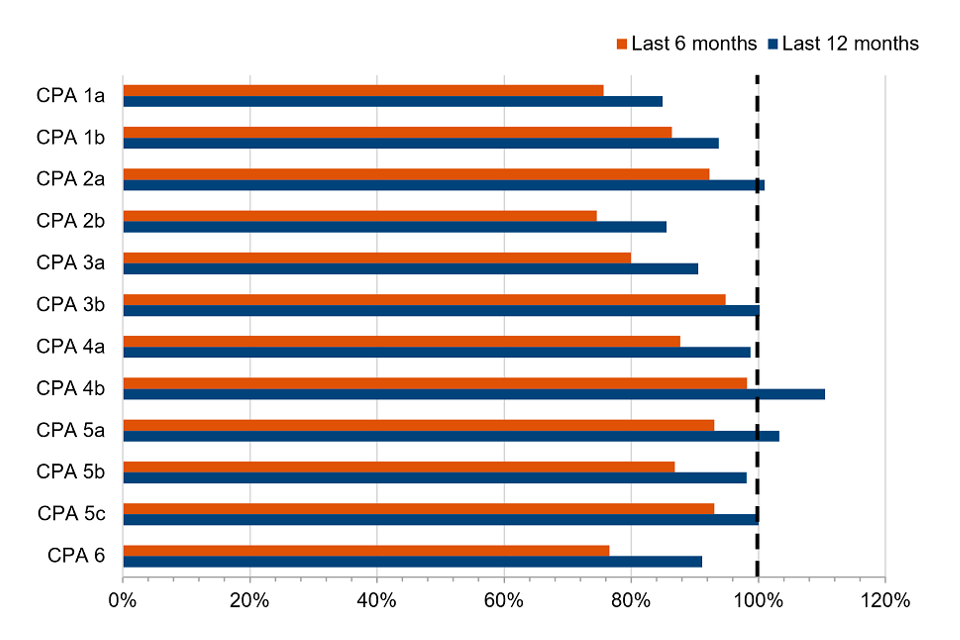
This chart shows number of job outcomes recorded in each CPA over the previous 6 and 12 month periods as a proportion of the TPL expectation for that period. For the 6-month measure, this is the number of TPL job outcomes expected between November 2022 and April 2023 and for the 12-month measure between May 2022 and April 2023.
The actual number of job outcomes exceeded the TPL expected number of job outcomes for the 12-month measure across 5 CPAs (May 2022 to April 2023), ranging between 85% (CPA 1a) and 110% (CPA 4b). In the most recent 6-month period available (November 2022 and April 2023), the actual number of job outcomes against expected TPL job outcomes ranges between 75% (CPA 2b) and 98% (CPA 4b).
6. About these statistics
Key points and trends within this publication are presented using charts and commentary. The information underlying the charts is available as supporting tables.
Rounding
Percentages are calculated using unrounded numbers, to the nearest whole percentage point. For these reasons, some totals may not sum to 100. The headline figures and those accompanying the graphs have been rounded as shown in the following table.
| From | To | Round to nearest |
|---|---|---|
| 0 | 1,000 | 10 |
| 1,001 | 10,000 | 100 |
| 10,001 | 100,000 | 1,000 |
| 100,001 | 1,000,000 | 10,000 |
| 1,000,001 | 10,000,000 | 100,000 |
| 10,00,001 | 100,000,000 | 1,000,000 |
How can this data be used?
You can use this data:
-
for monitoring the overall flow of participants being referred to and starting on the Restart Scheme, those achieving first earnings and job outcomes
-
for monitoring the differences in demographics of programme participants for gender, age group and area
You cannot use this data:
-
for making simple comparisons between different demographic groups (gender, age group and area) in terms of the success of the programme
-
for making conclusions about the effectiveness of the programme over time or by area. Where job outcome rates are high compared to planning expectations it does not necessarily mean that the programme is more impactful, likewise at points where job outcome rates are lower it does not automatically mean that the programme is less impactful. The movement of participants into work will be impacted by the programme’s effectiveness but will also naturally follow wider labour market trends and will be influenced by economic conditions as well as the particular circumstances of participant groups. Determination of the effectiveness of the programme can only be done through impact evaluation
Status of the statistics
This release is classed as experimental statistics which is official statistics that are under development. There can be a wider degree of uncertainty with experimental statistics, but this does not mean they are of low quality. All experimental statistics are working towards full compliance with the Code of Practice for Statistics which makes sure official statistics are trustworthy, have public value, and are of high quality.
The strengths and limitations of these statistics are explained in the background information and methodology document.
These statistics are being published now to engage with potential users in the developments and make improvements that meet user needs. You can send your comments by email to cep.statistics@dwp.gov.uk.
We would like to know what our users think about the content of this publication and about new measures you would find useful.
More information about experimental statistics is provided by the Office for Statistics Regulation.
Plan to remove the experimental label from these official statistics
This is a new bi-annual publication as of June 2023. We are planning to gather user views to guide our developments for at least 2 releases.
The status of these statistics will be reviewed in Summer 2024.
Statement of compliance with the Code of Practice for Statistics
The Code of Practice for Statistics (the Code) is built around 3 main concepts, or pillars:
-
trustworthiness – is about having confidence in the people and organisations that publish statistics
-
quality – is about using data and methods that produce statistics
-
value – is about publishing statistics that support society’s needs
The following explains how we have applied the pillars of the Code in a proportionate way.
Trustworthiness
These figures have been published to provide additional information on the Restart Scheme. Releasing them on a regular basis will give equal access to all those with an interest in them.
Quality
The data which underpins this information is taken directly from the DWP Provider Referral and Payments System, Customer information System, Labour Market System and Universal Credit administrative data.
The methodology and calculations have been quality assured by DWP analysts to ensure they are the best estimates using information available at the time.
Value
Producing and releasing these figures is in the public interest and provides User Organisations and the public with useful information about the Restart Scheme that they may not otherwise be able to generate or obtain.
Further information and feedback
Contact DWP Press Office if you have any questions or feedback.
DWP Press Office: 0115 965 8828
Lead Analyst: Simon Marlow
Analysts: Laura Durant, Michael Leonard, Robin Wood
ISBN: 978-1-78659-528-7