Reported road casualties Great Britain: road user risk, 2021 data
Published 29 September 2022

© Crown copyright 2022
This publication is licensed under the terms of the Open Government Licence v3.0 except where otherwise stated. To view this licence, visit nationalarchives.gov.uk/doc/open-government-licence/version/3 or write to the Information Policy Team, The National Archives, Kew, London TW9 4DU, or email: psi@nationalarchives.gov.uk.
Where we have identified any third party copyright information you will need to obtain permission from the copyright holders concerned.
This publication is available at https://www.gov.uk/government/statistics/reported-road-casualties-great-britain-road-user-risk-2021/reported-road-casualties-great-britain-road-user-risk-2021-data
About this release This short report presents data on those killed in reported road accidents in Great Britain, both in terms of the number of fatalities and fatality rates, for different road user types. This includes the road users themselves, as well as other parties in collisions with them.
We welcome feedback on this initial analysis to help us develop it further, by email to the road safety statistics team
Introduction
Traditionally, road user risk has been presented in terms of casualty rates, by road user type (such as those shown in the following section), where the casualty rate is calculated is number of casualties per vehicle mile, or per passenger mile. [footnote 1]
Recent work by road safety stakeholders has looked at the risk different road users present to others, in particular ‘vulnerable road users’[footnote 2], using the Department’s STATS19 data of road casualties reported by the police.
This report represents the Department’s work to present analysis of STATS19 data in a similar way, which we hope can be developed further and updated on an annual basis, subject to user feedback. This report updates an equivalent analysis based on 2020 data published previously.
Main findings
These statistics show that, in 2021:
-
Car occupants accounted for 44% of road users killed in Great Britain, more than any other road user group, reflecting the fact that cars account for most traffic with fatality rates for car occupants lower than vulnerable road users
-
The more vulnerable road users (motorcyclists, pedal cyclists and pedestrians) together accounted for half (50%) of fatalities and had the highest user casualty rates
-
Cars were the vehicle type most often involved in fatal collisions where other road users were killed, followed by heavy goods vehicles (HGVs)
-
Per passenger mile, HGVs had the highest rate of other road user fatalities, followed by motorcyclists, whereas pedal cyclists and pedestrians presented lower risks of fatality to other road users in collisions
Road users killed - numbers and rates
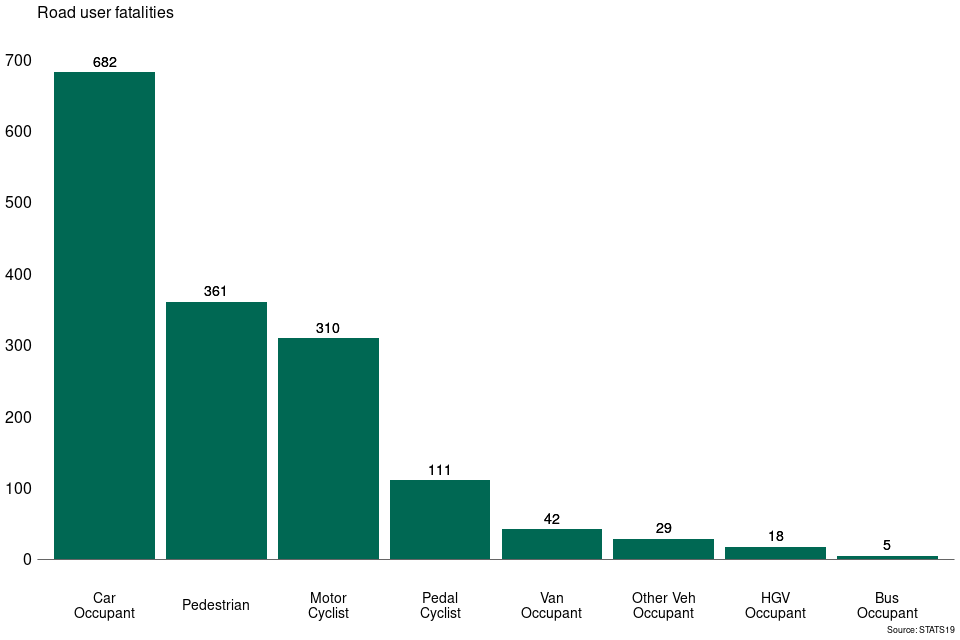
Chart 1 shows that in terms of absolute counts, car occupants (including car drivers and car passengers) were the road user group with the greatest number of fatalities (44% of total fatalities in 2021). However, this is unsurprising as cars account for the majority of the traffic on Britain’s roads.
Together the ‘vulnerable road users’ accounted for half of fatalities in 2021 (pedestrians 23%, motorcyclists 20% and pedal cyclists 7%).
Chart 1: Fatalities in reported road accidents by road user type, GB 2021
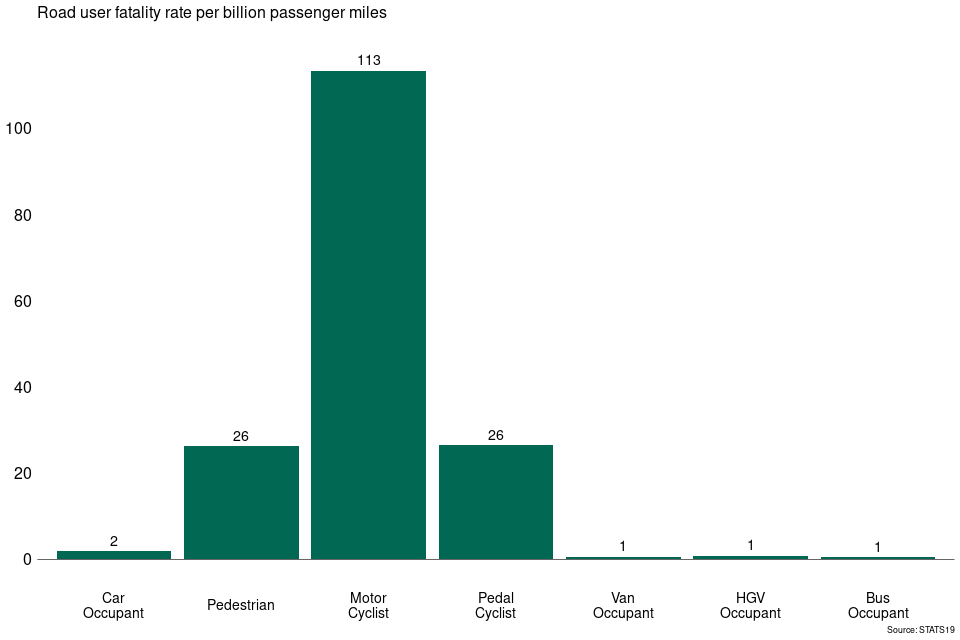
When considered in terms of fatality rates (fatalities per passenger mile travelled) for each mode of transport, there is a group of road users with much higher casualty rates. These are typically referred to as ‘vulnerable road users’ (usually defined as pedestrians, pedal cyclists and motorcyclists). All of these groups have much higher fatality rates per mile travelled compared to other road users, as shown in Chart 2.
As some road safety stakeholders have noted, some care is needed in making comparisons based on casualty rates, as, for example, the type of trips made by different modes are different (for example, car trips tend to be longer than cycle trips). Rates are more useful for showing trends over time for the various road user groups.
Chart 2: Fatalities in reported road accidents per billion passenger miles by road user type, Great Britain 2021
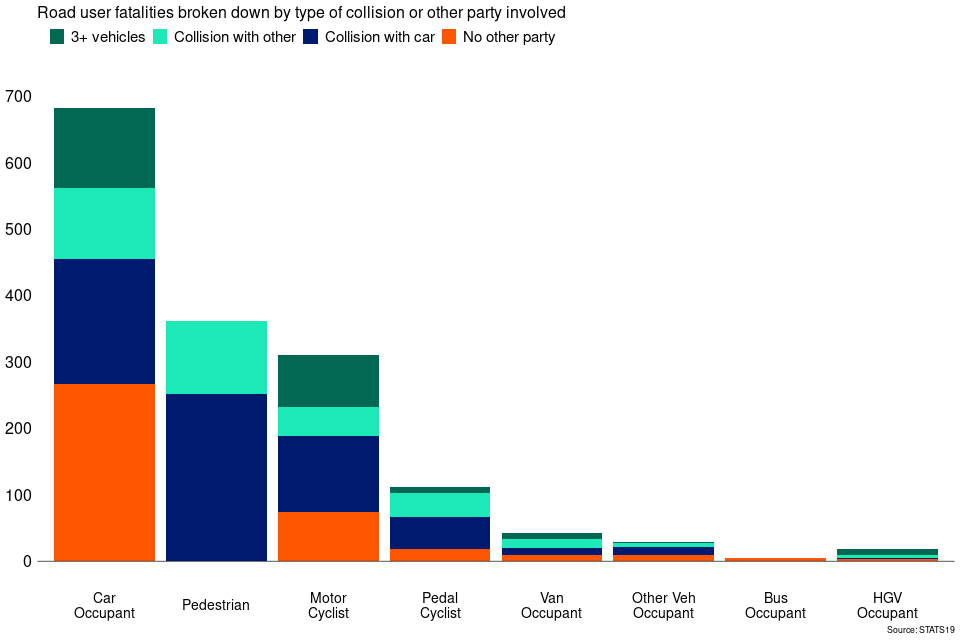
The above analysis relates to fatality risk for different types of road user, but does not consider the risk that other road users present to them. Chart 3 breaks down the total fatalities by the nature of collision they are involved in[footnote 3]. This is based on data published in table RAS0601
This shows that a considerable proportion of car occupant and motorcyclist fatalities occur in single vehicle accidents (39% and 24% respectively in 2021)
This also shows that ,ost vulnerable road users fatalities are killed in collisions with cars. In 2021, 70% of pedestrian and 42% of pedal cyclist fatalities were hit by a car. Again, this is perhaps unsurprising given that cars account for the majority of traffic.
Chart 3: Fatalities in reported road accidents by road user type and type of collision, Great Britain 2021
Other road users killed in collisions by colliding vehicle type - numbers and rates
The above analysis presented fatalities for different types of road user. The following looks at the other party involved in fatal collisions, where this can be determined. Note that this excludes any non-pedestrian casualties in single vehicle accidents (i.e. where there is no other party involved) and in accidents with more than two vehicles (where it is not possible to determine which vehicles collided).
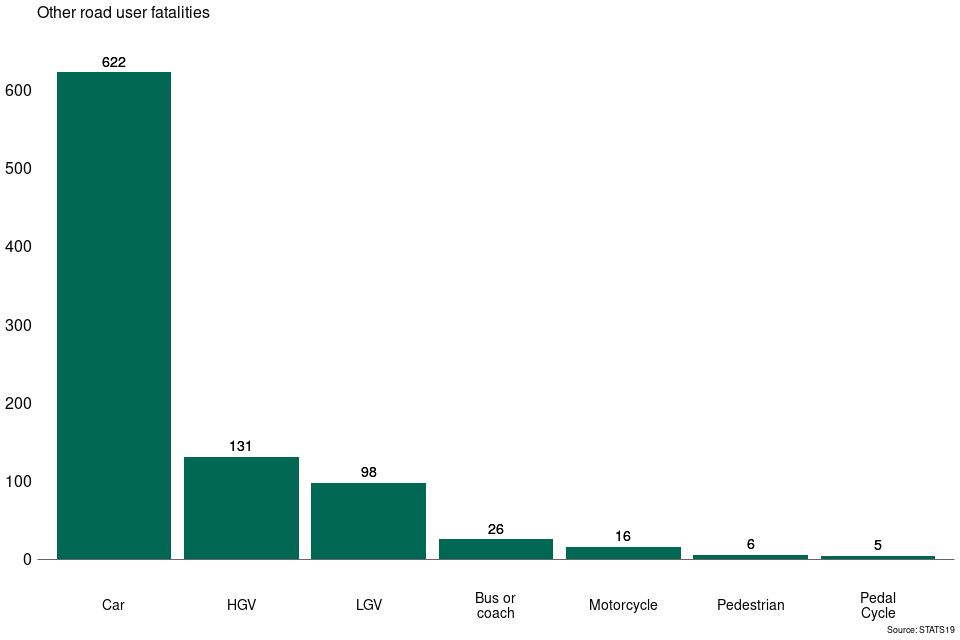
Chart 4 shows that, again, in terms of absolute numbers, cars are the vehicle type most often involved in fatal collisions when others are killed, followed by HGVs and Light Goods Vehicles (LGVs). Very few other road users are killed in collisions with pedal cyclists or pedestrians (5 and 6 respectively in 2021).
Chart 4: Other road users killed by vehicle or road user in collision (where known), Great Britain 2021
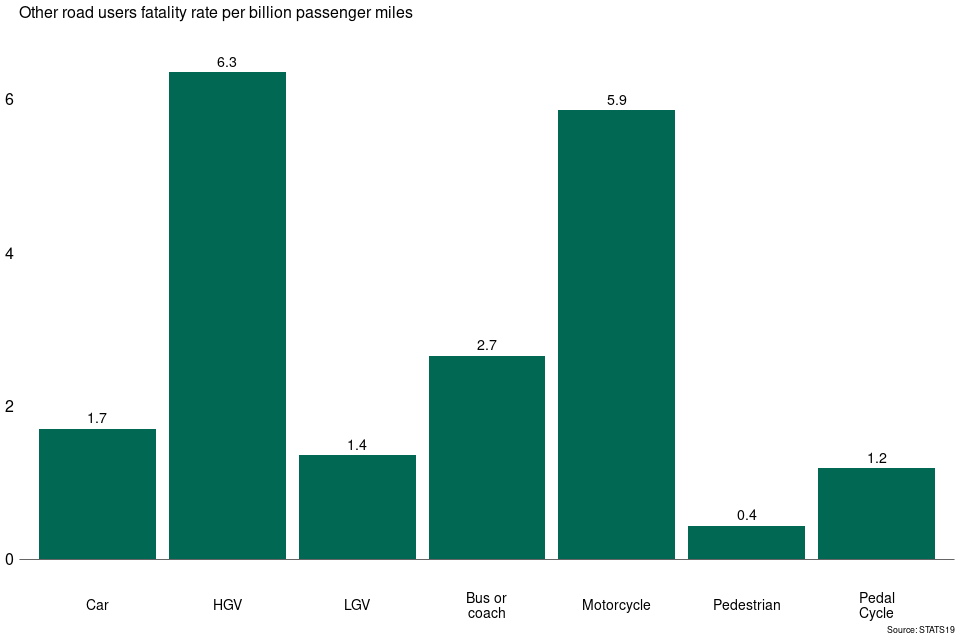
In the same way as above, we can also calculate rates for each vehicle type - these are the number of other road users killed in collisions with a given vehicle type, per passenger mile travelled by users of that vehicle type.
On this basis, HGVs have the highest rates of fatality risk to other road users. Again, it is perhaps unsurprising that larger vehicles are more likely to present fatality risks when colliding with smaller vehicles or vulnerable road users.
It should be noted that these rates relate only to the types of collision noted above, and so will be underestimates of total collision rates for each of the vehicle types - though the broad pattern shown is likely to be unaffected.
Chart 5: Other road users killed by vehicle or road user in collision (where known) per billion passenger miles, Great Britain 2021
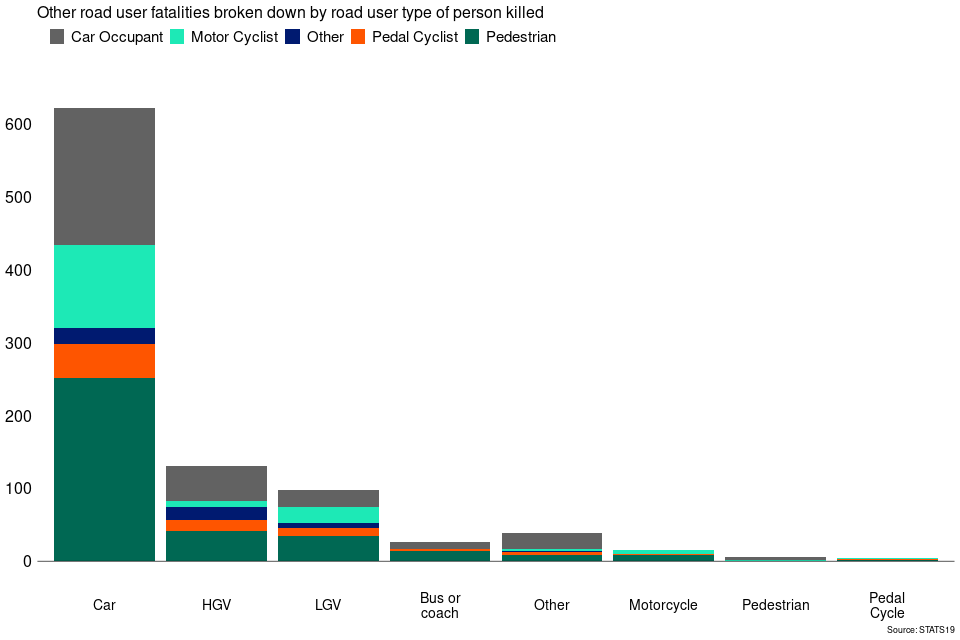
Finally, we can again break down the figures by the nature of the collisions, which illustrates the types of road user being killed in collision with different vehicles.
This shows for example that, on this basis:
-
around half (48%) of those killed by cars in 2021 were either pedestrians or pedal cyclists, with occupants of other cars accounting for 30%
-
of fatalities in collisions with HGVs, 37% were car occupants and 32% were pedestrians
Chart 6: Other road users killed by road user type, by vehicle or road user in collision (where known), Great Britain 2021
Further development
This report presents an initial analysis which could be developed further for example by:
-
Looking at trends over time to explore any changes in the numbers and rates, particularly as recent years have been affected by the COVID-19 pandemic
-
Considering data for seriously injured casualties as well as fatalities, or grouping several years, to provide more robust figures. This is particularly relevant for cases where number of fatalities in a single year is small (e.g. other road users killed in collisions with pedal cyclists)
-
Exploring data for different types of road, for example excluding motorways - this can affect the casualty rates as motorways are relatively safe and for some vehicle types (notably HGVs) a high proportion of traffic is on motorways
-
Exploring different ways to calculate casualty rates, rather than per mile travelled - for example by time spent travelling, or number of trips made.
Background information
Data sources and calculation approach
Most of the casualty data in this report is based on that shown in table RAS0601 of the Department’s reported road casualty statistics
Rates per billion passenger miles are in most cases calculated using data from the Department’s road traffic statistics (in particular tables TRA0101 and TRA0402) together with assumptions about vehicle occupancy. These assumptions are consistent with those used in table RAS0203 showing passenger casualty rates by mode. We assume average occupancy of 1.65 per car, 1.33 per LGV, 1.18 per HGV,1.08 per motorcycle and 1 per pedal cycle.
The exception to the above is for pedestrians, where distance walked per person is taken from the National Travel Survey table NTS0303 multiplied by the GB population.
A number of choices are involved in deciding how to calculate and present the analysis. Most notably, we have decided to focus on rates per passenger mile rather than per vehicle mile. This makes the biggest difference for buses and coaches, where average vehicle occupancy is highest of all road user types. The risk to others posed by buses would be higher when expressed as a rate per vehicle mile than as a rate per passenger mile.
We would be happy to provide details of the specific data used in these calculations should the above be unclear.
Related work
A number of road road safety researchers and others have analysed data on road casualty rates and risk to other road users. There are some differences in the approach taken - for example, whether rates are calculated per vehicle mile, or per passenger mile - which can mean some differences in the results.
Some recent work includes:
-
the Parliamentary Advisory Council for Transport Safety (PACTS) in their report What kills most on the roads?
-
Aldred, Johnson et al in their report How does mode of travel affect risks posed to other road users?
-
Scholes et al in Fatality rates associated with driving and cycling for all road users in Great Britain 2005–2013 which looks at rates based on time spent travelling rather than distance travelled
Instructions for printing and saving
Depending on which browser you use and the type of device you use (such as a mobile or laptop) these instructions may vary.
Tablets and mobile devices normally have the option to “find in text” and “print or save” in their sharing or quick options menu of their browser, but this will vary by device model.
How to search
Select Ctrl and F on a Windows laptop or Command and F on a Mac
This will open a search box in the top right-hand corner of the page. Type the word you are looking for in the search bar and press enter.
Your browser will highlight the word, usually in yellow, wherever it appears on the page. Press enter to move to the next place it appears.
Contact details
Road safety statistics
Email roadacc.stats@dft.gov.uk
-
Vehicle miles are recorded in the Department’s road traffic statistics. Passenger miles are calculated by multiplying vehicle mileage by the average vehicle occupancy, for example as estimated using travel survey data. This accounts for the fact that some vehicles, notably buses, carry more passengers. ↩
-
For the purposes of this factsheet, vulnerable road users are considered to be pedestrians, pedal cyclists and motorcyclists ↩
-
In the STATS19 database, it is not possible to determine the exact nature of collisions involving more than two vehicles, so 3+ vehicle collisions have been presented together for simplicity. The exception is for pedestrian casualties where the vehicle which hit them is recorded. ↩