Reported road casualties in Great Britain: younger and older car drivers factsheet, 2025
Updated 24 September 2026

© Crown copyright 2026
This publication is licensed under the terms of the Open Government Licence v3.0 except where otherwise stated. To view this licence, visit nationalarchives.gov.uk/doc/open-government-licence/version/3 or write to the Information Policy Team, The National Archives, Kew, London TW9 4DU, or email: psi@nationalarchives.gov.uk.
Where we have identified any third party copyright information you will need to obtain permission from the copyright holders concerned.
This publication is available at https://www.gov.uk/government/statistics/reported-road-casualties-great-britain-older-and-younger-driver-factsheets/reported-road-casualties-in-great-britain-younger-and-older-car-drivers-factsheet-2025
1. About this factsheet
This factsheet provides an overview of police-reported collisions involving either younger or older car drivers in Great Britain (England, Scotland and Wales), highlighting the main trends and comparing the characteristics of these collisions. Younger and older car drivers are notable sets of road users as they have higher KSI casualty rates per mile travelled than drivers in other age groups. Older drivers are of particular interest given the ageing population and therefore the growing number of older people holding driving licences.
Younger drivers are defined as drivers aged 17 to 24 years.
Older drivers are defined as drivers aged 70 years and over.
Comparisons are generally made against drivers of other ages, which we define as from 25 to 69.
Long term trends are taken from various dates due to availability of data.
For comparisons data is grouped for years from 2021 to 2025 to allow sufficiently robust comparisons between age groups.
2. Main findings
In 2025:
-
19% of all car driver fatalities were younger drivers, and 27% of all car driver fatalities were older drivers
-
20% of KSI casualties were from collisions involving a younger driver, and 14% were from collisions involving an older driver
The long-term trends are:
-
between 2004 and 2025, KSI casualties among younger car drivers have decreased 64% from 3,811 to 1,381, while KSI casualties among older car drivers have increased 14% from 1,087 to 1,238
-
between 1990 and 2025, fatalities of younger car drivers have decreased 81% from 448 to 84, while fatalities of older car drivers have decreased 26%, from 164 to 122
-
between 2012 and 2025, the share of full driving licence holders who were older drivers increased from 10.4% to 14.8%, while the share who were younger drivers decreased from 7.7% to 6.3%
Using the grouped data for the period 2021 to 2025:
-
passengers accounted for a larger proportion of KSI casualties in collisions involving younger drivers (21%) than in collisions involving other car drivers aged 25 to 69 (12%) and collisions involving older car drivers (14%)
-
passengers aged 16 to 24 made up 85% of passenger fatalities and 81% of passenger KSI casualties in cars driven by younger drivers
-
younger drivers were particularly over-represented in collisions during the late evening and early morning, accounting for a peak of 38% of car driver KSI casualties at 2am
-
single-car collisions made up a larger share (36%) of younger car driver KSI casualties than those of older car drivers (21%) or other-aged drivers (22%)
-
younger car driver casualties were more likely than older driver casualties to be recorded as not wearing a seatbelt, particularly among fatalities, at 29% for younger drivers compared with 12% for older car drivers
The sections below provide more detailed evidence on casualty trends, exposure-based risk, demographics and collision circumstances.
3. Long-term trends
This section examines changes in the age profile of drivers and car driver casualties over the last three decades.
3.1 Driving licence share
Table 1 shows the number and share of driving licence holders for each age group, 2012 and November 2025. Driving licence data is sourced from the DVLA driving licence data.
Comparable driving licence data are available from 2012.
Comparing 2025 with 2012:
-
older drivers accounted for 14.8% of all full driving licences in 2025, up from 10.4% in 2012
-
younger drivers accounted for 6.3% of all full driving licences in 2025, down from 7.7% in 2012
-
other drivers aged 25 to 69 accounted for broadly a similar share of full driving licences in 2025 relative to their share in 2012
Table 1: Driving licence counts and shares by age group, 2012 and 2025
| Driver age group | Full licences 2012 | Full licences 2025 | Full licences 2012 share (%) | Full licences 2025 share (%) |
|---|---|---|---|---|
| 17 to 24 | 2,886,868 | 2,706,384 | 7.7 | 6.3 |
| 25 to 69 | 30,777,390 | 33,805,822 | 81.9 | 78.9 |
| 70+ | 3,902,135 | 6,341,485 | 10.4 | 14.8 |
| Total | 37,566,393 | 42,853,691 | 100 | 100 |
3.2 Fatalities and KSI casualties
Chart 1 shows the number of car driver KSI casualties in each age group between 2004 and 2025. Severity-adjusted KSI figures are available from 2004.
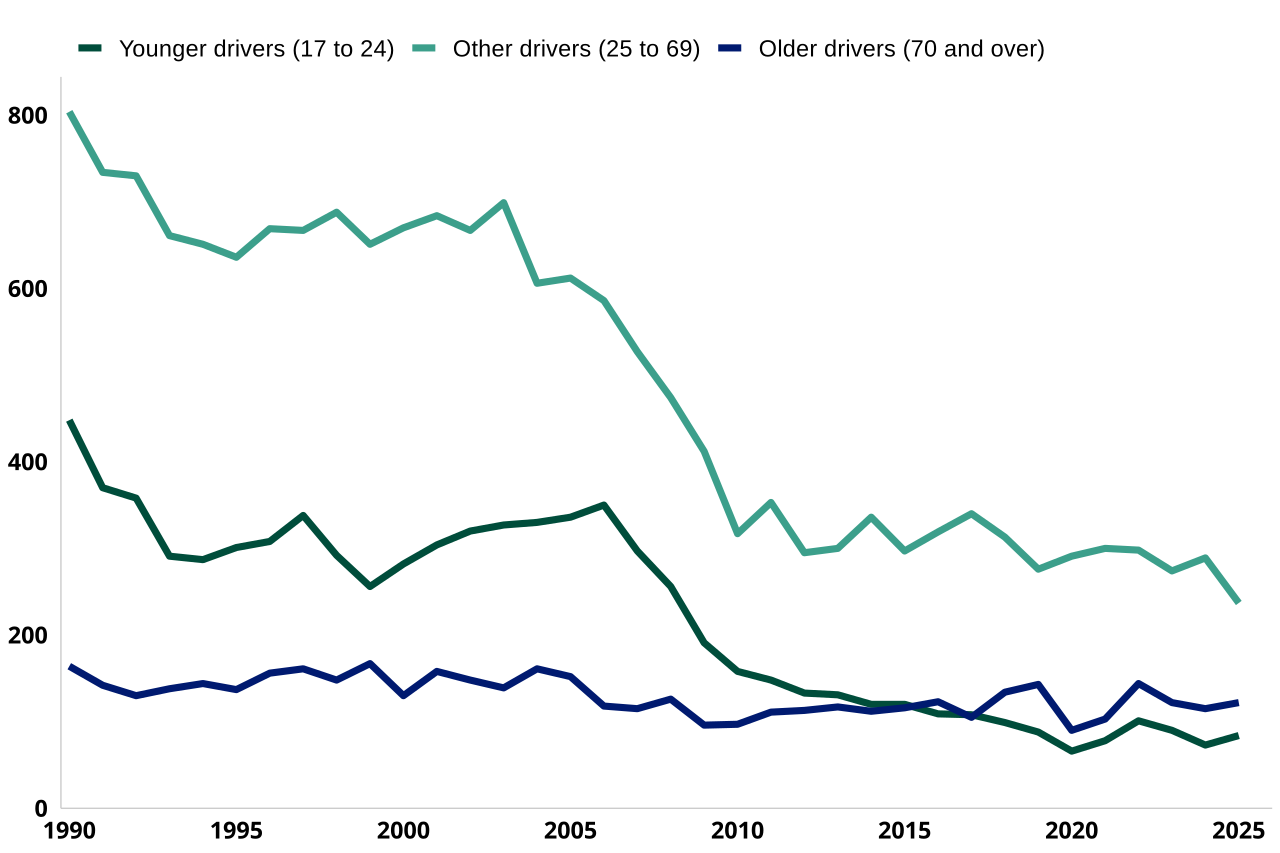
Chart 2 shows the number of car driver fatalities in each age group in years between 1990 and 2025.
Between 2004 and 2025:
-
KSI casualties among younger car drivers have decreased from 3,811 to 1,381, a decrease of 64%
-
KSI casualties among other car drivers aged 25 to 69 have decreased from 9,050 to 5,014, a decrease of 45%
-
KSI casualties among older car drivers have increased from 1,087 to 1,238, an increase of 14%
Between 1990 and 2025:
-
fatalities of younger car drivers have decreased from 448 to 84, a decrease of 81%
-
fatalities of other car drivers aged 25 to 69 have decreased from 804 to 237, a decrease of 71%
-
fatalities of older car drivers have decreased from 164 to 122, a decrease of 26%
These changes are likely to reflect a number of factors, including demographic changes, and the increase in the older drivers holding licences as shown in section 3.1.
Chart 1: Car driver KSI casualties by age group, Great Britain, 2004 to 2025
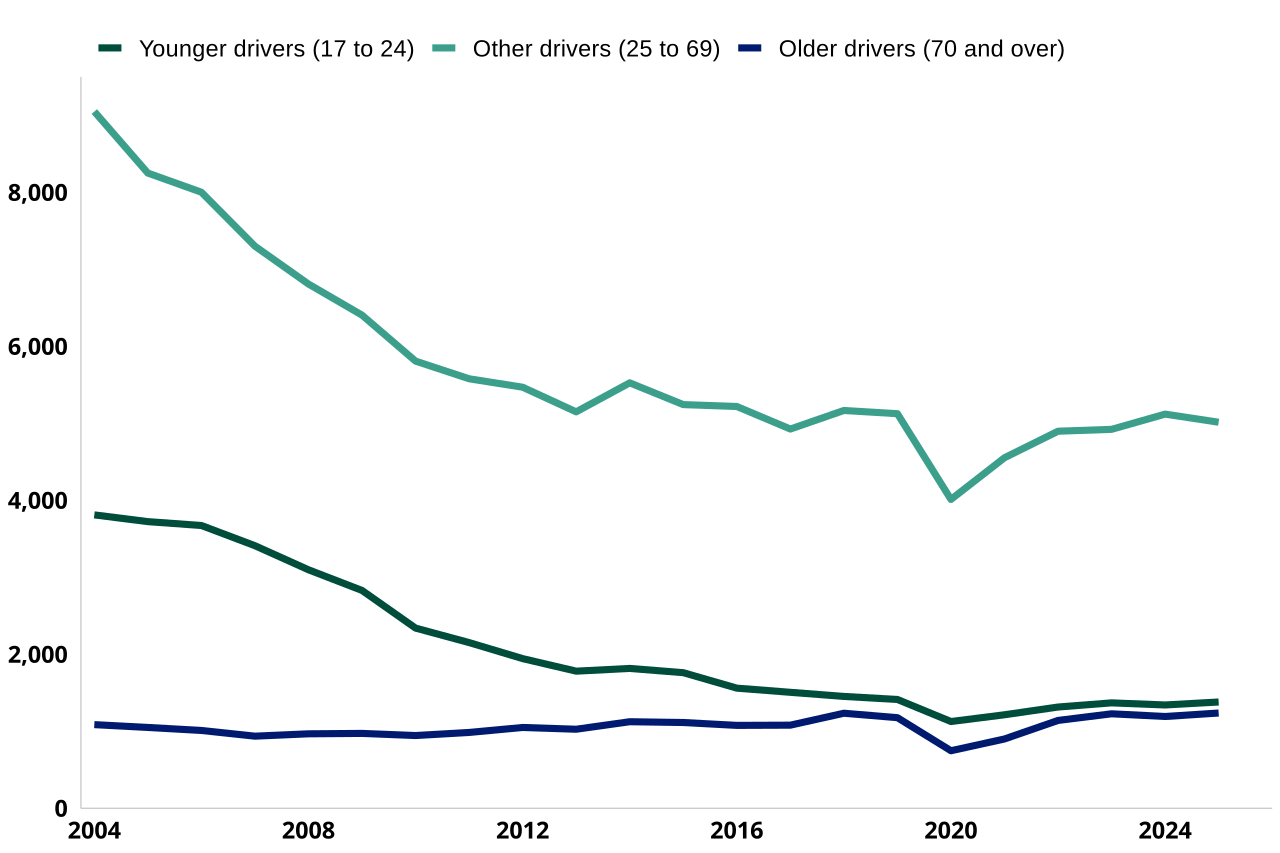
Chart 2: Car driver fatalities by age group, Great Britain, 1990 to 2025
3.3 Casualty severity
Table 2 compares reported car driver casualties in collisions by severity between 2004 and 2025.
Table 3 compares reported casualties in collisions involving at least one car driver from each age group between 2004 and 2025. In this table, casualties could be counted more than once as a collision could involve drivers of more than one age group.
Between 2004 and 2025:
-
27% of all car driver fatalities were older drivers in 2025, up from 15% in 2004
-
14% of KSI casualties from collisions involved an older driver in 2025, up from 7% in 2004
-
19% of all car driver fatalities were younger drivers in 2025, down from 30% in 2004. Yet, younger drivers are still over represented in 2025 as they hold only 6.3% of driving licences
-
20% of KSI casualties were in collisions involving a younger driver, down from 30% in 2004
Table 2: Car driver casualties by driver age group and severity, Great Britain, 2004 and 2025. Percentages show the distribution across driver age groups within each year and severity.
| Driver age group | Severity | 2004 | 2004 (%) | 2025 | 2025 (%) |
|---|---|---|---|---|---|
| Younger drivers (17 to 24) | Killed | 330 | 30 | 84 | 19 |
| Other drivers (25 to 69) | Killed | 606 | 55 | 237 | 53 |
| Older drivers (70 and over) | Killed | 161 | 15 | 122 | 27 |
| Younger drivers (17 to 24) | Serious | 3,481 | 27 | 1,297 | 18 |
| Other drivers (25 to 69) | Serious | 8,444 | 65 | 4,777 | 66 |
| Older drivers (70 and over) | Serious | 926 | 7 | 1,116 | 15 |
| Younger drivers (17 to 24) | Slight | 25,797 | 24 | 6,471 | 16 |
| Other drivers (25 to 69) | Slight | 76,289 | 71 | 29,616 | 74 |
| Older drivers (70 and over) | Slight | 4,425 | 4 | 3,406 | 9 |
Table 3: Casualties by severity, from collisions involving a car driver from each age group, Great Britain, 2004 and 2025. Percentages show the distribution across driver age groups within each year and severity. Percentages do not add to 100% because a collision may involve car drivers from more than one age group.
| Involving driver age group | Severity | 2004 | 2004 (%) | 2025 | 2025 (%) |
|---|---|---|---|---|---|
| Younger drivers (17 to 24) | Killed | 939 | 36 | 269 | 23 |
| Other drivers (25 to 69) | Killed | 1,771 | 68 | 813 | 70 |
| Older drivers (70 and over) | Killed | 305 | 12 | 232 | 20 |
| Younger drivers (17 to 24) | Serious | 10,946 | 29 | 4,466 | 19 |
| Other drivers (25 to 69) | Serious | 26,606 | 71 | 16,283 | 71 |
| Older drivers (70 and over) | Serious | 2,691 | 7 | 3,244 | 14 |
| Younger drivers (17 to 24) | Slight | 67,847 | 32 | 17,355 | 20 |
| Other drivers (25 to 69) | Slight | 167,559 | 78 | 65,057 | 74 |
| Older drivers (70 and over) | Slight | 14,086 | 7 | 9,916 | 11 |
4. Risk and exposure
This section examines casualty rates as they provide additional context because they account for differences in car driver age group sizes and how much those in each age group drive. Rates are derived using NTS data for miles and trips travelled by each age group and sex from 2024, found on the National Travel Survey 2024 webpage.
4.1 Absolute casualty counts
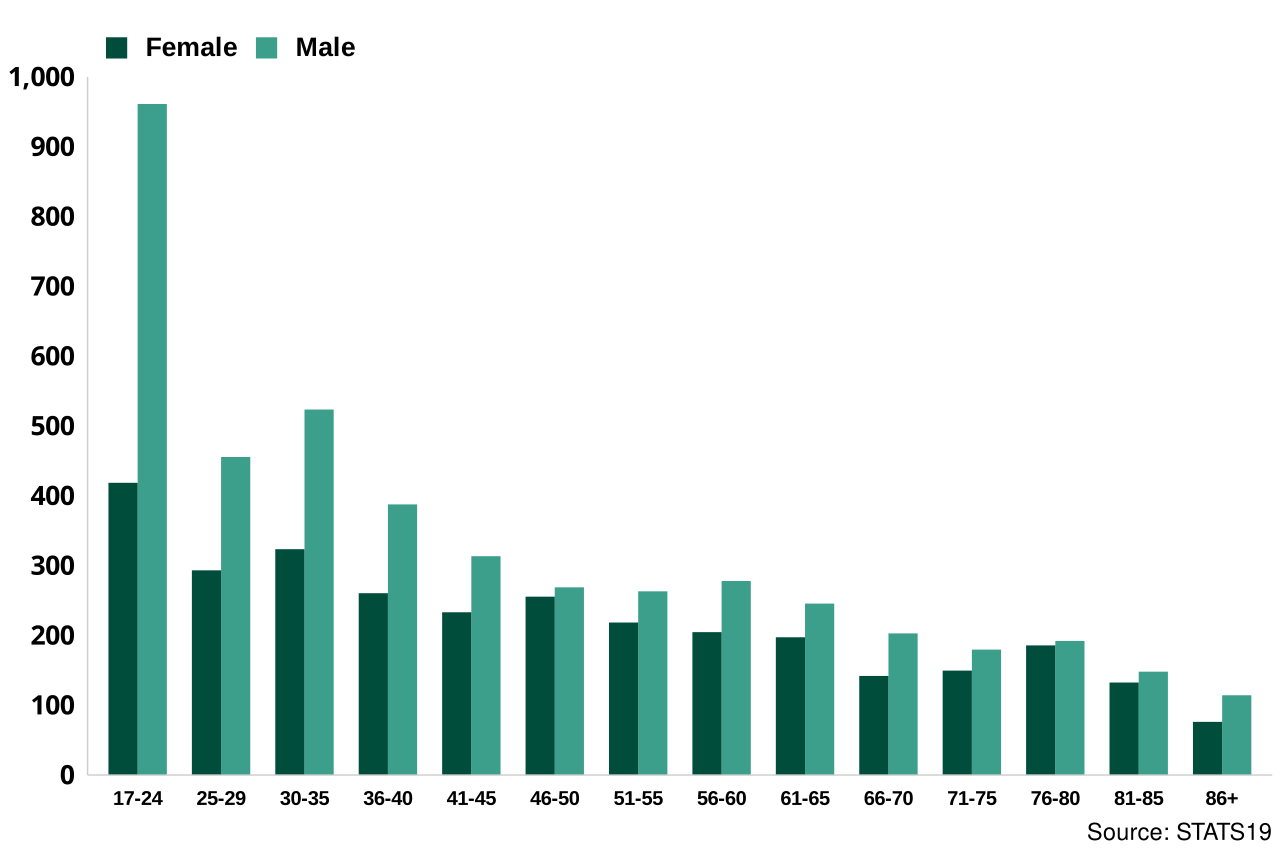
Chart 3 shows counts of car driver KSI casualties by age and sex.
- younger male drivers had the highest KSI casualty counts of all age groups, but this partly reflects the population size of each age groups
Chart 3: Absolute counts of KSI car driver casualties by age and sex, Great Britain, 2025
4.2 Casualty rates per billion miles travelled
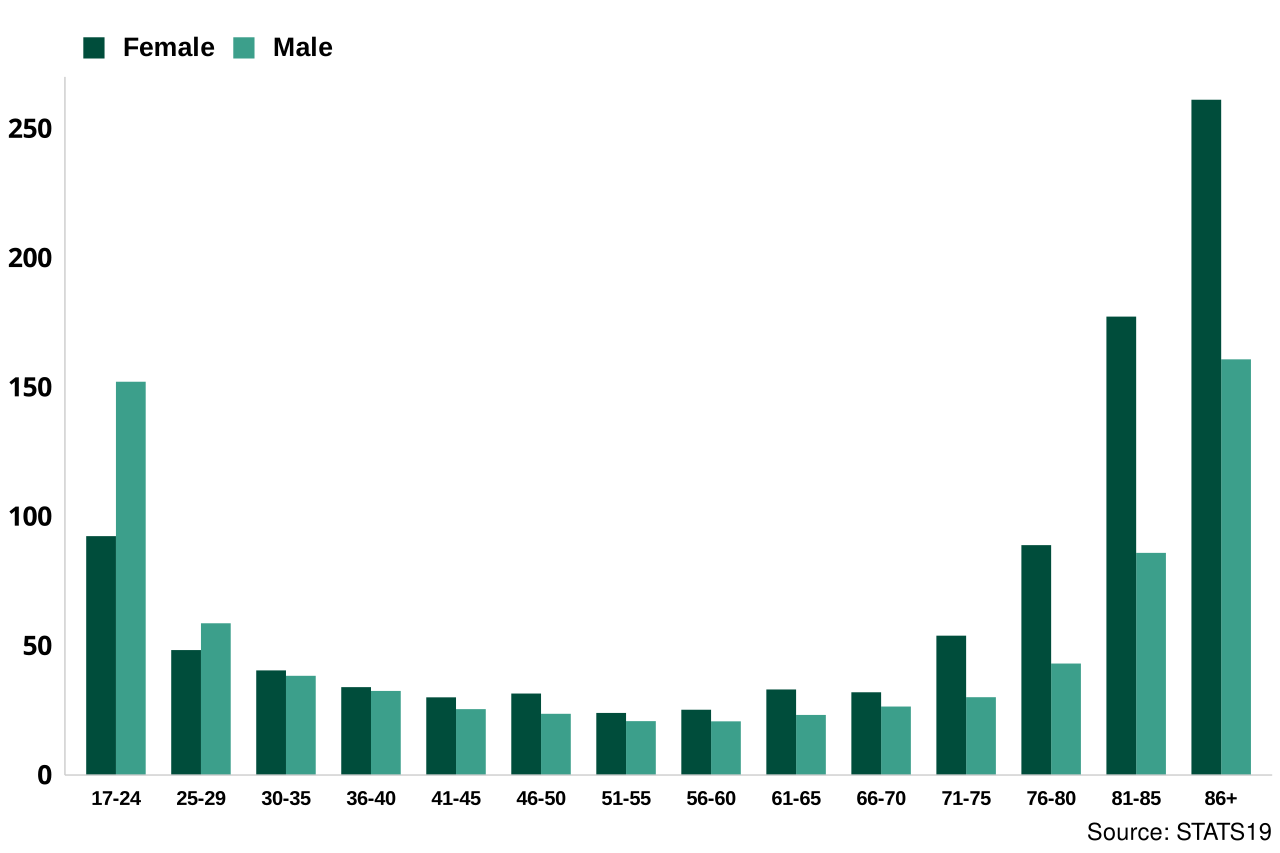
Chart 4 shows car driver KSI casualties per billion miles travelled by age and sex.
In 2025:
-
younger and older drivers had the highest KSI casualty rates per billion miles travelled of all age groups
-
younger male drivers and older female drivers had the highest KSI casualty rates per billion miles travelled
Chart 4: KSI car driver casualties per billion miles travelled by age and sex, Great Britain, 2025
4.3 Casualty rates per trip
Distance travelled and number of trips taken provide different measures of exposure as on average younger drivers travel more miles in each trip taken than older drivers.
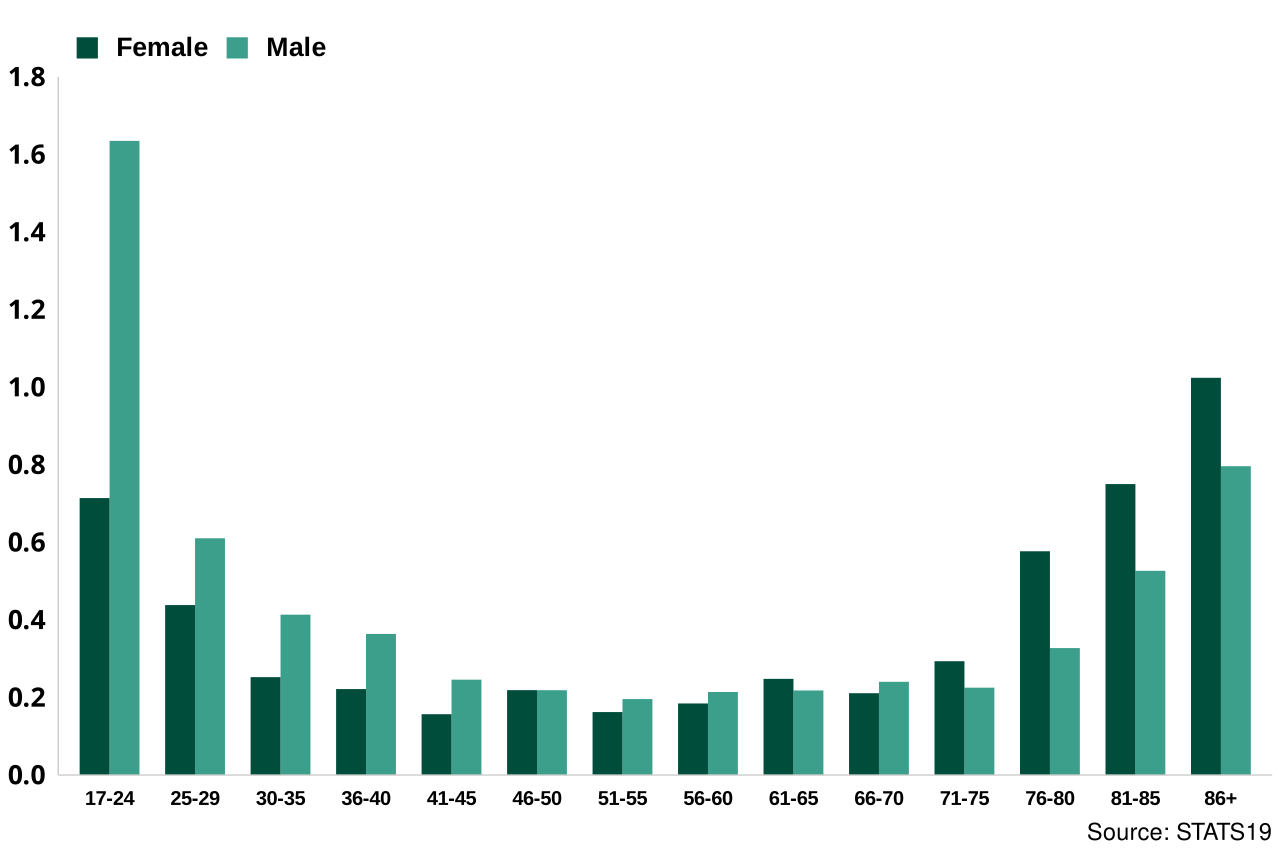
Chart 5 shows car driver KSI casualties per million trips taken by age and sex.
In 2025 this shows:
-
younger and older drivers had the highest KSI casualty rates per million trips
-
younger male drivers had the highest KSI casualty rate per million trips
Chart 5: KSI car driver casualties per million trips taken by age and sex, Great Britain, 2025
5. Casualty severity
This section examines casualty severity between drivers of different ages and the characteristics of casualties involved in collisions with drivers from different age groups.
5.1 Who is injured?
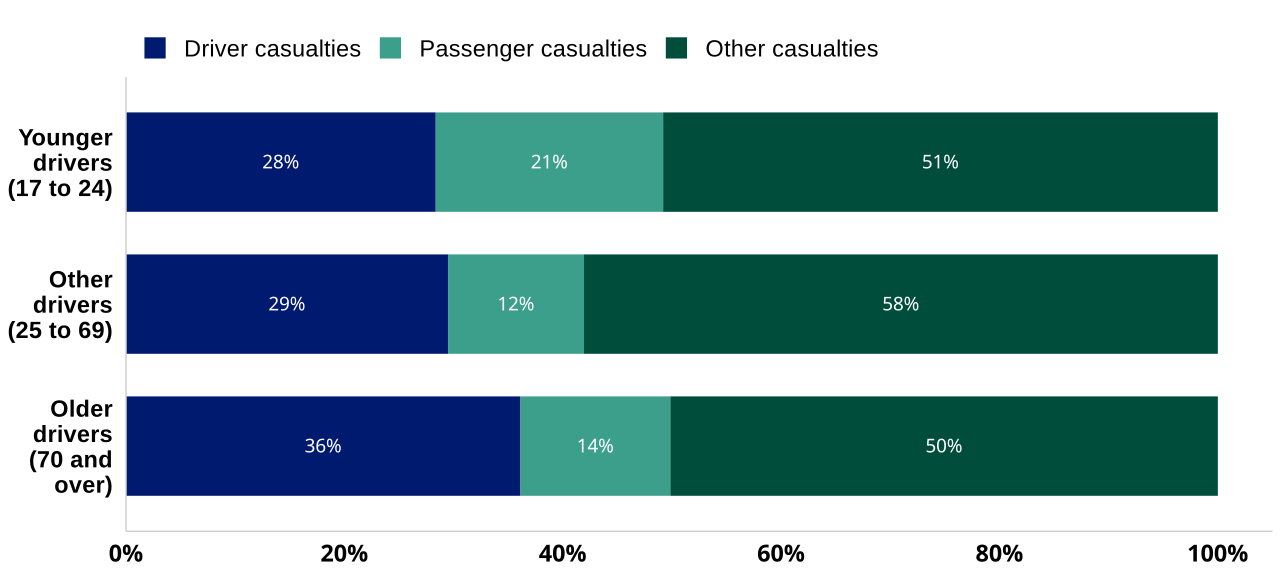
Chart 6 compares the distribution of KSI casualties in collisions involving at least one younger, other-aged or older car driver.
Casualties are classified as:
- Driver: a car driver in the relevant age group.
- Passenger: a passenger of any age travelling in the same car as a driver in the relevant age group
- Other: anyone else injured in the collision including drivers and passengers in other vehicles, pedestrians, cyclists and motorcyclists in a collision involving a car driver in the relevant age group
A collision may involve drivers from more than one age group. This means that the same collision may be included in more than one age group category.
Between 2021 and 2025:
-
passengers accounted for a larger proportion of KSI casualties in collisions involving younger drivers (21%) than in collisions involving other drivers aged 25 to 69 (12%)
-
older drivers accounted for 36% of KSI casualties in collisions involving an older driver, a larger proportion than the equivalent figures for the other driver age groups
Chart 6: Proportion of KSI casualties by casualty type and age group of driver involved, Great Britain, 2021 to 2025
5.2 Younger car driver passenger age breakdown
Table 4 shows the age distribution of passengers killed or seriously injured (KSI) while travelling in cars driven by younger drivers aged 17 to 24.
Between 2021 and 2025:
- passengers aged 16 to 24 made up 85% of passenger fatalities and 81% of passenger KSI casualties in cars driven by younger drivers
Table 4: Distribution of passengers killed or seriously injured while travelling in cars driven by younger drivers, by passenger age, Great Britain, 2021 to 2025
| Passenger age group | Fatalities | Fatalities % | KSI | KSI % |
|---|---|---|---|---|
| Aged 0 to 15 | 12 | 4.5 | 176 | 5.5 |
| Aged 16 to 24 | 225 | 84.6 | 2,590 | 81.3 |
| Aged 25 to 49 | 24 | 9.0 | 321 | 10.1 |
| Aged 50 to 69 | 3 | 1.1 | 85 | 2.7 |
| Aged 70 and over | 2 | 0.8 | 15 | 0.5 |
6. Demographics
This section examines the sex, age and deprivation profile of casualties in collisions involving younger and older drivers.
6.1 Sex and age
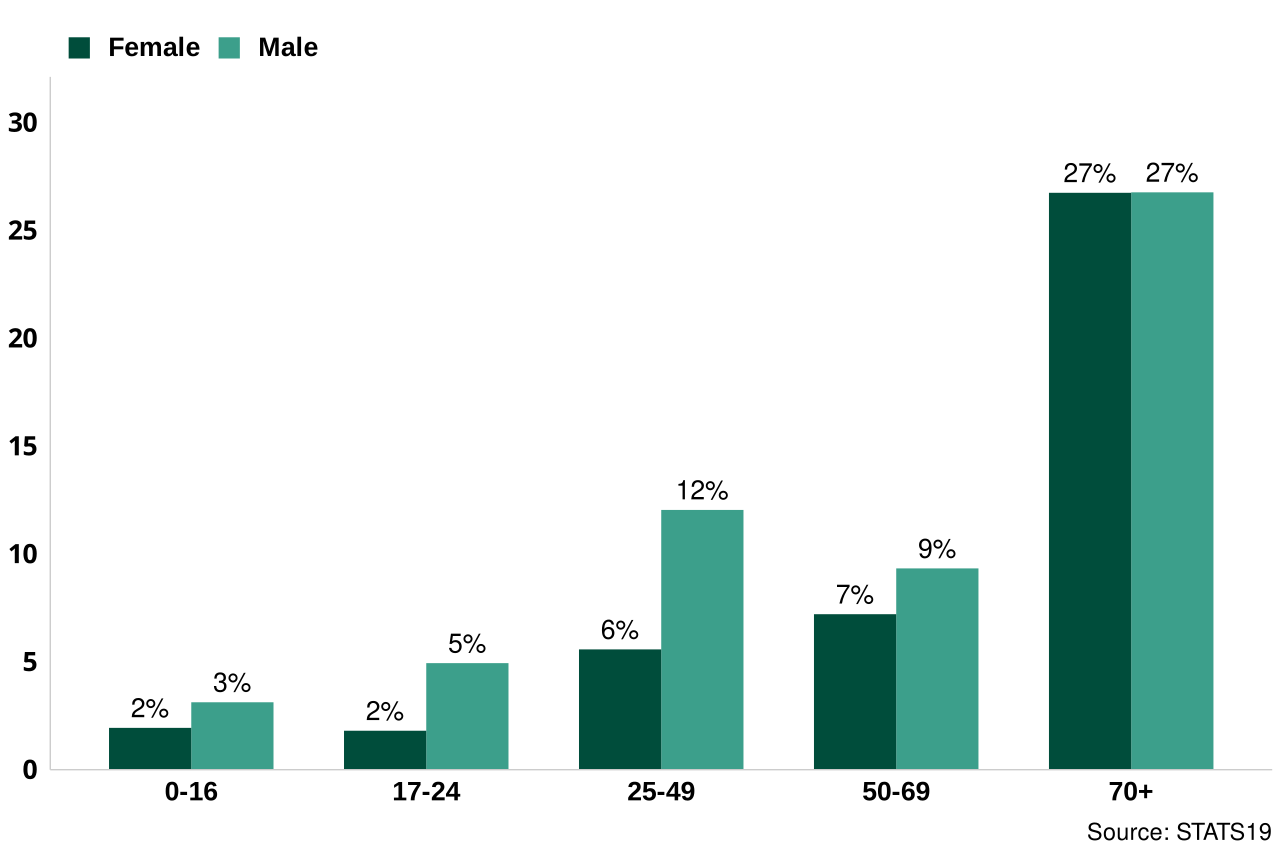
Charts 7 and 8 compare the distribution of KSI casualties by sex and age in collisions involving younger and older car drivers between 2021 and 2025.
Between 2021 and 2025:
-
half of KSI casualties in collisions involving younger car drivers were aged 17 to 24, with younger men accounting for a particularly large share (33%)
-
over half of KSI casualties were aged 70 or over in collisions involving an older car driver, divided almost equally between men and women
Chart 7: Percentage of KSI casualties by sex and age in collisions involving a younger car driver, Great Britain, 2021 to 2025
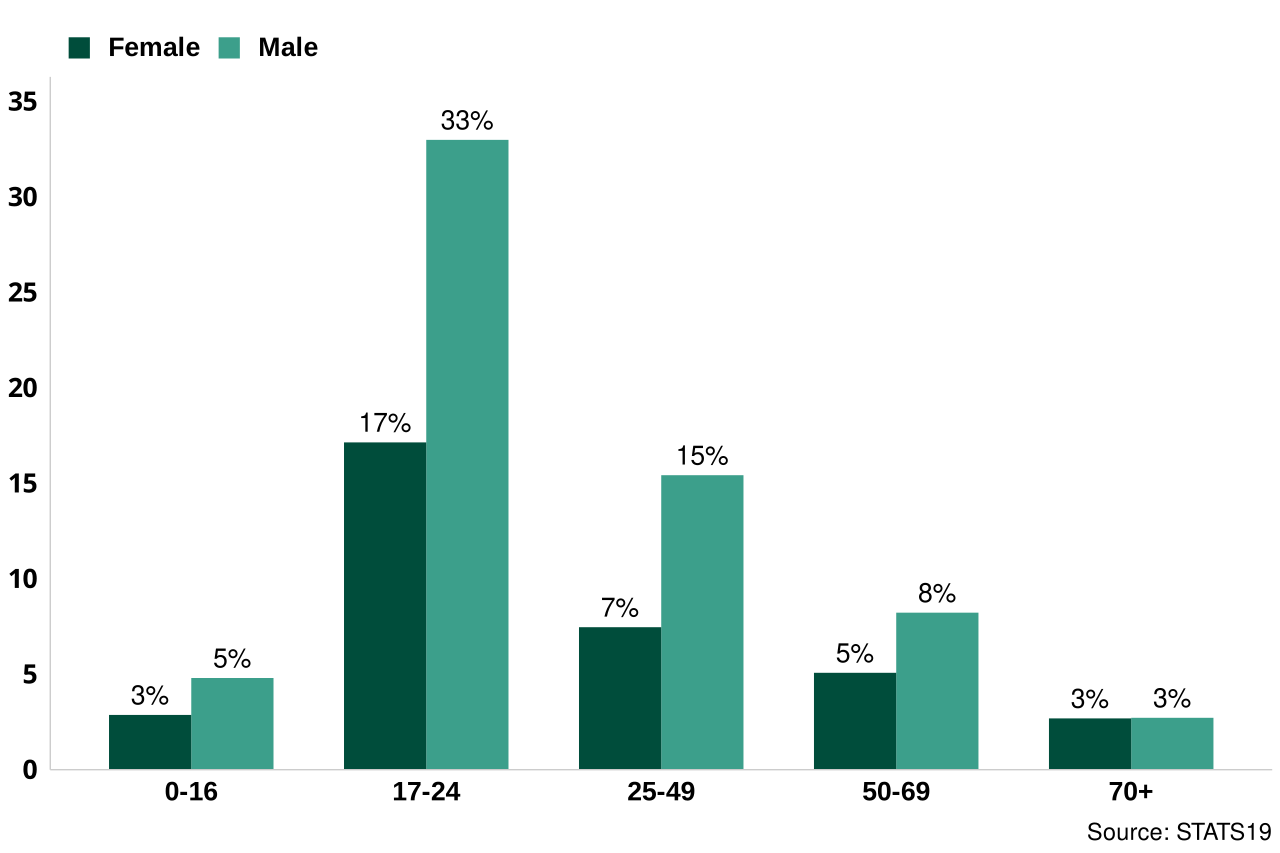
Chart 8: Percentage of KSI casualties by sex and age in collisions involving an older car driver, Great Britain, 2021 to 2025
6.2 Indices of multiple deprivation (IMD)
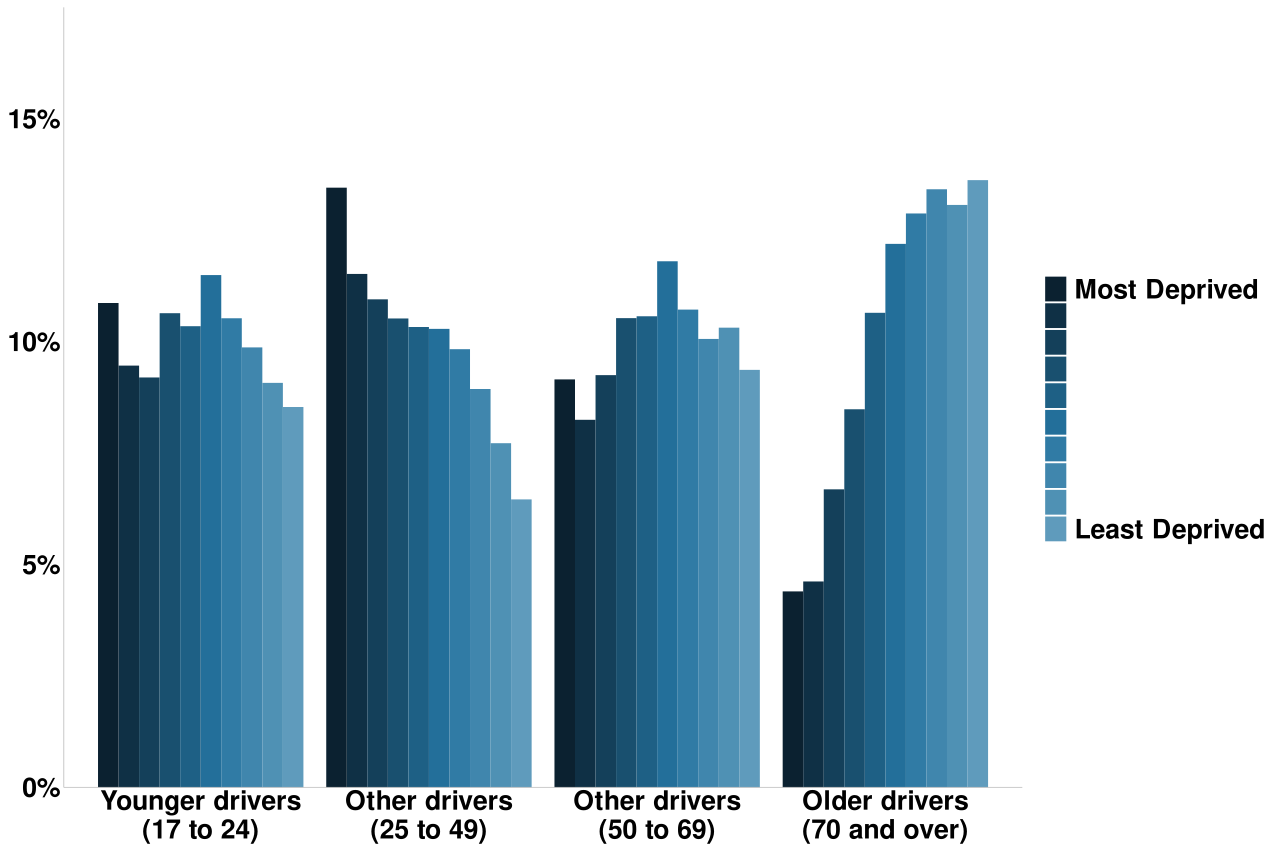
Chart 9 shows the proportion of car driver KSI casualties ordered in deciles of deprivation of casualty residence.
Between 2021 and 2025:
-
for older drivers (70 and over), there was a smaller proportion KSI casualties among car drivers from the most deprived deciles, and a larger proportion among car drivers from the least deprived deciles
-
for younger drivers and other aged drivers both 25 to 49 and 50 to 69 the proportion of KSI casualties among drivers from each decile is largely the same
Chart 9: Car driver KSI casualties by age group and IMD decile of the casualty’s home postcode, England, 2021 to 2025
7. Collision circumstances
This section examines the distribution of KSI casualties involving drivers in each age group by distance from home, time of day, road type, proximity to junctions and whether the collision involved a single vehicle or multiple vehicles.
7.1 Distance from home
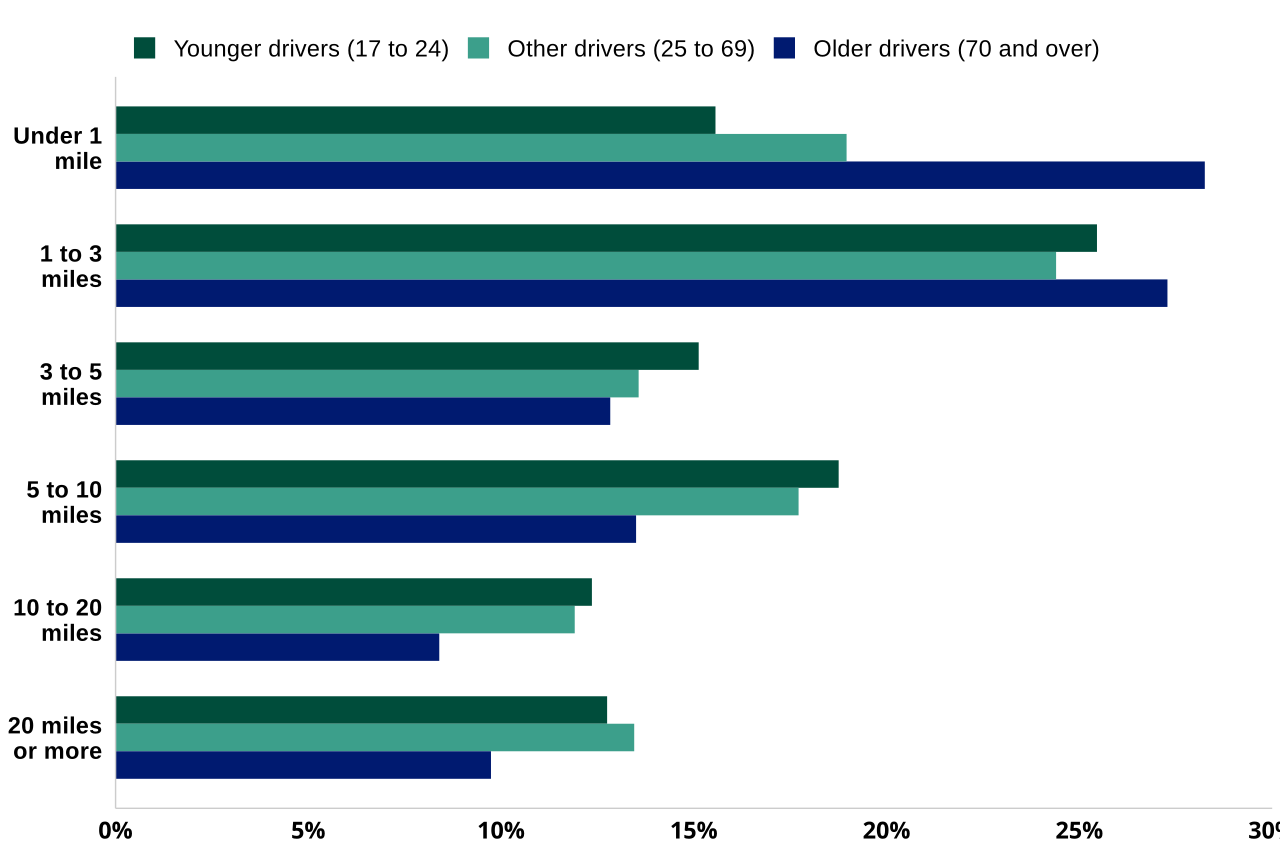
Chart 10 shows the distribution of car driver KSI casualties by the distance between the collision location and the driver’s home postcode.
Between 2021 and 2025:
- older-driver KSI casualties were more concentrated close to home, with 56% occurring within 3 miles, compared with approximately 40% among other aged car drivers
Chart 10: Driver KSI casualties by distance from home and driver age group, Great Britain, 2021 to 2025
7.2 Time of day
Chart 11 shows the distribution of car driver KSI casualties in each age group by time of day
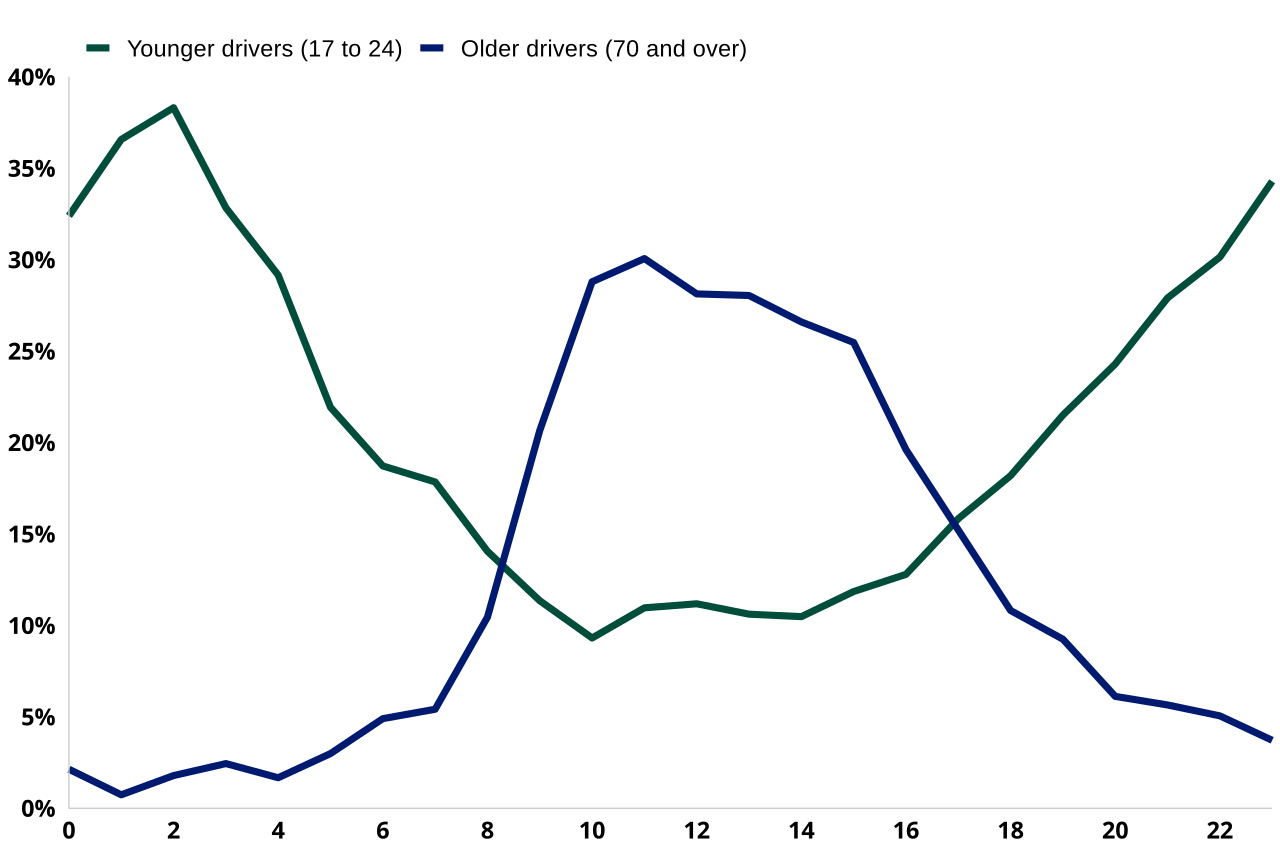
Chart 12 shows the proportion of car driver KSI casualties at each hour of the day that belong to younger and older drivers.
Between 2021 and 2025:
-
younger driver KSI casualties were concentrated later in the day and into the evening, while older-driver casualties were concentrated around midday and the afternoon
-
younger drivers were particularly over-represented during the late evening and early morning, accounting for a peak of 38% of car driver KSI casualties at 2am
Chart 11: Distribution of reported KSI casualties among car drivers in age group by time of the day, Great Britain, 2021 to 2025.
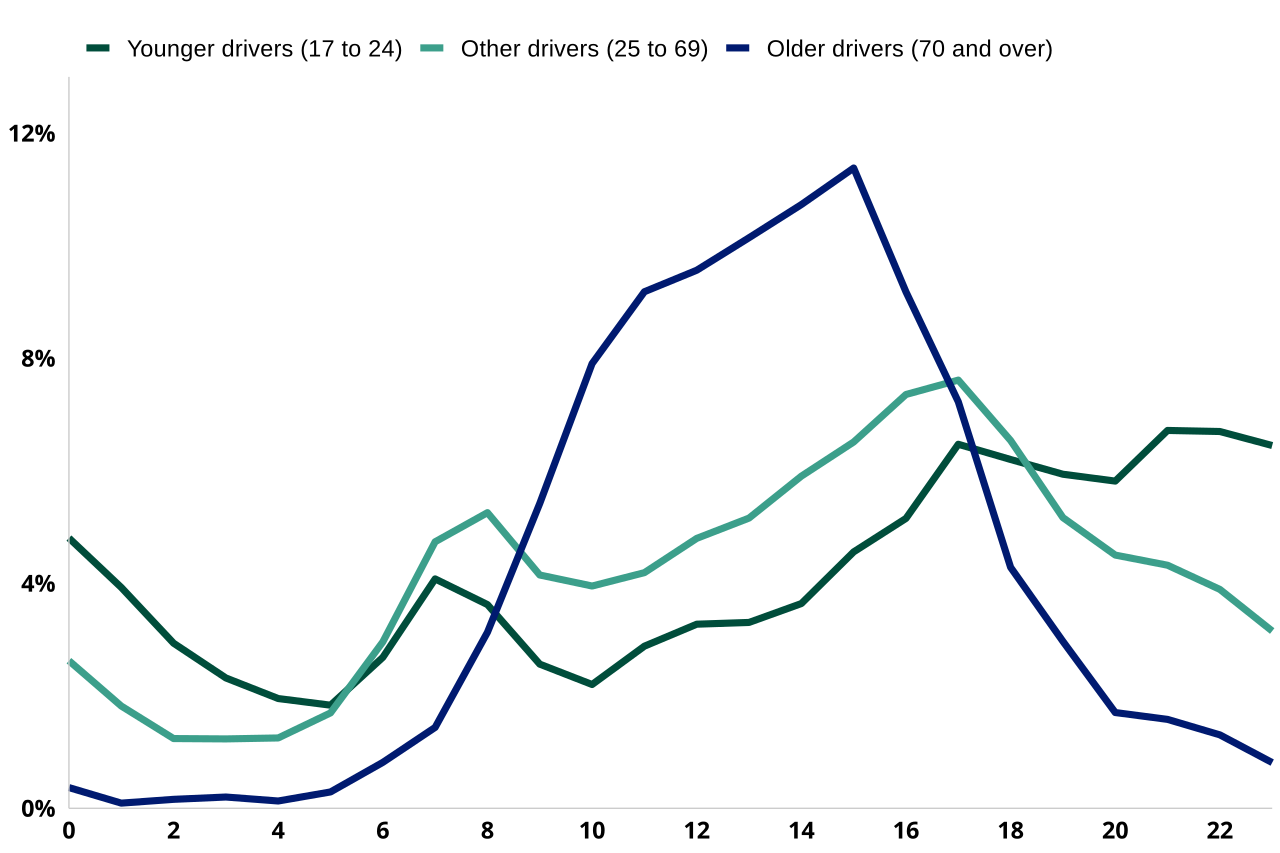
Chart 12: Percentage of reported KSI casualties at each hour of the day that belong to younger and older car drivers, Great Britain, 2021 to 2025.
7.3 Road type
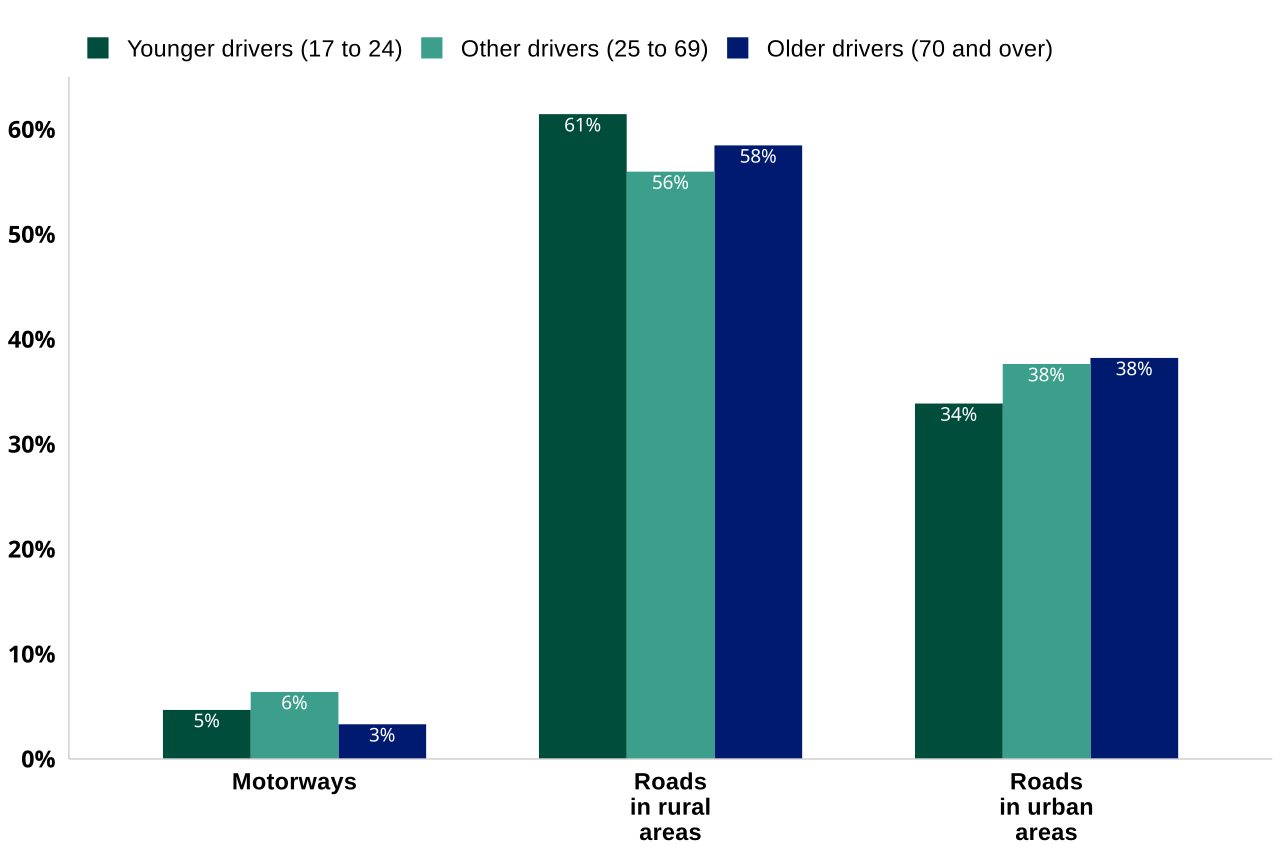
Chart 13 shows car driver KSI casualties in each age group by broad road category.
Between 2021 and 2025:
-
KSI casualties were concentrated on rural roads across all age groups, particularly among younger drivers
-
motorways accounted for only a small share of KSI casualties in every age group
Chart 13: Percentage of KSI casualties by road type and driver age group, Great Britain, 2021 to 2025
7.4 Junction context
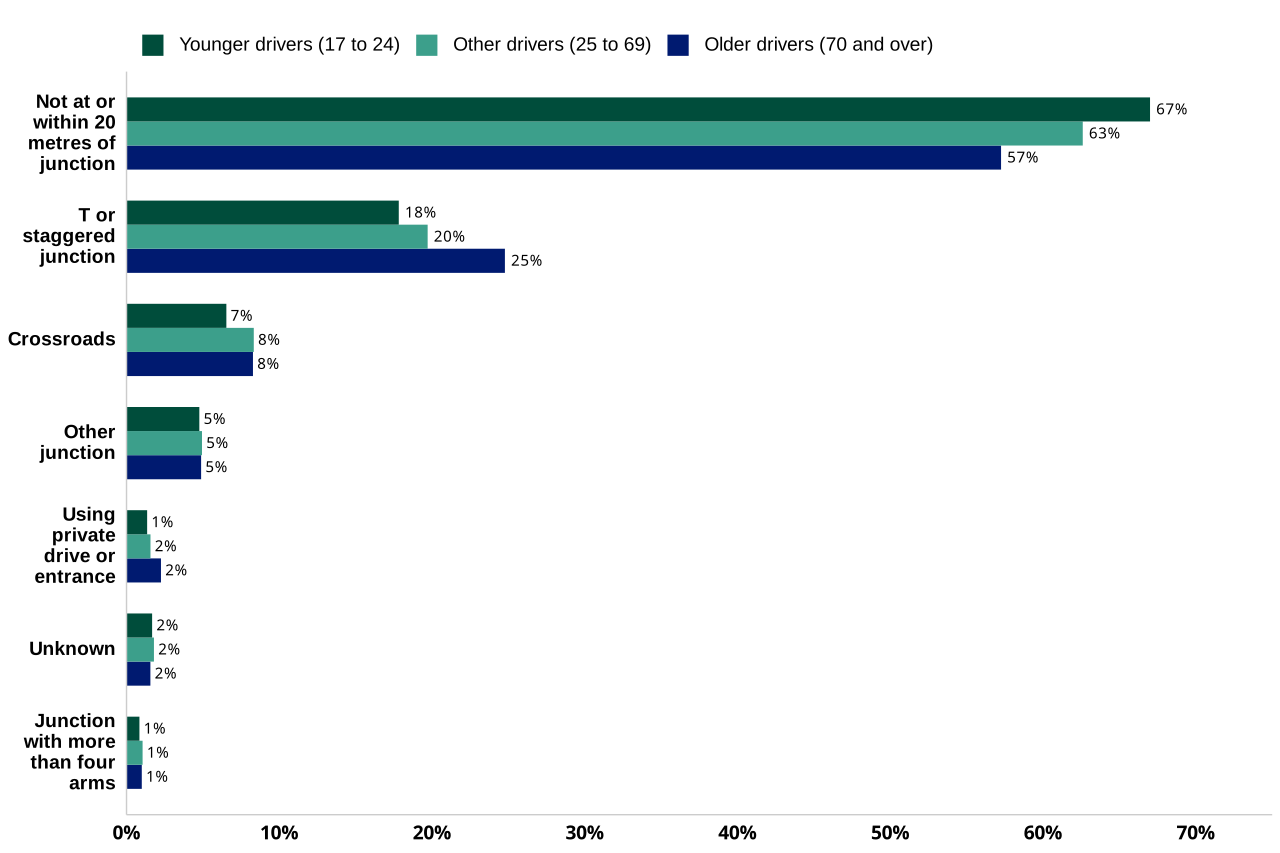
Chart 14 displays the percentage of KSI casualties of car drivers of each age group from collisions occurring at different junction types.
Between 2021 and 2025:
-
a higher proportion of KSI casualties among older car drivers occurred in collisions at T or staggered junctions than among other aged car drivers
-
a lower proportion of KSI casualties among older car drivers occurred in collisions not at or within 20 metres of a junction than among other aged car drivers
Chart 14: Percentage of KSI casualties among car drivers from each age group by junction detail where the collision occurred, Great Britain: 2021 to 2025
7.5 Single-car collisions
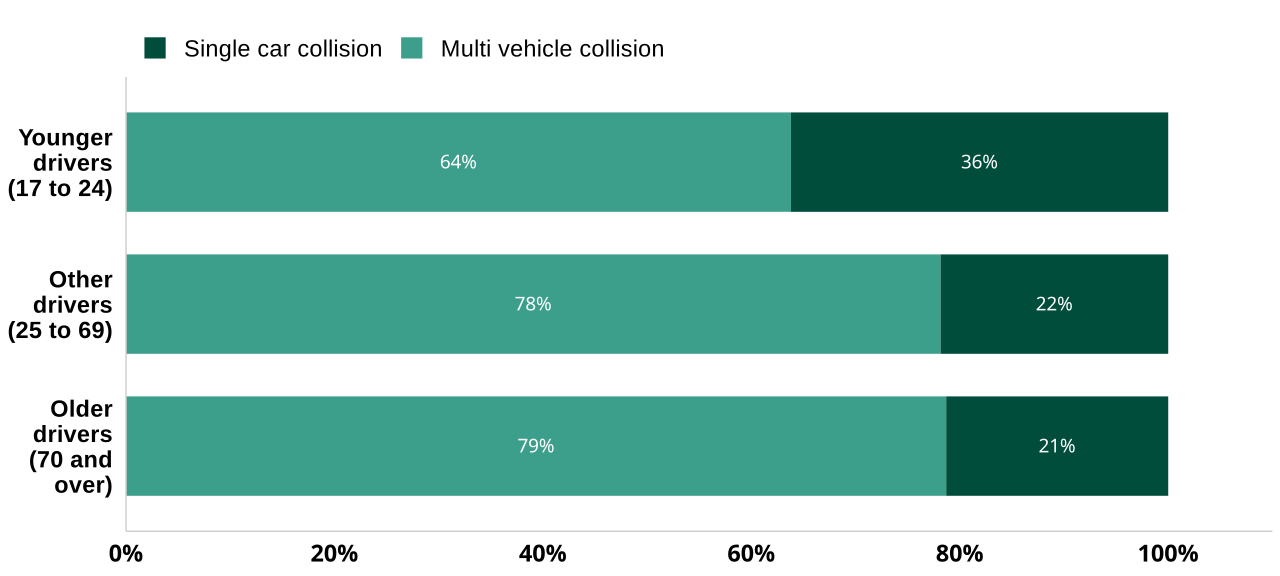
Chart 15 shows the proportion of car driver KSI casualties in each age group from single-car and multi-vehicle collisions.
Between 2021 and 2025:
- single-car collisions made up a larger share (36%) of younger car driver KSI casualties than those of older (21%) or other-aged drivers (22%)
Chart 15: Proportion of KSI car driver casualties from each age group from single and multi vehicle collisions, Great Britain, 2021 to 2025
8. Factors contributing
This section examines factors associated with the severity of car driver casualties and compares police-reported contributory factors, including how and why collisions occurred, between younger and older drivers.
8.1 Seatbelt non-wearing
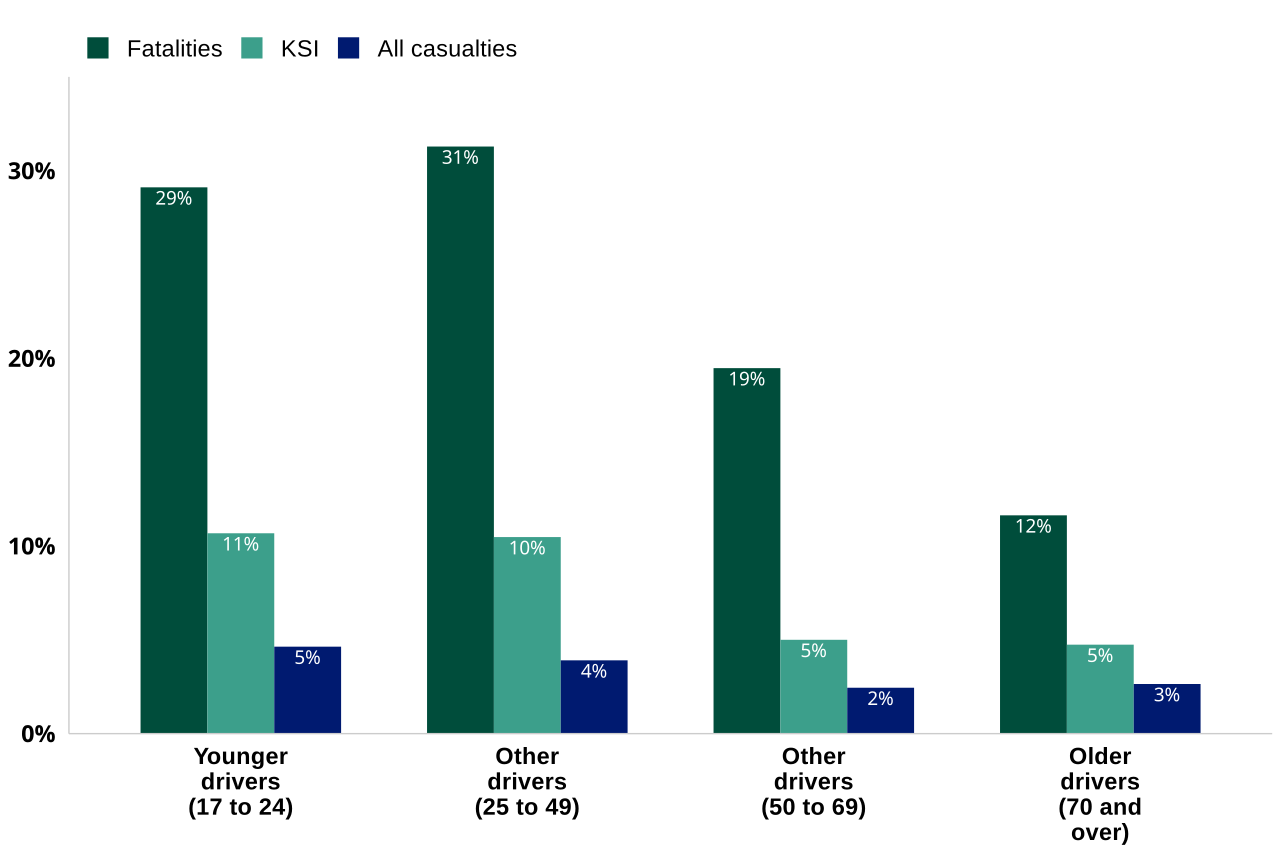
Chart 16 compares seatbelt nonwearing rates among all car driver casualties, KSI casualties and fatalities in the different driver age groups.
Between 2021 and 2025:
- younger car driver casualties were more likely than older drivers to be recorded as not wearing a seatbelt, particularly among fatalities, at 29% compared with 12%
Chart 16: Percentage of car drivers not wearing a seatbelt, among KSI casualties, fatalities and all casualties with known seatbelt status, by age group, Great Britain, 2021 to 2025
8.2 Road safety factors
Road safety factors (RSFs) provide insight into how and why collisions occur. The factors are largely subjective as they reflect the opinion of the reporting police officer. They may be assigned shortly after a collision and often without the benefit of an extensive investigation and so should be interpreted with caution. They are likely to be affected in part by preconceptions police officers have of certain vehicle groups. A maximum of 6 factors can be recorded for each collision. A full guide can be found in the guide to contributory factors for reported road casualty statistics.
Which RSFs are most common in each age group?
Table 5 shows the most common RSFs assigned in fatal or serious collisions (FSCs) to the car drivers by age group, for 2024 to 2025.
Between 2024 and 2025:
-
ineffective observation was the most frequently assigned road safety factor in every age group. It was assigned to 42% of older drivers, 30% of other car drivers aged 25 to 69 and 31% of younger car drivers
-
poor turns or manoeuvres were also common across all age groups, particularly among older drivers, at 22%
-
factors involving speed were more common among younger drivers: 19% were assigned travelling too fast for conditions and 21% were assigned exceeding the speed limit
-
illness or disability showed the clearest difference in prevalence for older drivers. It was assigned to 16% of older drivers, compared with 3% of drivers aged 25 to 69 and 1% of younger drivers
-
the prevalence of being affected by alcohol or drugs was much lower among older drivers (1% and 0.3% respectively) than among younger drivers (8% and 7%) and other drivers (6% and 4%)
Table 5: Percentage of car drivers in FSCs with specific most common road safety factors assigned by age group, Great Britain: 2024 to 2025
| Road safety factor | Younger drivers (17 to 24) (%) | Other drivers (25 to 69) (%) | Older drivers (70 and over) (%) |
|---|---|---|---|
| Ineffective observation | 31.4 | 30.4 | 41.8 |
| Overshot junction or poor turn or manoeuvre | 16.5 | 12.9 | 22.4 |
| Travelling too fast for conditions | 18.7 | 7.9 | 7.4 |
| Inexperienced or learner driver | 15.6 | 2.1 | 0.9 |
| Exceeding the speed limit | 20.6 | 8.0 | 3.0 |
| Illness or disability | 1.1 | 2.8 | 15.6 |
| Aggressive, dangerous or reckless driving | 16.5 | 7.6 | 4.3 |
| Driver distraction | 9.2 | 7.8 | 9.8 |
| Road surface was slippery due to weather | 9.0 | 5.0 | 3.7 |
| Affected by alcohol | 8.0 | 6.0 | 1.2 |
| Sudden braking or braking in a way unsuitable for conditions | 4.5 | 3.3 | 2.3 |
| Vision affected by weather or dazzling sun | 2.9 | 3.6 | 5.9 |
| Affected by drugs | 6.5 | 3.7 | 0.3 |
| Uncorrected or defective eyesight | 0.1 | 0.3 | 4.6 |
| Too tired to drive safely | 1.7 | 2.4 | 3.8 |
| Vehicle used in the course of crime | 2.4 | 0.8 | 0.0 |
| Using mobile device | 1.8 | 1.2 | 0.4 |
Which RSFs are particularly associated with younger or older drivers?
Table 6: Shows the RSFs that are a lot more likely to be assigned to either younger or older car drivers compared to other aged car drivers (25 to 69).
Note: An index above 1 indicates that the factor was more commonly assigned to the specified age group than to drivers aged 25 to 69. For example, an index of 1.8 means that the factor was 1.8 times as common. The table excludes factors assigned to less than 1% of the specified age group.
Between 2024 and 2025:
-
inexperience was the factor most strongly associated with younger drivers. Younger car drivers were 7.5 times as likely as other car drivers aged 25 to 69 to be assigned this factor, with rates of 16% and 2% respectively
-
younger car drivers were also around 2.6 times as likely to be assigned exceeding the speed limit or travelling too fast for conditions. Aggressive, dangerous or reckless driving was around 2.2 times as common among younger drivers
-
uncorrected or defective eyesight had the highest index for older car drivers. Older car drivers were 15 times as likely as car drivers aged 25 to 69 to be assigned this factor, although it was assigned to only 5% of older drivers
-
illness or disability was both relatively common and strongly associated with older drivers: it was assigned to 16% of older drivers, 5.6 times the percentage for drivers aged 25 to 69
Table 6: Index of how much more likely younger or older car drivers in FSCs are to be assigned specific road safety factors than other car drivers, Great Britain: 2024 to 2025
| Age group | Road safety factor | Age group (%) | Other drivers (25 to 69) (%) | Index |
|---|---|---|---|---|
| Younger drivers (17 to 24) | Inexperienced or learner driver | 15.6 | 2.1 | 7.5 |
| Younger drivers (17 to 24) | Vehicle used in the course of crime | 2.4 | 0.8 | 3.2 |
| Younger drivers (17 to 24) | Exceeding the speed limit | 20.6 | 8.0 | 2.6 |
| Younger drivers (17 to 24) | Travelling too fast for conditions | 18.7 | 7.9 | 2.4 |
| Younger drivers (17 to 24) | Aggressive, dangerous or reckless driving | 16.5 | 7.6 | 2.2 |
| Older drivers (70 and over) | Uncorrected or defective eyesight | 4.6 | 0.3 | 15.0 |
| Older drivers (70 and over) | Illness or disability | 15.6 | 2.8 | 5.6 |
| Older drivers (70 and over) | Too tired to drive safely | 3.8 | 2.4 | 1.6 |
| Older drivers (70 and over) | Vision affected by weather or dazzling sun | 5.9 | 3.6 | 1.6 |
| Older drivers (70 and over) | Overshot junction or poor turn or manoeuvre | 22.4 | 12.9 | 1.7 |
Further information
Further information on road collisions and casualties can be found in Reported Road Casualties in Great Britain.
Published tables on casualties in reported road collisions are available.
Non-fatal casualties since 2016 have been affected by a large number of police forces changing their reporting systems which has had a large impact on the classification of injuries recorded. Further details of the adjustment for this are in the 2025 annual report.
Road collisions and safety statistics guidance including accompanying notes and definitions are available.
Personal travel statistics within Great Britain covering English residents, including mileage by car drivers of different ages, is available from the National Travel Survey.
About this data
Detailed information about the data used in this chapter, including its strengths and limitations, can be found in the guidance pages.
STATS19 data
The statistics in this publication are based on data collected through the STATS19 system, which records personal injury road collisions on public roads in Great Britain. STATS19 data are reported to the Department for Transport by police forces using a common national specification, allowing consistent analysis across time and geography. All collisions reported by the police within 30 days and that occurred on a public highway involving at least one motor vehicle, horse rider or pedal cyclist, and where at least one person was injured, are included in these statistics.
STATS19 is the primary source used to understand long-term trends in road collisions and casualties, and to monitor and evaluate road safety policies and interventions. Its standardised approach enables comparison at local, regional and national level, and provides a long-running time series underpinning road safety analysis.
There is no obligation for people to report all personal injury collisions to the police, and not all collisions are reported to the police, particularly those involving only slight injuries, meaning some types of incidents are under recorded. Therefore these figures do not represent the full range of collisions or casualties in Great Britain.
The quality and completeness of the data can also vary, especially for variables based on officer judgement at the scene. Changes to data collection systems, guidance or reporting practices over time may also affect comparability of trends. For example, recent updates to the STATS19 specification (including the introduction of new variables) may lead to discontinuities in some data series.
Injury severity reporting
The figures in this release for injured casualties are based on adjusting figures reported by the police to take account of changes in the reporting of injury severity by some police forces in recent years. These adjusted figures can reliably be used to compare trends over time across the country. More details can be found in our severity adjustments guidance.
Instructions for printing and saving
Depending on which browser you use and the type of device you use (such as a mobile or laptop) these instructions may vary.
Tablets and mobile devices normally have the option to “find in text” and “print or save” in their sharing or quick options menu of their browser, but this will vary by device model.
How to search
Select Ctrl and F on a Windows laptop or Command and F on a Mac
This will open a search box in the top right-hand corner of the page. Type the word you are looking for in the search bar and press enter.
Your browser will highlight the word, usually in yellow, wherever it appears on the page. Press enter to move to the next place it appears.
Contact details
Road safety statistics
Email roadacc.stats@dft.gov.uk
To hear more about DfT statistical publications as they are released, follow us on X (formerly known as Twitter) at DfTstats.