Quarterly bus statistics: July to September 2020
Published 16 December 2020

© Crown copyright 2020
This publication is licensed under the terms of the Open Government Licence v3.0 except where otherwise stated. To view this licence, visit nationalarchives.gov.uk/doc/open-government-licence/version/3 or write to the Information Policy Team, The National Archives, Kew, London TW9 4DU, or email: psi@nationalarchives.gov.uk.
Where we have identified any third party copyright information you will need to obtain permission from the copyright holders concerned.
This publication is available at https://www.gov.uk/government/statistics/quarterly-bus-statistics-july-to-september-2020/quarterly-bus-statistics-july-to-september-2020
The number of local bus passenger journeys in England was 2.66 billion in the year ending September 2020, a 38% decrease when compared with a year earlier.
In the year to September 2020, local bus fares in England increased by 1.6%, faster than the all items Consumer Prices Index rate of inflation (0.5%). Part of this change reflects changes in eligibility for free travel.
Latest quarterly and year ending local bus passenger journeys (seasonally adjusted), Great Britain
| Local bus journeys (billions) | |||||
|---|---|---|---|---|---|
| Percentage change from… | Last year | Last quarter | |||
| Year ending | Sep 2020 | Sep 2019 | Jul-Sep 2020 | Jul-Sep 2019 | |
| London | 1.35 | -38% | 0.23 | -57% | |
| English metropolitan areas | 0.57 | -37% | 0.11 | -50% | |
| English non-metropolitan areas | 0.74 | -39% | 0.13 | -57% | |
| England | 2.66 | -38% | 0.48 | -55% | |
| England outside London | 1.31 | -38% | 0.24 | -54% | |
| Scotland | 0.23 | -40% | 0.04 | -59% | |
| Wales | 0.06 | -44% | 0.01 | -69% | |
| Great Britain | 2.95 | -38% | 0.52 | -56% |
Local Bus Fares index change from September 2019, Great Britain
| Bus Fares Index | |
|---|---|
| Sep-2020 | |
| (compared with Sep-2019) | |
| London | 0.0% |
| English metropolitan areas | 2.3% |
| English non-metropolitan areas | 2.7% |
| England | 1.6% |
| England outside London | 2.6% |
| Scotland | 2.1% |
| Wales | 1.1% |
| Great Britain | 1.6% |
Comment on Coronavirus (COVID-19) impact
This publication covers data for the year ending July to September 2020, which coincides with the application of movement restrictions due to COVID-19 in Great Britain.
An indication of changes in bus passenger volume during this period can be found in separate datasets provided to monitor the use of the transport system during the COVID-19 Pandemic. Figures are available throughout the period for Great Britain excluding London. Figures for London are available for March to mid-April and from early June. These figures are derived from a different source to this publication, but they indicate usage trends that are broadly in line with the quarterly passenger data.
The release published by Transport for London (TfL) provides additional information on bus services during this period.
Local bus passenger journeys
The year ending September 2020 included around six months during which movement restrictions had been implemented due to COVID-19. Chart 1 shows that the number of local bus passenger journeys in England outside London in the year ending September 2020 decreased by almost 804 million (38%) compared with the previous year, to 1.31 billion. Bus use in London decreased by 834 million passenger journeys (38%) to 1.35 billion.
Chart 1: Local bus passenger journeys (seasonally adjusted) in England outside London and London, year ending September 2005 to year ending September 2020 - table BUS0106a
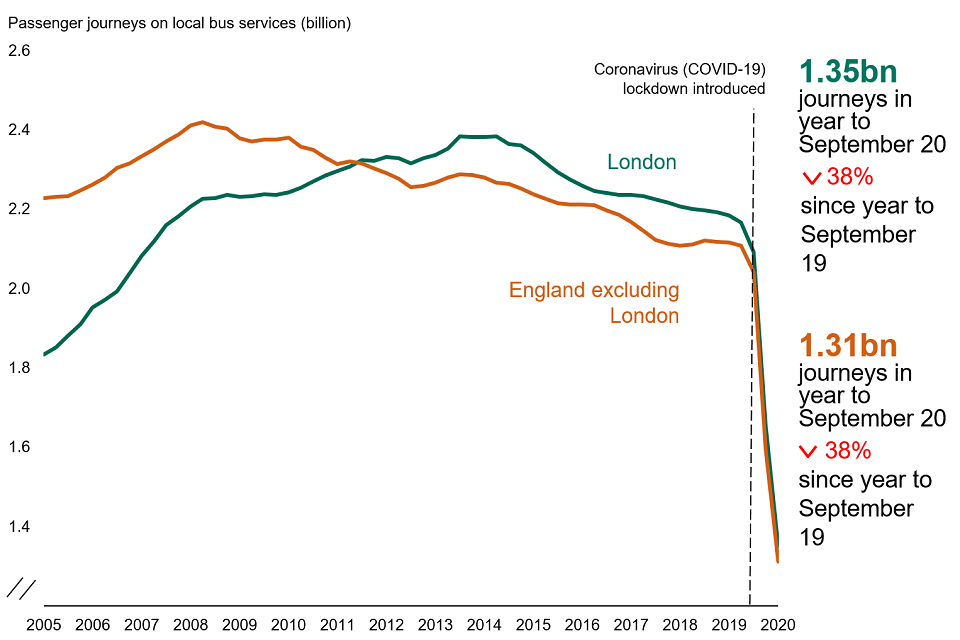
This chart shows the trend of the number of Local bus passenger journeys (seasonally adjusted) in England outside London and London, year ending September 2005 to year ending September 2020.
Chart 2 shows that when comparing July to September 2020 with the corresponding 3 months of 2019, bus use in London decreased sharply by 57%, as a result of the nationwide restrictions. Prior to this bus use has been declining more gradually in London since it’s peak early 2014. Bus use in England outside London decreased by 54% compared with the same quarter in 2019. Bus use in England decreased at the fastest rate in non-metropolitan areas. These decreases followed the announcement of movement restrictions due to COVID-19 starting in March 2020. Following the sharp decrease in passenger journeys observed across Great Britain in April to June 2020 there has been a subsequent increase in July – September 2020 in line with the easing of restrictions.
Chart 2: Local bus passenger journeys (seasonally adjusted) by metropolitan area status: England, quarterly from July to September 2004 to July to September 2020 - table BUS0106a
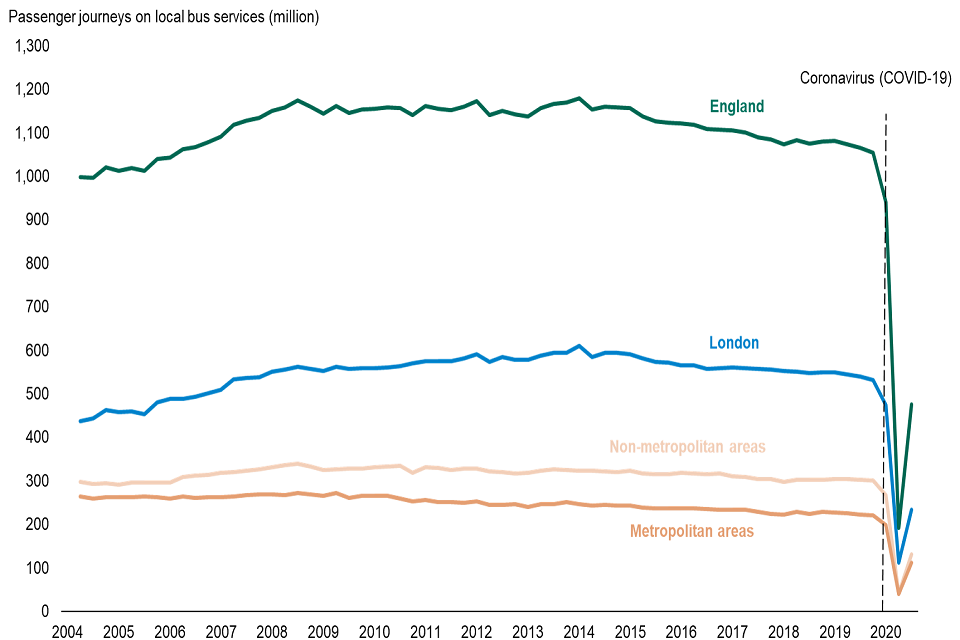
This chart shows the trend of the number of local bus passenger journeys (seasonally adjusted) by metropolitan area status: England, quarterly from July to September 2004 to July to September 2020
Local bus fares
Local bus fares in England have increased by 1.6% in the past year to September 2020, faster than the Consumer Prices Index (CPI) (0.5%). Chart 3 shows that between 2016 and 2018, the increases in local bus fares and the CPI were relatively similar, but then diverged.
Changes in the state pension age affect the provision of free travel in some areas. The calculation of the index includes adjustments for this and so some of the increase will reflect this change in availability of free travel.
Chart 3: Percentage change in Local Bus Fares index and CPI: England and UK, quarterly since March 2011, current prices - table BUS0415a
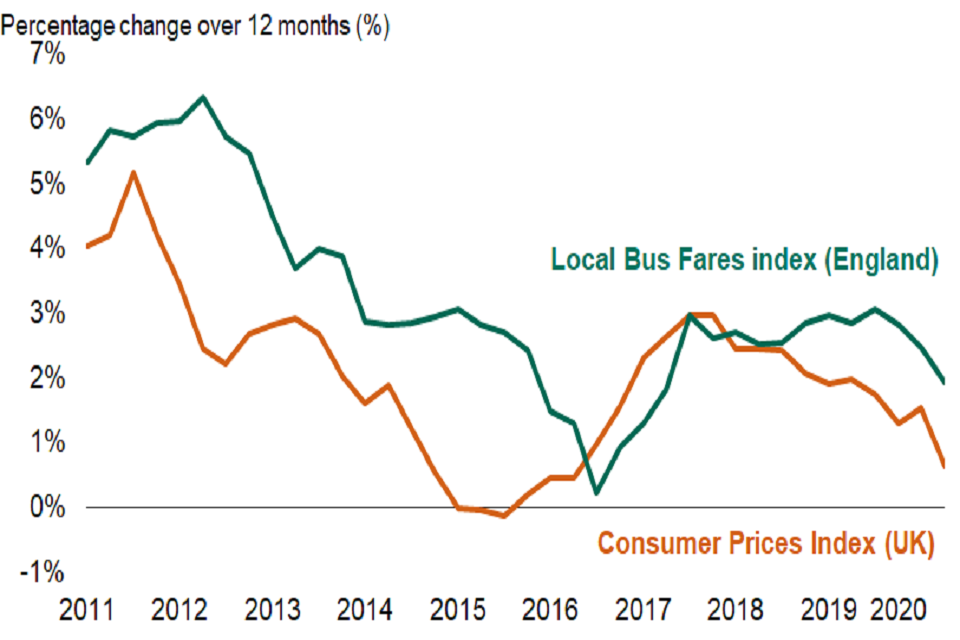
This chart shows the trend of the percentage change in Local Bus Fares index and Consumer Prices index in England and the UK since March 2011
Between September 2005 and September 2020, bus fares have risen more in metropolitan areas (83.0%) than in non-metropolitan areas (70.2%) (Chart 4), while fares in London rose at similar levels up until 2016, before flattening to a total increase of 79.1% over the whole period. The all items CPI increased by 38.8% over the same period, meaning bus fares have risen in real terms.
Chart 4: Local bus index (at current prices) by metropolitan area status: England, from March 2015 - table BUS0415a
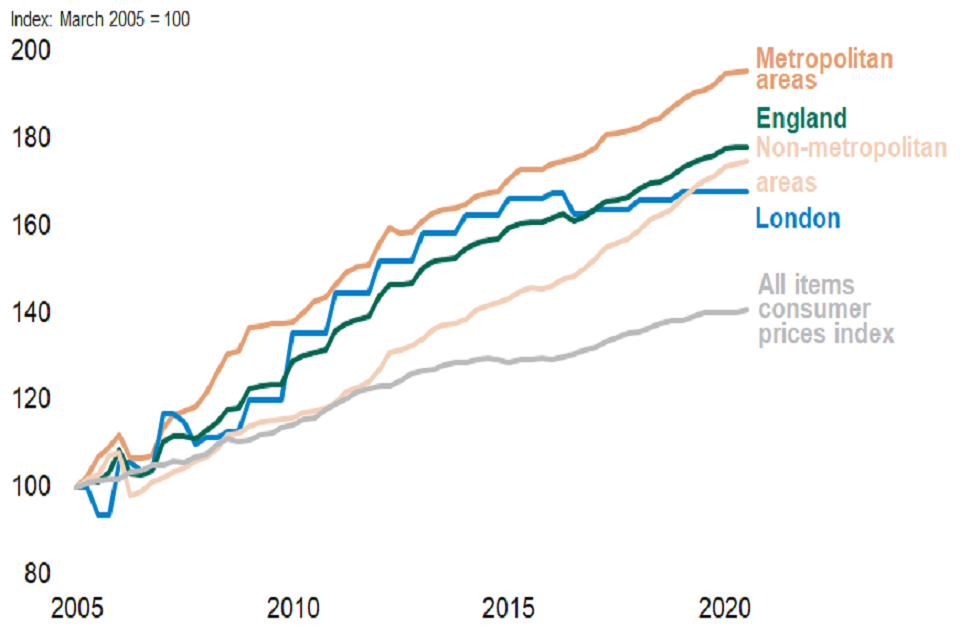
This chart shows the trend of the percentage change in Local Bus Fares index and Consumer Prices index by metropolitan area since March 2011
Background Information
About this release
This quarterly release covers local bus passenger journeys and fares. It provides the most up-to-date statistics for monitoring trends in the local bus sector.
This release relates largely to England, in line with the coverage of Department for Transport (DfT) bus policy. Statistical tables that cover the whole of Great Britain are available online.
Statistical tables
Additional tables are available online as part of the bus statistics series. Passenger numbers can be found in table BUS0103 (annual) and BUS0106 (quarterly). Bus fares index can be found in tables BUS0405 (annual) and BUS0415 (quarterly).
Bus usage
The number of bus passenger journeys (with each boarding of a bus counted as one journey) is the key measure of bus demand.
Seasonal adjustment
Estimates of the number of bus passenger journeys are seasonally adjusted. This removes the effects of seasonal factors and the arrangement of the calendar so that quarterly comparisons can be made. For the first time we are publishing non-seasonally adjusted results alongside the adjusted figures.
Local passenger journeys in different areas
Figures for England are disaggregated into London, metropolitan areas (the 6 former metropolitan counties of Greater Manchester, Merseyside, South Yorkshire, Tyne and Wear, West Midlands and West Yorkshire) and non-metropolitan areas (covering shire counties and unitary authorities).
Local bus fares index
The percentage change in bus operator receipts from passengers as a result of any fare changes. These figures provide an estimate of the change in the average cost of bus travel to the passenger but not the actual fare levels paid.
A longer time series of annual figures is available in table BUS0405, monthly inflation figures are published by the ONS with a detailed breakdown by category including bus and coach fares, rail fares and motoring costs.
An annual summary of the ONS transport indices is available in table Transport expenditure (TSGB13)
Local bus fares in different areas
Bus fares in London are set by TfL. Outside London, fare changes will largely reflect the commercial decisions of bus operators, which in turn may reflect changes in public funding.
Data sources, strengths and weaknesses
Estimates of local bus passenger journeys are based on a quarterly panel of the 18 largest non-metropolitan operators, Passenger Transport Executives (for metropolitan areas) and TfL. Data from the quarterly panel is scaled to annual figures from the department’s main annual survey of over 500 public service vehicle (PSV) operators, and figures are then seasonally adjusted.
For April to June 2020, data was only received from 16 panel members, covering around 90% of the bus journeys made in GB. Quarterly figures are subject to revision due to the nature of the seasonal adjustment and scaling to annual figures. However, these will typically be minor and not affect overall patterns shown. Figures are also subject to revision if a member changes their methodology for collecting bus patronage data. Figures for West Yorkshire and Manchester have been estimated for this release due to changes in collection methodology and issues with data availability.
The quarterly local bus fares index is based on a sample survey of over 100 bus operators and TfL, who supply data each quarter. The index measures change in the ‘gross yield’. This is the change in passenger receipts (excluding concessionary fare reimbursement and subsidies from government), which would result from a fares change, assuming no change in passenger numbers. In total the operators selected cover over 90% of passenger receipts in Great Britain, and the sample design ensures operators in each type of area are adequately represented. The survey response rate is high, for the most recent survey 91% of the sample responded which accounts for 97% of the weight in the calculation.
Data on actual fare levels are not collected. The index assumes no change in passenger behaviour and therefore may not reflect changes in the average fare actually paid (for example if passengers switch to a different ticket type, or choose not to travel, as a result of fare changes).
Users and uses of these statistics
Within DfT, quarterly bus statistics are used to inform bus policy decisions, for ministerial briefing and to answer public enquiries. Outside DfT, passenger journey figures are used to measure the overall health of the industry and often reported in the trade press. Bus fares data are used by the Office for National Statistics (ONS) in calculating the CPI.
National Statistics
These statistics were designated as National Statistics in June 2012. The continued designation was confirmed in February 2013. National Statistics are produced to high professional standards set out in the Code of Practice for Statistics. They undergo regular quality assurance reviews to ensure they meet customer needs. Details of Ministers and officials who receive pre-release access to these statistics up to 24 hours before release.
Next update
A statistical release will now accompany data tables for each quarter. Quarterly bus statistics for October to December 2020 will be released in March 2021.
To hear more about DfT statistics publications as they are released please follow us on Twitter via @DfTstats. TWITTER, TWEET, RETWEET and the Twitter logo are trademarks of Twitter, Inc. or its affiliates.