Public Health Outcomes Framework: commentary, November 2021
Published 2 November 2021
Applies to England

© Crown copyright 2021
This publication is licensed under the terms of the Open Government Licence v3.0 except where otherwise stated. To view this licence, visit nationalarchives.gov.uk/doc/open-government-licence/version/3 or write to the Information Policy Team, The National Archives, Kew, London TW9 4DU, or email: psi@nationalarchives.gov.uk.
Where we have identified any third party copyright information you will need to obtain permission from the copyright holders concerned.
This publication is available at https://www.gov.uk/government/statistics/public-health-outcomes-framework-november-2021-data-update/public-health-outcomes-framework-commentary-november-2021
Background
The Public Health Outcomes Framework sets out a high-level overview of public health outcomes, at national and local level, supported by a broad set of indicators. An interactive web tool makes the PHOF data available publicly. This allows local authorities to assess progress in comparison to national averages and their peers, and develop their work plans accordingly.
New in this update
The latest update includes data for 52 indicators, of which one has a new definition that is described in detail in the Wider Determinants of Health statistical commentary:
- B17 - Fuel poverty (low income, low energy efficiency methodology)
Summary of selected updated indicators
This summary provides the main messages for indicators updated with data new to the public domain. For a complete list of indicators that have been updated please see Public Health Outcomes Framework: Indicator Updates. Some indicators have not been updated or have been delayed due to the pandemic. A table of these can be found in the Recent Updates section of the Introduction page of the PHOF.
Mortality indicators
As the latest data point for these indicators cover the calendar year 2020, they will show the initial impact of the COVID-19 pandemic. To accommodate this, data has been presented as single years from 2001 to 2020. However, comparisons between 2019 and 2020 need to be made with caution. COVID-19 was a new cause of death in 2020 and some who died from it may have died from another cause instead if the pandemic had not occurred. This will have impacted on mortality rates from these other causes in 2020.
The 3-year rolling rates up to 2017 to 2019 are also available to view and have been updated with the latest methodological updates (for details see the Further Information section).
Changes to mortality rates
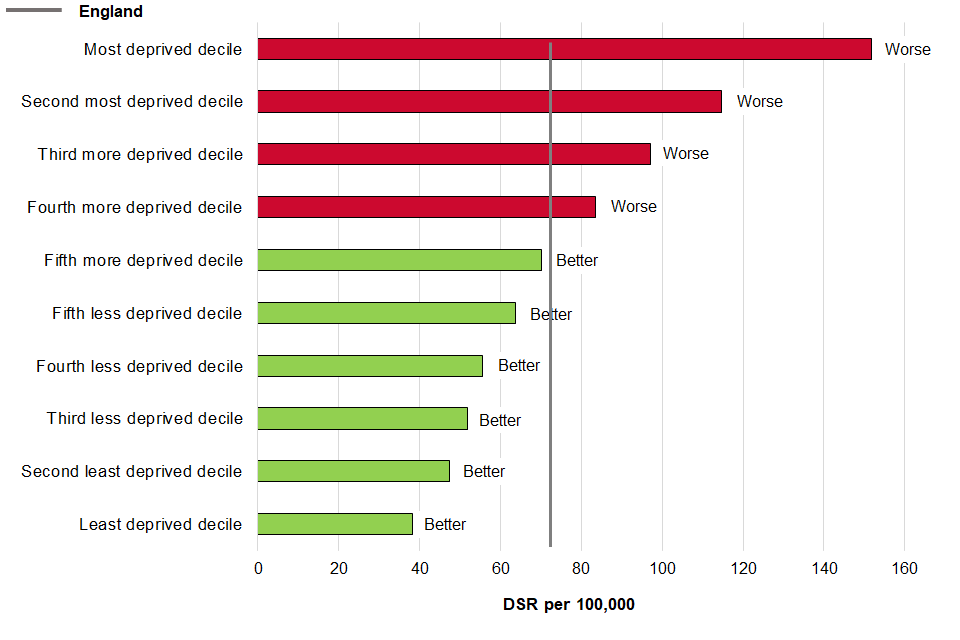
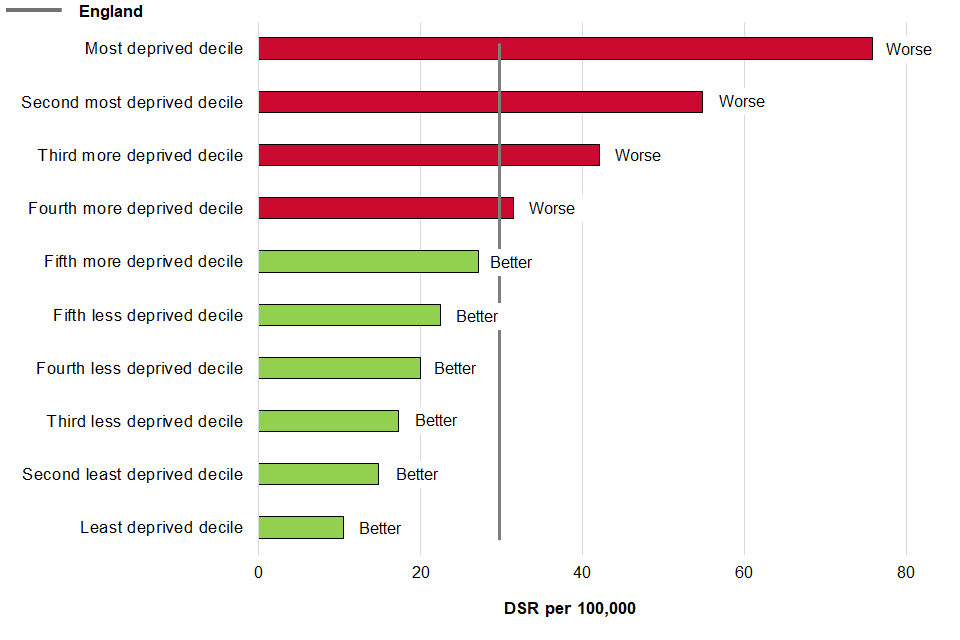
In 2020 the age-standardised mortality rate from cardiovascular disease (CVD) in those aged under 75 in England increased significantly from 68.9 deaths per 100,000 population (33,707 deaths) in 2019 to 73.8 (36,455) in 2020. The CVD mortality rate had been decreasing before this (Figure 1a). The rate in the most deprived areas in England was significantly higher than the least deprived areas, with CVD mortality twice as high in the most deprived lower super output areas than the least deprived (Figure 1b).
Figure 1a: Age-standardised mortality rates from CVD, aged under 75 years, England, 2001 to 2020
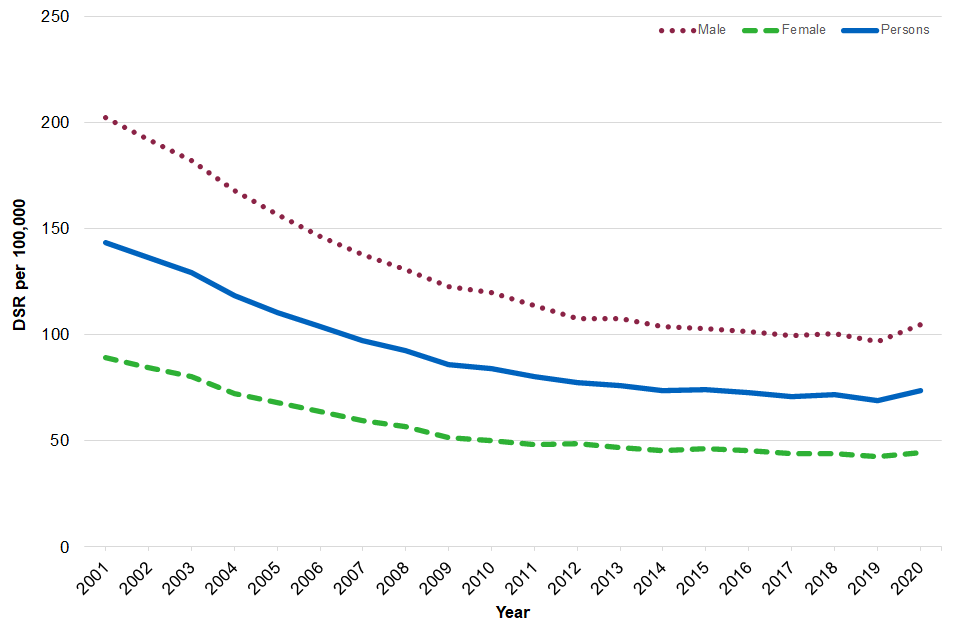
Figure 1b: Age standardised mortality rates from CVD, aged under 75, by deprivation decile, compared with England, 2020
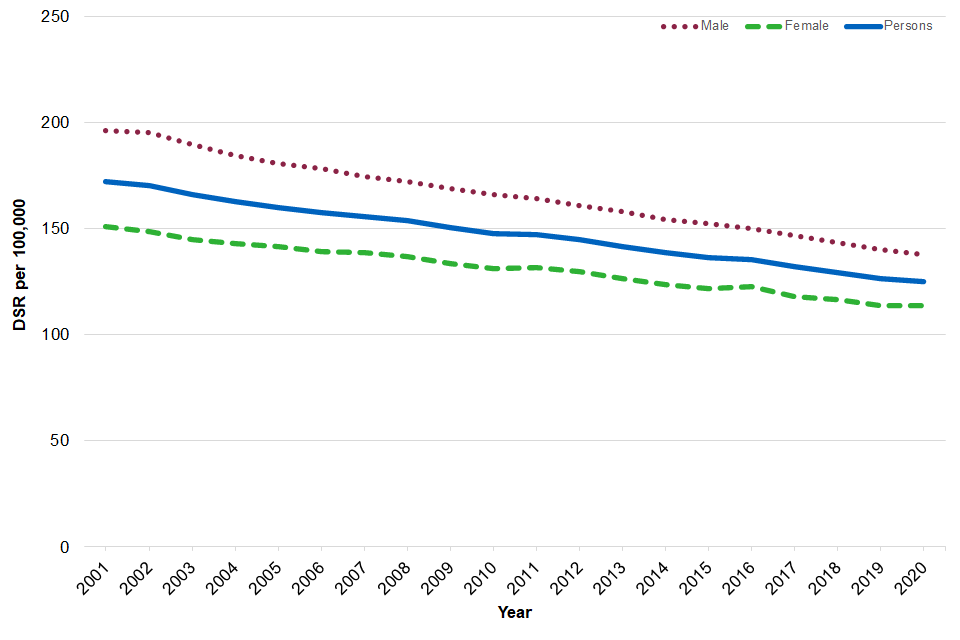
The age-standardised mortality rate from cancer in those aged under 75 in England did not change significantly between 2019 and 2020, however the rate has shown an overall decreasing trend between 2001 and 2020 (Figure 2).
Figure 2: Age-standardised mortality rates from cancer, aged under 75 years, England, 2001 to 2020
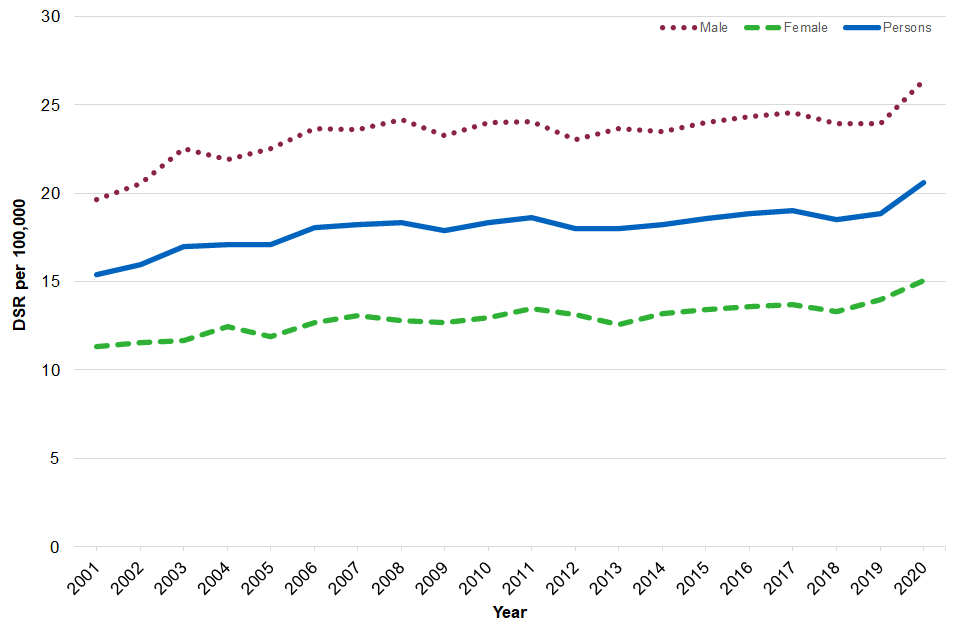
The age-standardised mortality rate from liver disease in those aged under 75 has shown an increasing trend since 2001, with a significant increase in the rate from 18.9 deaths per 100,000 population (9,218 deaths) in 2019 to 20.6 (10,127) in 2020 (Figure 3).
Figure 3: Age-standardised mortality rates from liver disease, aged under 75 years, England, 2001 to 2020
The age-standardised mortality rate from respiratory disease in those aged under 75 has shown a declining trend between 2001 and 2020 (Figure 4a). The rate in the most deprived lower super output areas in England was over 7 times higher than in the least deprived areas (Figure 4b).
Figure 4a: Age-standardised mortality rates from respiratory diseases, aged under 75 years, England, 2001 to 2020
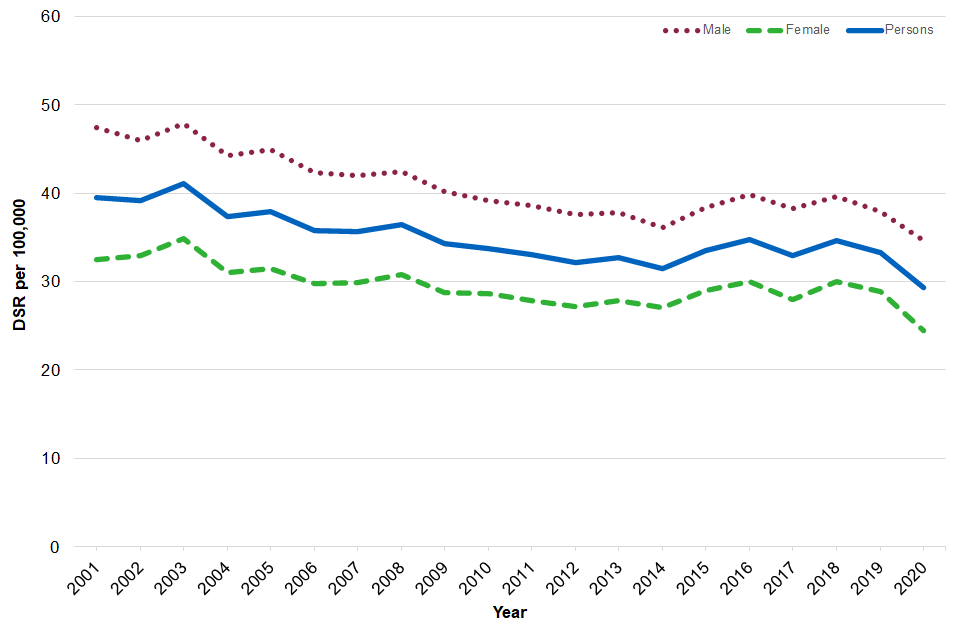
Figure 4b: Age-standardised mortality rates from respiratory diseases, aged under 75 years, by deprivation decile, compared with England, 2020
The mortality rate from a range of specified communicable diseases including influenza, but excluding COVID-19, has fluctuated between 2001 and 2020 (Figure 5).
Figure 5: Age-standardised mortality rates from a range of specified communicable diseases including influenza (excluding COVID-19), all ages, England, 2001 to 2020
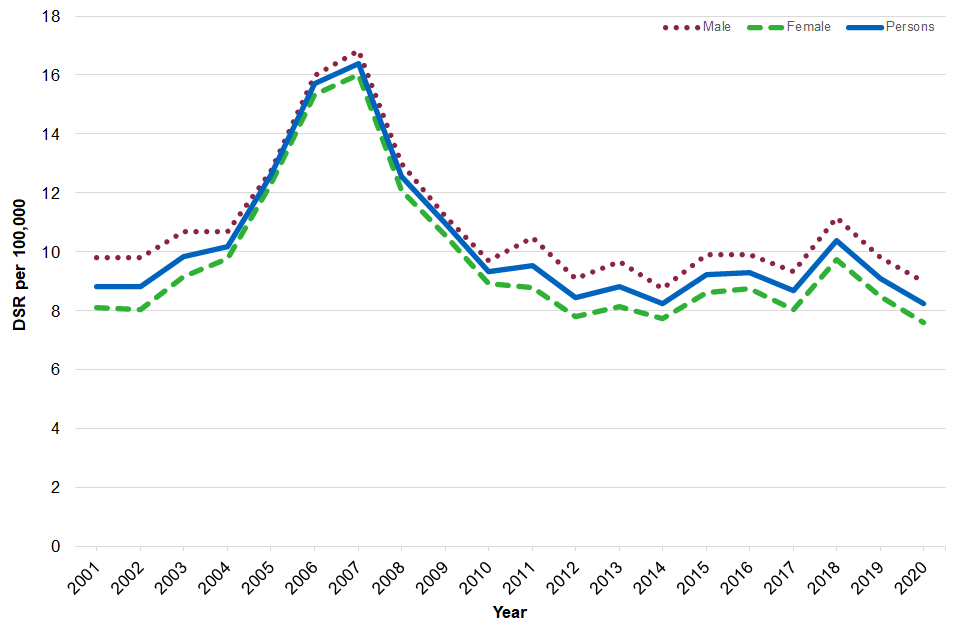
Mortality rates were higher for males than females for all of the above indicators.
Infant mortality
The latest data point has been added to the 3 year rolling time series for 2018 to 2020. Infant mortality rates did not see a significant change between 2016 to 2018 and 2018 to 2020 at 3.9 deaths per 100,000 live births in England.
Excess Winter Deaths Index
The excess winter deaths index (EWDI) is measured as the ratio of extra deaths from all causes that occurred in the winter months (December to March) compared with the expected number of deaths, based on the average of the number of non-winter deaths (the preceding August to November and the following April to July).
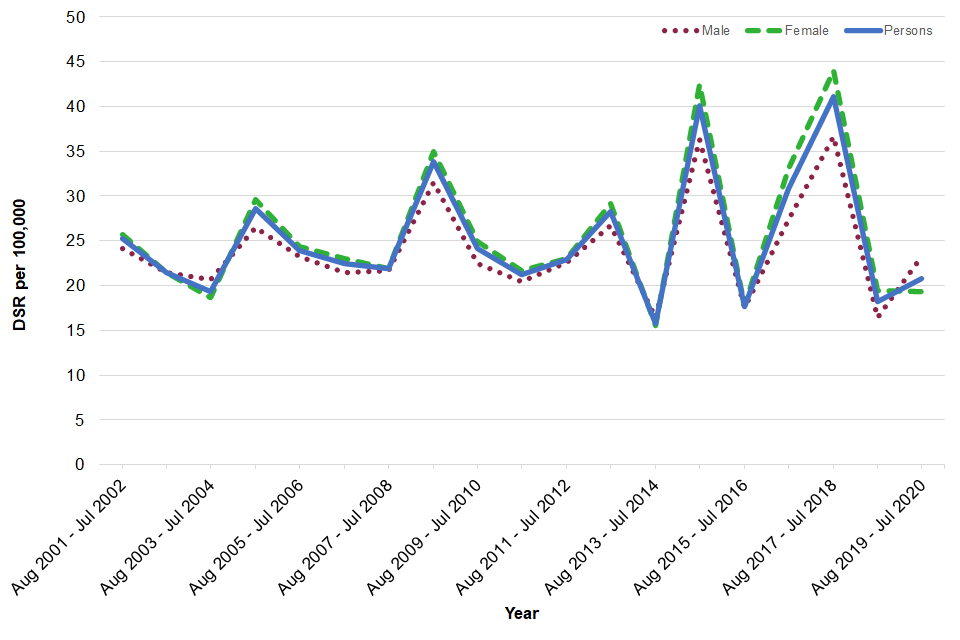
The latest time period for the EWDI, August 2019 to July 2020, shows a significant increase in excess winter deaths compared with the previous time point. There were 27,330 excess winter deaths for all ages (EWDI 17.4%) and 13,150 in the 85 and over age group (EWDI 20.8%). These indicators have shown variability over time and can be influenced by factors such as temperature, flu season, and flu vaccine effectiveness and uptake. As data for the latest period will also be affected by the pandemic, COVID-19 deaths have been excluded from this calculation to improve comparability with previous years.
Unlike the mortality indicators described earlier, the excess winter deaths index was higher for females than males (Figures 6a and 6b).
Figure 6a: Excess winter deaths index, all ages, England, between August 2001 to July 2002 and August 2019 to July 2020
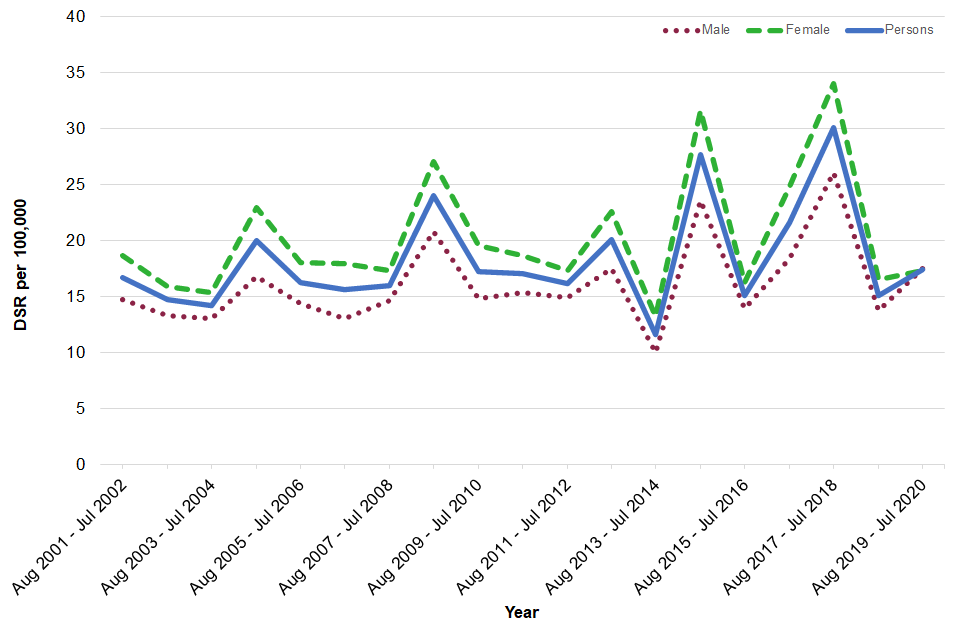
Figure 6b: Excess winter deaths index, aged 85+ years, England, between August 2001 to July 2002 and August 2019 to July 2020
Further information
Methodological changes
Counts of deaths for years up to and including 2019 have been adjusted where needed to take account of the MUSE ICD-10 coding change introduced in 2020 for cause of death. There is detailed guidance on the MUSE implementation.
Counts of deaths for years up to and including 2013 have been double adjusted by applying comparability ratios from both the IRIS coding change and the MUSE coding change where needed to take account of both the MUSE ICD-10 coding change and the IRIS ICD-10 coding change introduced in 2014. There is detailed guidance on the IRIS implementation.
Counts of deaths for years up to and including 2010 have been triple adjusted by applying comparability ratios from the 2011 coding change, the IRIS coding change and the MUSE coding change where needed to take account of the MUSE ICD-10 coding change, the IRIS ICD-10 coding change and the ICD-10 coding change introduced in 2011. There is detailed guidance on the 2011 implementation.
Lower super output areas (LSOAs)
LSOAs are small geographic areas produced by the ONS to enable reporting of small area statistics in England and Wales. There are 32,844 LSOAs in England, each having a population of approximately 1,500.
Responsible statistician, product lead: Kathryn Morgan
For queries relating to this publication contact PHOF.Enquiries@phe.gov.uk
The next planned update is February 2022.