Public Health Outcomes Framework: commentary, February 2022
Published 1 February 2022
Applies to England

© Crown copyright 2022
This publication is licensed under the terms of the Open Government Licence v3.0 except where otherwise stated. To view this licence, visit nationalarchives.gov.uk/doc/open-government-licence/version/3 or write to the Information Policy Team, The National Archives, Kew, London TW9 4DU, or email: psi@nationalarchives.gov.uk.
Where we have identified any third party copyright information you will need to obtain permission from the copyright holders concerned.
This publication is available at https://www.gov.uk/government/statistics/public-health-outcomes-framework-february-2022-data-update/public-health-outcomes-framework-commentary-february-2022
1. Background
The Public Health Outcomes Framework sets out a high-level overview of public health outcomes, at national and local level, supported by a broad set of indicators. An interactive web tool makes the PHOF data available publicly. This allows local authorities to assess progress in comparison to national averages and their peers, and develop their work plans accordingly.
2. New in this update
The latest update includes data for 43 indicators.
This summary provides the main messages from indicators updated with data new to the public domain. For a complete list of indicators that have been updated please see Public Health Outcomes Framework: indicator updates
3. Summary of selected updated indicators
3.1 A02a Inequality in life expectancy
Inequality in life expectancy, by deprivation level, in the PHOF is estimated using a summary measure called the slope index of inequality (SII). The higher the value of the SII, the greater the inequality within an area.
Inequality in life expectancy at birth was 9.7 years for males and 7.9 years for females in 2018 to 2020. At age 65, the values are 5.2 years for males and 4.8 years for females (Figure 1). There was an increase in inequality for both sexes at both ages compared with the previous period. More generally, inequality in life expectancy at birth within England has widened between 2010 to 2012 and 2018 to 2020.
Figure 1: Trends in inequality in life expectancy at birth and age 65 in males and females, England, 2001 to 2003 to 2018 to 2020
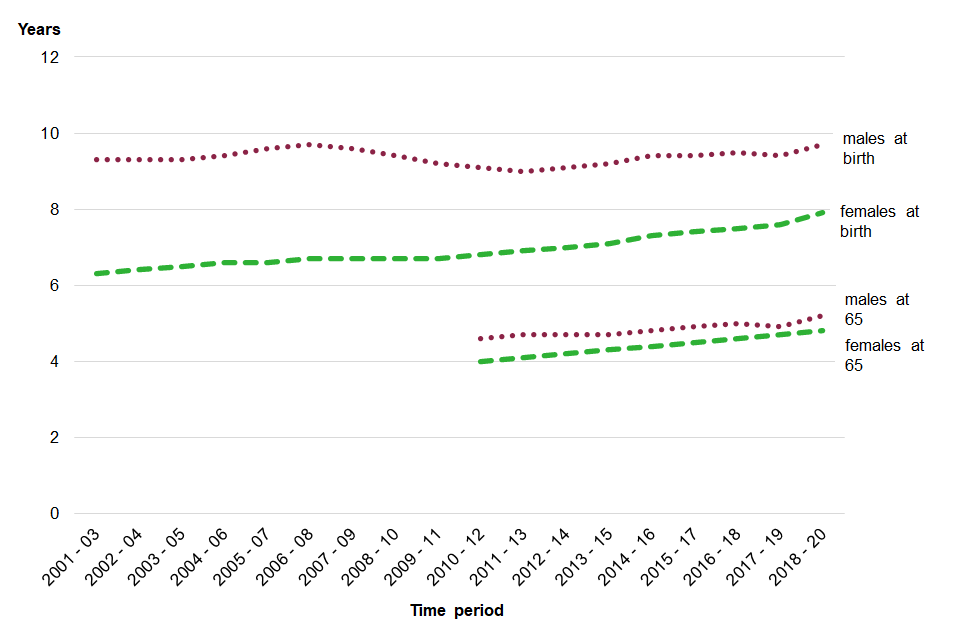
It is important to be aware that SII values should not be compared across different geographies. The SII for England takes account of the full range of deprivation and mortality across the whole country. This does not provide a suitable benchmark with which to compare local authority results, which include the range of deprivation and mortality within much smaller geographies.
3.2 Hospital admissions
The COVID-19 pandemic had a large impact on hospital activity with a reduction in admissions for many conditions in 2020 to 2021.
3.3 B12a Hospital admissions for violence, including sexual violence
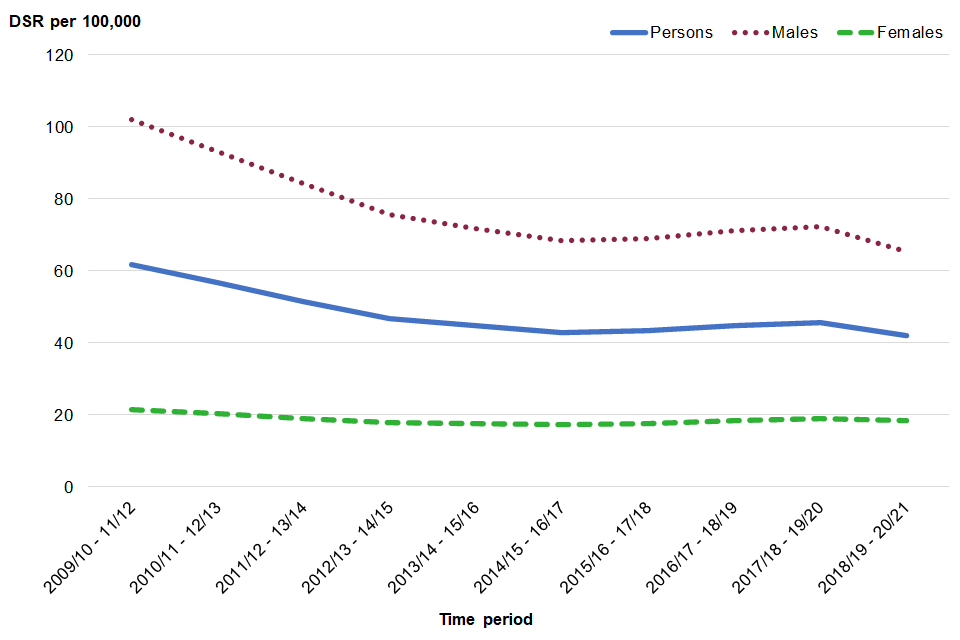
This indicator measures the number of emergency hospital admissions for violence, which accounts for a small proportion of total cases of violence as it only includes those severe enough to warrant admission to hospital. The PHOF also includes two further indicators on violent crime based on police recorded crime data.
The admission rate in England for violence decreased significantly from 45.8 admissions per 100,000 population in 2017 to 2019 (77,619 admissions), to 41.9 (71,043 admissions) in 2018 to 2021. Admissions for males continue to be higher than for females. In the latest period, there were 65.3 admissions per 100,000 population for males compared with 18.4 for females (Figure 2).
Figure 2: Age-standardised hospital admissions rate for violence, including sexual violence, England, April 2009 to March 2012, up to April 2018 to March 2021
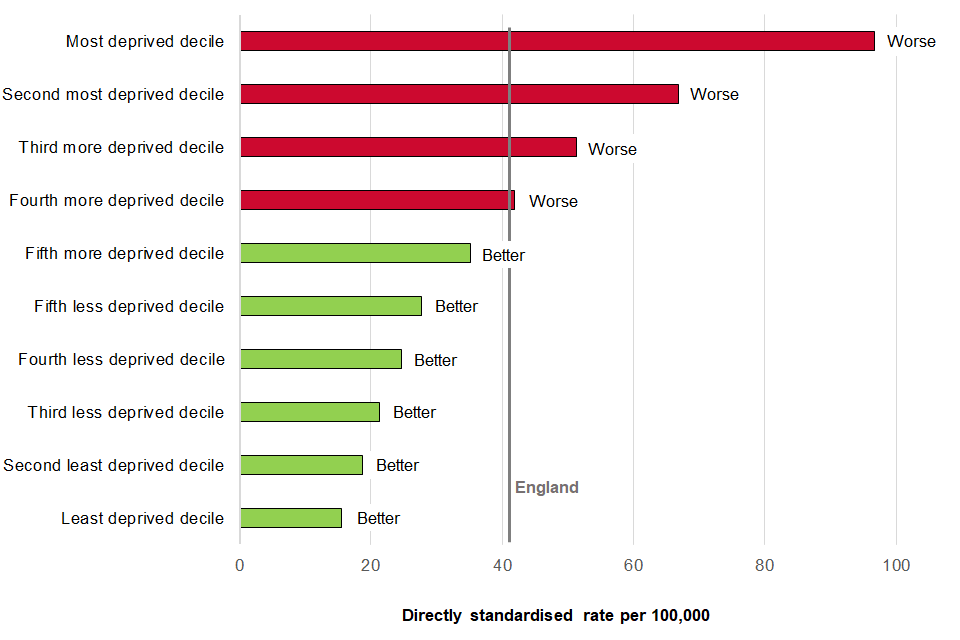
The admission rates for violence in the most deprived areas in England was higher than in the least deprived areas, with admissions 6 times as high in the most deprived decile of lower super output areas than in the least deprived (Figure 3).
Figure 3: Age-standardised hospital admissions for violence, including sexual violence by deprivation decile, England, April 2018 to March 2021
3.4 C11a, b - Hospital admissions for unintentional and deliberate injuries in children and young people
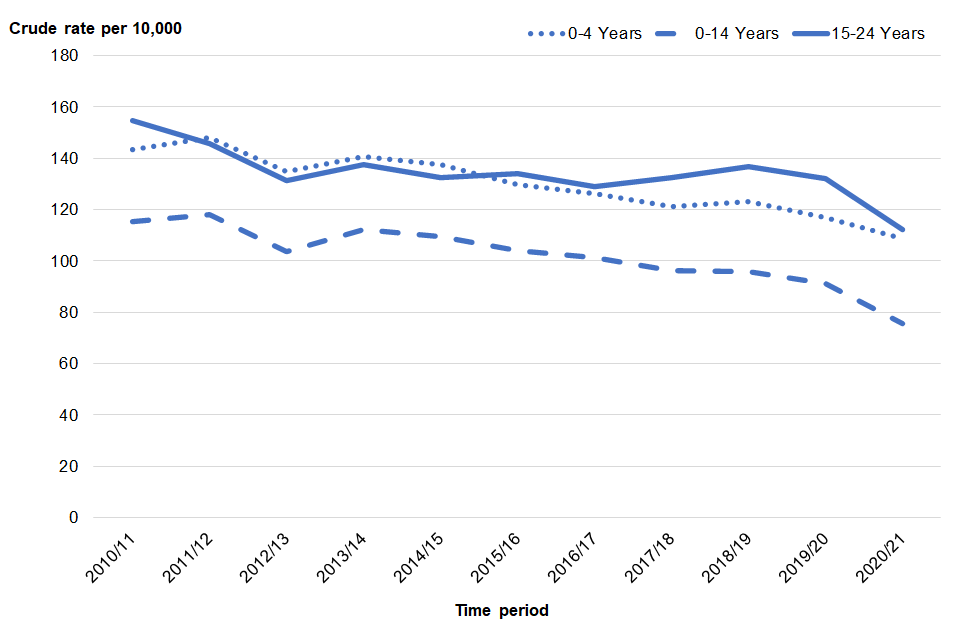
Injuries are a leading cause of hospitalisation and represent a major cause of premature mortality for children and young people. They are also a source of long-term health issues.
The crude rates of admission for unintentional or deliberate injuries for children aged 0 to 4 and 0 to 14 in England were 108.7 and 75.7 per 10,000 population of the same ages respectively in the year April 2020 to March 2021. Both were significantly lower compared with 117.0 and 91.2 admissions per 10,000 in April 2019 to March 2020. This continues the longer-term trend of decreasing admission rates since 2013 to 2014.
For young people aged 15 to 24, the latest figure for England was 112.4 per 10,000 population of the same age in the year April 2020 to March 2021. This was a significant decrease from 132.1 admissions in April 2019 to March 2020.
Figure 4: Crude hospital admission rate for unintentional and deliberate injuries in children and young people, England, April 2010 to March 2021
3.5 C29 and E13 - Emergency hospital admissions for falls and hip fractures
Falls significantly impact on long term outcomes for older people. Hip fracture is a debilitating condition and has been demonstrated to have an immediate impact on an individual’s independence. Both these causes of hospital admission can lead to people moving from their own home to long-term nursing or residential care.
The rates of emergency hospital admission due to falls in the year April 2020 to March 2021 were lower in all of the 3 age groups included in the PHOF (65 years and over, 65 to 79 years, and 80 years and over) than in April 2019 to March 2020 (Figure 5). For those aged 65 years and over the rate was 2,023 admissions per 100,000 population (216,075 hospital admissions), down from 2,222 in April 2019 to March 2020 (234,793 admissions) (Figure 5).
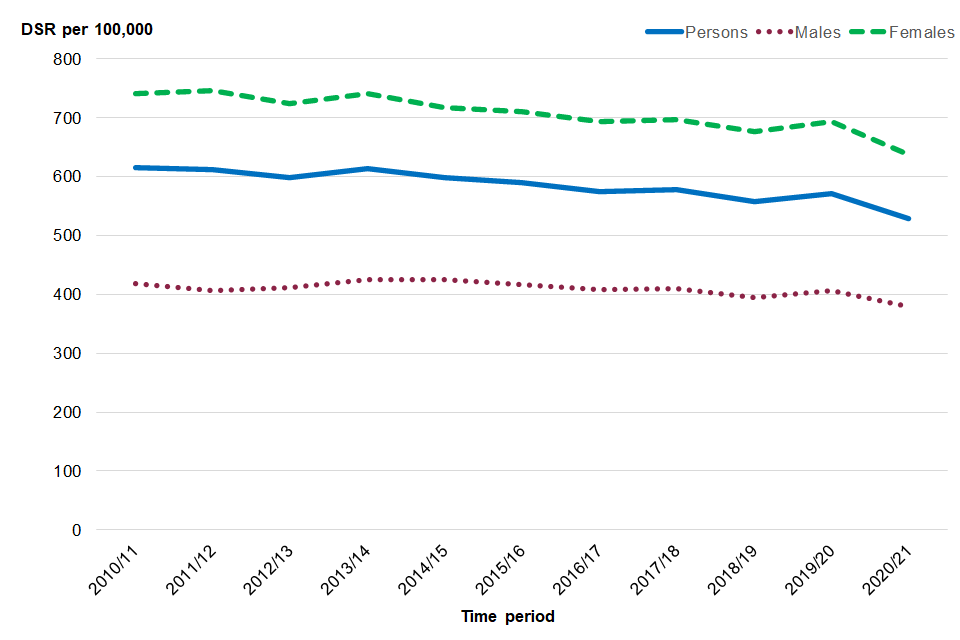
Emergency admission rates for hip fractures for this period also decreased in the same age groups. For those aged 65 years and over the rate was 529 admissions per 100,000 population (56,590 hospital admissions), down from 572 in April 2019 to March 2020 (60,575 admissions). The rate for females is consistently higher than that for males for both falls and hip fractures (Figure 6).
Figure 5: Age-standardised emergency admission rate for falls in people aged 65 years and over, England, April 2010 to March 2021
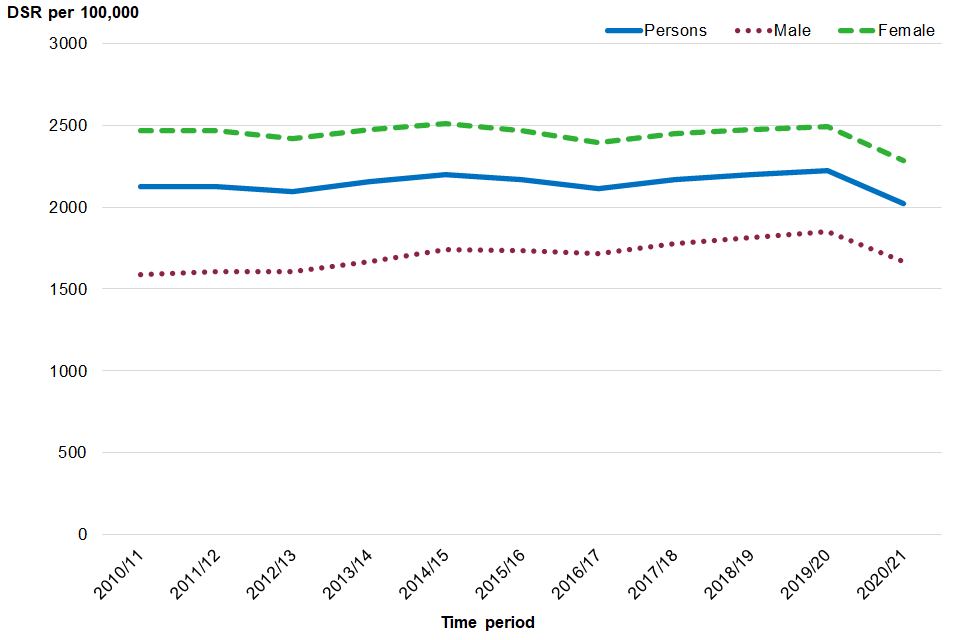
Figure 6: Age-standardised emergency admission rate for hip fractures in people aged 65 years and over, England, April 2010 to March 2021
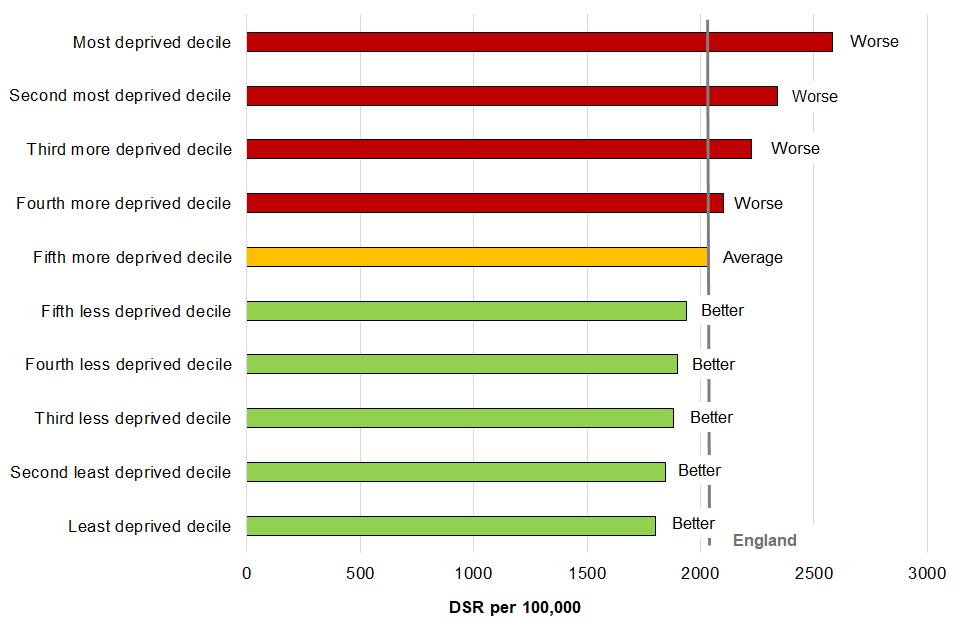
There is a clear deprivation gradient in admission rates for falls, with higher admission rates in the most deprived areas in England than in the least deprived areas (Figure 7).
Figure 7: Emergency admission rate for falls in people aged 65 and over, by deprivation decile, compared with England, April 2018 to March 2021
4. Further information
4.1 Lower super output areas (LSOAs)
LSOAs are small geographic areas produced by the ONS to enable reporting of small area statistics in England and Wales. There are 32,844 LSOAs in England, each having a population of approximately 1,500.
View the Public Health Outcomes Framework
Responsible statistician, product lead: Kathryn Morgan
For queries relating to this publication contact PHOF.Enquiries@phe.gov.uk
The next planned update is May 2022.