Provisional road traffic estimates, Great Britain: January 2016 to December 2016
Published 9 February 2017

© Crown copyright 2017
This publication is licensed under the terms of the Open Government Licence v3.0 except where otherwise stated. To view this licence, visit nationalarchives.gov.uk/doc/open-government-licence/version/3 or write to the Information Policy Team, The National Archives, Kew, London TW9 4DU, or email: psi@nationalarchives.gov.uk.
Where we have identified any third party copyright information you will need to obtain permission from the copyright holders concerned.
This publication is available at https://www.gov.uk/government/statistics/provisional-road-traffic-estimates-great-britain-january-2016-to-december-2016/provisional-road-traffic-estimates-great-britain-january-2016-to-december-2016
Provisional estimates show that motor vehicle traffic was at a record high in the year ending December 2016.
The provisional figure, of 320.5 billion[footnote 1] vehicle miles travelled on Great Britain’s roads in the year ending December 2016, was 1.2% higher than the previous year. This is a record level, 2% higher than the pre-recession peak in the year ending September 2007. Rolling annual motor vehicle traffic has now increased each quarter in succession for over 3 years.
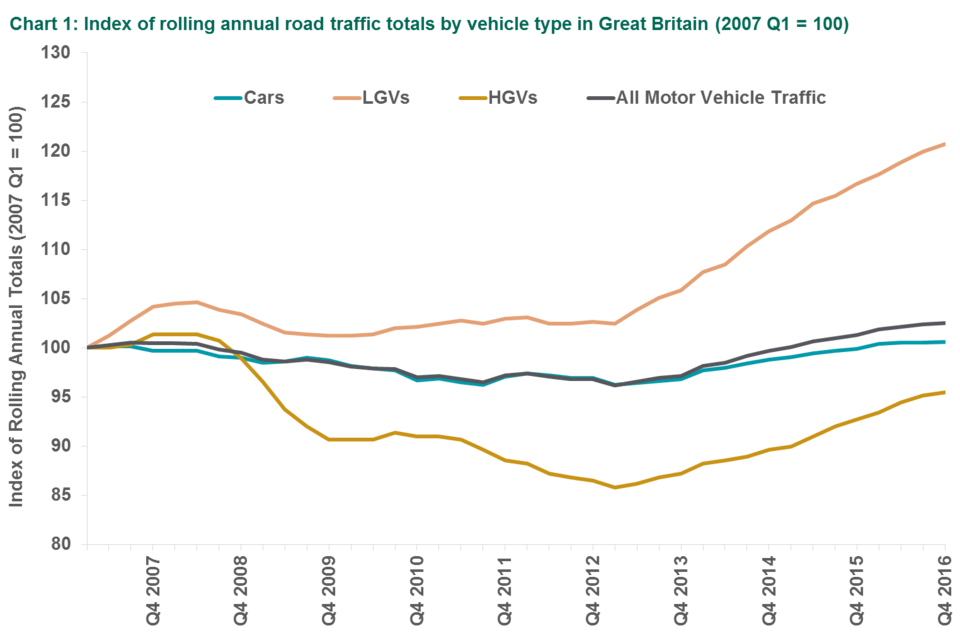
Chart 1: Rolling Annual and Quarterly Indices of Road Traffic in Great Britain, from 1993
Compared to the previous year, in the year ending December 2016:
-
car traffic increased by 0.7% to a record 249.5 billion vehicle miles, 1.3 billion more vehicle miles travelled than the pre- recession peak in the year ending September 2007
-
van traffic (LGV) continued to rise, increasing by 3.4% to a new peak of 48.5 billion vehicle miles
-
HGV traffic grew by 2.8% overall to 17.1 billion vehicle miles
-
traffic on motorways and rural ‘A’ roads increased to new record levels, rising by 2.1% and 2.5% respectively
-
traffic was broadly stable on minor roads
In context
Road traffic trends are affected by a wide range of factors, including population levels, personal travel choices, and the demand for goods and services. The increase in traffic over the last 3 years is likely to reflect the growth both in the UK economy[footnote 2] and population[footnote 2] over the same period, and also the decline in average fuel prices[footnote 3] from mid-2014 until February 2016.
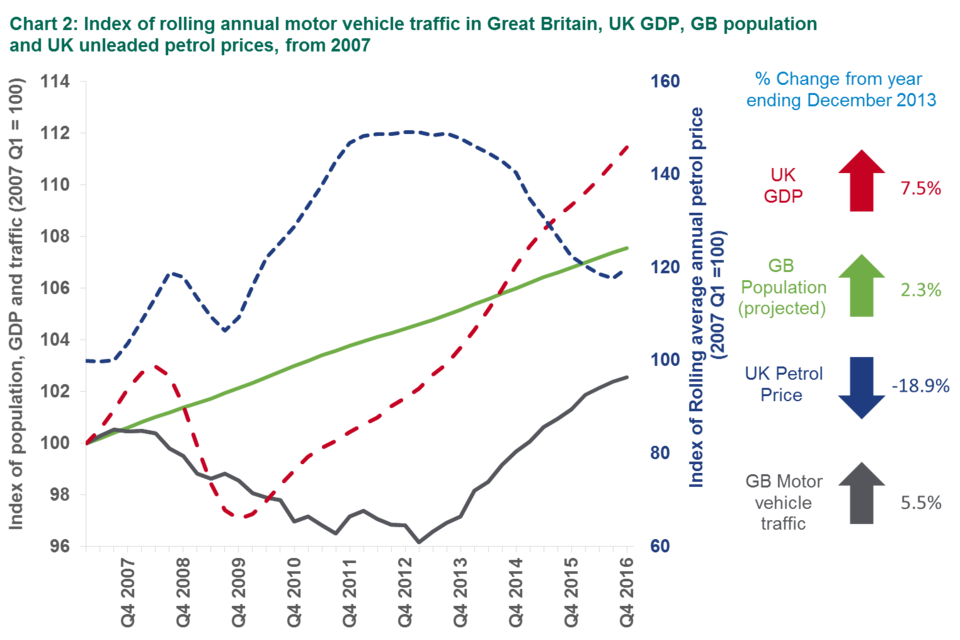
Chart 2: Index of rolling annual motor vehicle traffic in Great Britain, UK GDP, GB population and UK unleaded petrol prices, from 2007
Summary figures
The summary table below shows how vehicle traffic in the year ending December 2016 compares to that in the year ending September 2016, and across a range of earlier years. For more see provisional estimates and TRA25 series of provisional traffic estimate tables.
| Percentage change from… | Last quarter |
Last year |
5 years ago |
10 years ago |
20 years ago |
|
|---|---|---|---|---|---|---|
| Year ending | Vehicle miles Dec 2016 |
Sep 2016 |
Dec 2015 |
Dec 2011 |
Dec 2006 |
Dec 1996 |
| All motor vehicle traffic | 320.5 billion | 0.2% | 1.2% | 5.5% | 3.0% | 16.9% |
| Cars and taxis | 249.5 billion | 0.1% | 0.7% | 3.7% | 1.0% | 11.6% |
| Light goods vehicles | 48.5 billion | 0.6% | 3.4% | 17.2% | 21.4% | 69.0% |
| Heavy goods vehicles | 17.1 billion | 0.4% | 2.8% | 7.6% | -5.1% | 5.1% |
| Motorways | 67.9 billion | 0.4% | 2.1% | 9.9% | 9.9% | 39.7% |
| Rural ‘A’ roads | 93.6 billion | 0.5% | 2.5% | 6.7% | 4.9% | 21.9% |
| Urban ‘A’ roads | 50.2 billion | 0.2% | 1.1% | 2.0% | -2.0% | 0.0% |
| Rural minor roads | 44.2 billion | -0.3% | -0.6% | 7.4% | 4.8% | 20.9% |
| Urban minor roads | 64.6 billion | -0.2% | -0.3% | 1.2% | -3.4% | 4.4% |
Vehicle type
Car, van and lorry traffic have all increased over the last year.
Compared to the previous year, in the year ending December 2016:
-
car and taxi traffic reached a new high of 249.5 billion vehicle miles, slightly (0.5%) above the previous peak of 248.2 billion vehicle miles for the year ending September 2007. Car traffic has grown for the last 4 years by an average of 0.9% per year
-
LGV traffic increased by 3.4% to a record high of 48.5 billion vehicle miles. For the last 4 years, LGV traffic has increased on average by 4.1% per year, and has been the fastest growing traffic type over this period
-
HGV traffic increased by 2.8% to 17.1 billion vehicle miles. For the last 4 years, HGV traffic has grown on average by 2.5% per year making it the second fastest growing traffic type in this period. However, HGV traffic remains below the peak of 18.2 billion vehicle miles observed in the year ending June 2008
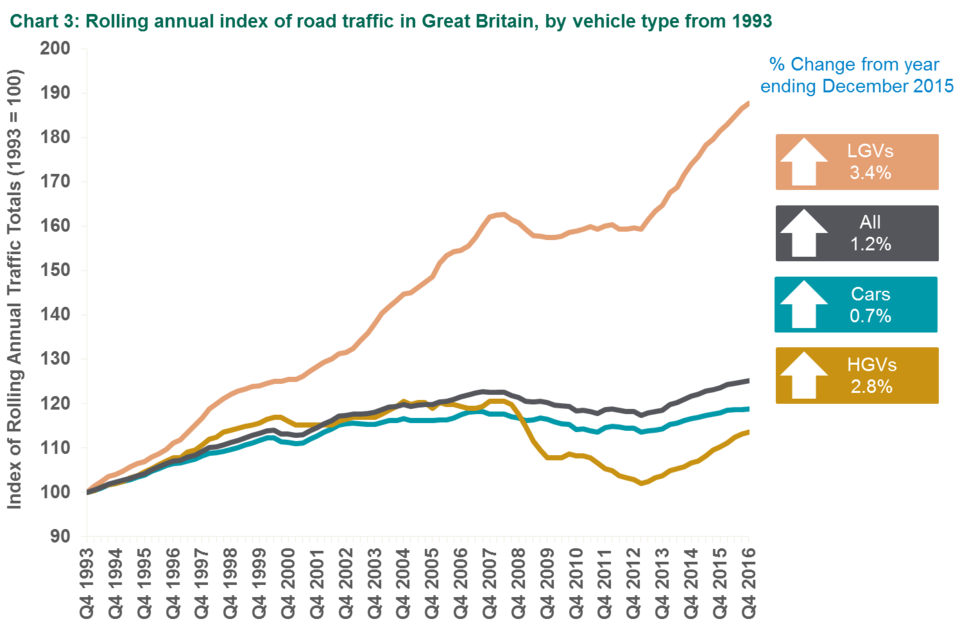
Chart 3: Rolling annual index of road traffic in Great Britain, by vehicle type from 1994
Data for this chart: TRA2501f
Road type
Provisional traffic estimates on motorways and rural ‘A’ roads were the highest ever recorded.
Compared to the previous year, in the year ending December 2016:
-
motorway traffic increased by 2.1% to 67.9 billion vehicle miles. Over the last 6 years, Motorway traffic has increased on average by 1.8% per year
-
‘A’ road traffic showed an increase of 2.0%. This was mainly driven by traffic on rural ‘A’ roads, which grew by 2.5% to 93.6 billion vehicle miles. Traffic on urban ‘A’ roads increased by 1.1% to 50.2 billion vehicle miles
Minor road traffic has been broadly stable for the last 6 quarters, at 44.2 billion vehicle miles for minor rural roads, and 64.6 billion vehicle miles for urban minor roads.
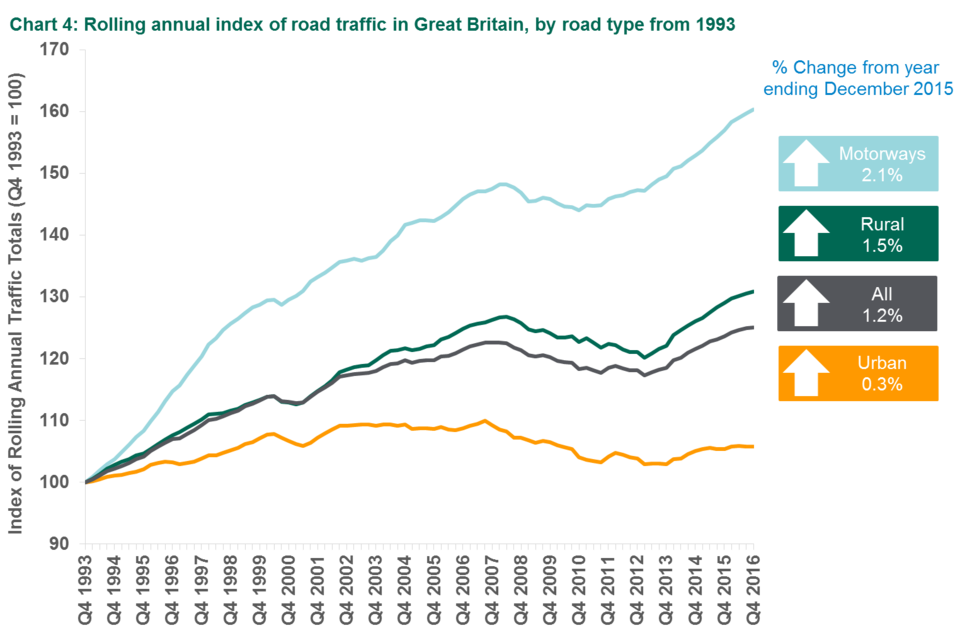
Chart 4: Rolling annual index of road traffic in Great Britain by road type from 1993
Data for this chart: TRA2502f
Vehicle type and road type
Provisional estimates indicate that car traffic was higher than ever before on motorways in the year ending December 2016.
Compared to the previous year, in the year ending December 2016:
-
car traffic increased on motorways and rural ‘A’ roads to the highest ever levels of 49.8 and 71.8 billion vehicle miles, respectively
-
LGV traffic grew on all road types apart from rural minor roads. LGV traffic reached a new peak on motorways and ‘A’ roads
-
HGV traffic increased by 4.1% on motorways to a new peak of 7.9 billion vehicle miles. HGV traffic also increased on rural ‘A’ roads, and was broadly stable on urban ‘A’ roads
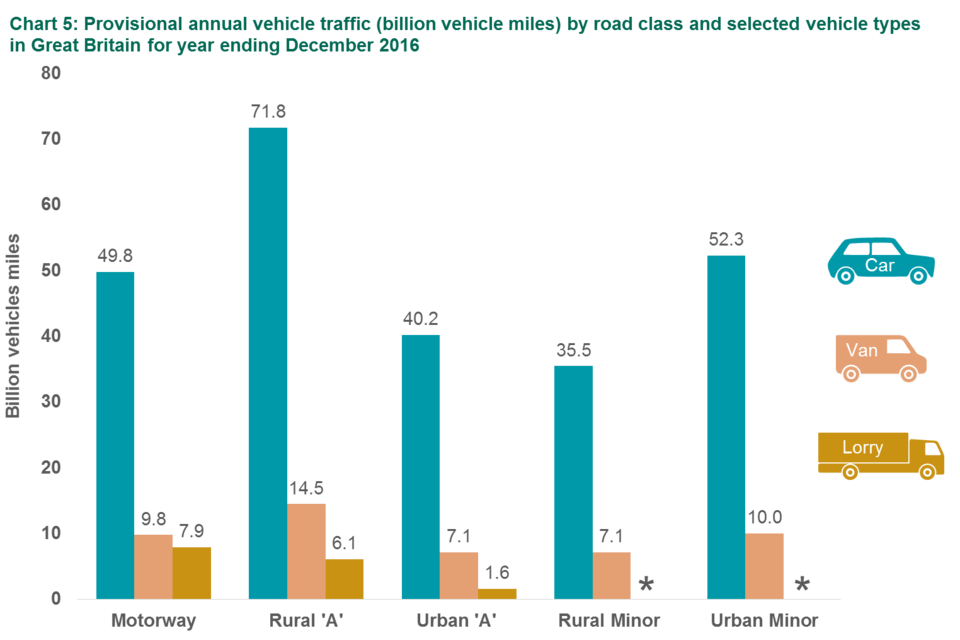
Chart 5: Provisional annual vehicle traffic (billion vehicle miles) by road class and selected vehicle types in Great Britain for year ending December 2016
Data for this chart: TRA2503e
Background information
About provisional traffic estimates
This release presents provisional estimates for road traffic in Great Britain for January 2016 to December 2016. Provisional estimates are published quarterly and remain provisional until after they have been constrained by the final annual estimates each year. Final annual estimates for 2016 are due to be published in May 2017. These provisional estimates are based on traffic data collected continuously from a network of around 200 automatic traffic counters. Final annual figures also incorporate manual traffic count data.
Traffic shows a seasonal pattern at the national level, being highest in summer and lowest in winter. This publication focuses on rolling annual traffic totals, which better illustrate medium and long term trends in traffic.
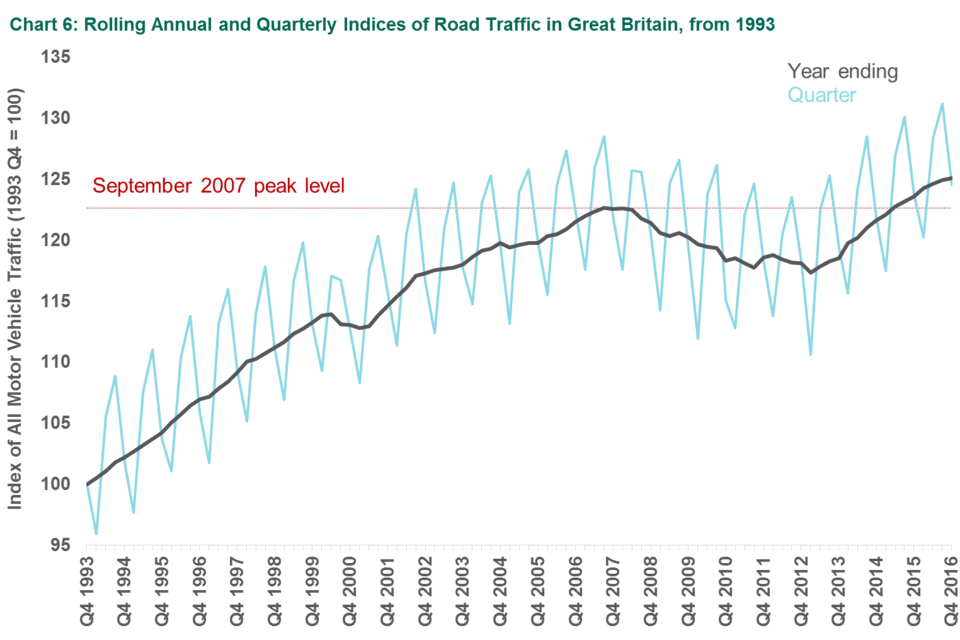
Chart 6: Rolling Annual and Quarterly Indices of Road Traffic in Great Britain, from 1993
Users and uses of these statistics
Road traffic data are a key source of management information on the country’s infrastructure. Main uses of road traffic statistics are summarised online in our report - “Meeting customers’ needs: users and uses of road traffic statistics and data”. These include:
-
Highways England, local authorities (including Transport for London) and devolved governments, who use the data for transport planning, road engineering and policy monitoring at a regional or local level
-
road accident and safety statistics, who use our annual and quarterly traffic estimates to produce road safety and accident rates, as required for the strategic framework for road safety
We welcome feedback on any aspects of the Department’s road traffic statistics including content, timing, and format. Please send any queries you have by email, to the Road Traffic Statistics team.
Sources, strengths and weaknesses of the data
Provisional estimates are based on data from around 200 automatic traffic counters and give an indication of changes in traffic levels for different types of vehicle and on different types of road in Great Britain as a whole. Final annual estimates make use of data from around 8,000 manual traffic counts in addition to the data from the automatic traffic counters and can estimate traffic levels in local areas and on specific road links, which cannot be produced from the provisional data.
Automatic traffic counters classify vehicle types based on characteristics such as axle-spacing and vehicle length. This creates the possibility for misclassification of vehicles with atypical characteristics, meaning that provisional estimates for different vehicle types are less robust than the final estimates which also utilise the more accurate manual count data. The classification algorithms are continually developed to ensure that vehicle classification is as accurate as possible.
Further road traffic statistical guidance.
Due to the methodology used to produce provisional traffic estimates, historic figures are subject to revision. However, these revisions are typically minor and will not affect qualitative patterns in the data. Provisional quarterly and annual traffic estimates for all motor vehicles have historically been accurate (typically within 1.5%) when compared with the final estimates, as illustrated in the tables below.
| All motor vehicle traffic | 2014 Q1 | 2014 Q2 | 2014 Q3 | 2014 Q4 | 2014 annual |
|---|---|---|---|---|---|
| Provisional estimates at time of publication (billion vehicle miles) |
77.4 | 77.2 | 77.9 | 77.8 | 310.2 |
| Final estimates (billion vehicle miles) |
77.3 | 77.3 | 78.1 | 78.2 | 311.0 |
| Difference (%) | 0.1 | -0.2 | -0.3 | -0.6 | -0.3 |
| All motor vehicle traffic | 2015 Q1 | 2015 Q2 | 2015 Q3 | 2015 Q4 | 2015 annual |
|---|---|---|---|---|---|
| Provisional estimates at time of publication (billion vehicle miles) |
79.0 | 79.3 | 79.5 | 80.0 | 317.8 |
| Final estimates (billion vehicle miles) |
78.8 | 79.2 | 79.2 | 79.6 | 316.7 |
| Difference (%) | 0.3 | 0.1 | 0.4 | 0.5 | 0.3 |
National statistics
National statistics are produced to high professional standards, as set out in the National statistics code of practice. They undergo regular quality assurance reviews to ensure they meet customer needs.
Details of ministers and officials who receive pre-release access to these statistics up to 24 hours before.
Next release
The next provisional road traffic estimates, for the year ending March 2017, are due to be published in May 2017. Final annual traffic estimates for 2016 are due to be published in May 2017.
Contact us
Road traffic and vehicle speed compliance statistics
Email roadtraff.stats@dft.gov.uk
Media enquiries 0300 7777 878
To hear more about DfT statistics publications as they are released, follow us on Twitter via @DfTstats.
-
1 billion = 1,000 million ↩
-
Economic and population statistics are sourced from the Office for National Statistics ↩ ↩2
-
Fuel price data is sourced from the Department for Business, Energy & Industrial Strategy ↩