Property rental income statistics: 2026
Updated 28 August 2026

© Crown copyright 2026
This publication is licensed under the terms of the Open Government Licence v3.0 except where otherwise stated. To view this licence, visit nationalarchives.gov.uk/doc/open-government-licence/version/3 or write to the Information Policy Team, The National Archives, Kew, London TW9 4DU, or email: psi@nationalarchives.gov.uk.
Where we have identified any third party copyright information you will need to obtain permission from the copyright holders concerned.
This publication is available at https://www.gov.uk/government/statistics/property-rental-income-statistics/property-rental-income-statistics-2026
1. Key points
The key points for property rental income statistics are:
-
the total number of unincorporated landlords that declared income from renting property in 2024 to 2025 was 2.88 million
-
88% of unincorporated landlords claimed some form of expenses
-
property income is concentrated in London. In 2024 to 2025, 17% of unincorporated landlords were based in London, accounting for 28% of property income for unincorporated landlords
2. Overview
This Official Statistics publication includes information on income and expenses from renting property from HM Revenue and Customs’ (HMRC) Income Tax Self Assessment (ITSA) returns data only. Entities that do not submit ITSA returns, such as incorporated businesses with property income or individuals with property income that falls below the threshold for inclusion in ITSA, are therefore not included in this release.
This publication covers taxpayers that receive income from renting property that is declared via ITSA. It does not contain information on tenants, or on income received from buying and selling properties.
This release covers data from the last 5 available tax years, from 2020 to 2021 to 2024 to 2025.
These statistics are subject to revision, with the next release in Summer 2027. Estimates may increase between publications as additional tax returns are received and processed after the data extract used for analysis. Revisions may be particularly noticeable for partnership income, as some large partnerships are subject to different Self Assessment Reporting requirements and their information may become available in data sets at a later stage.
Statistical contacts: S.Diaz and O.Milner-Thomas
Media enquiries: HMRC Press Office
The underlying data for all tables and figures in this publication can be found in the Property income statistics tables
3. Income from all UK property
UK property income can be declared on ITSA returns by a variety of different tax entities. The most common type of landlord of UK rental property is private individuals, who account for the majority of rental income declared.
Table 1: Property income declared in 2024 to 2025 by type of tax entity
| Tax Entity | No. of tax entities (millions) | Total income declared (£ billions) |
|---|---|---|
| Individuals | 2.85 | 49.81 |
| Partnerships | 0.03 | 9.18 |
| Total | 2.88 | 58.99 |
The key points from Table 1 are:
-
in 2024 to 2025, 2.88 million unincorporated landlords declared income from renting property
-
of these, 99% were individuals declaring property income as part of their Self Assessment tax return
-
in 2024 to 2025, individuals accounted for £49.81 billion in property income
Figure 1: Total rental income declared by unincorporated landlords, 2020 to 2021 to 2024 to 2025
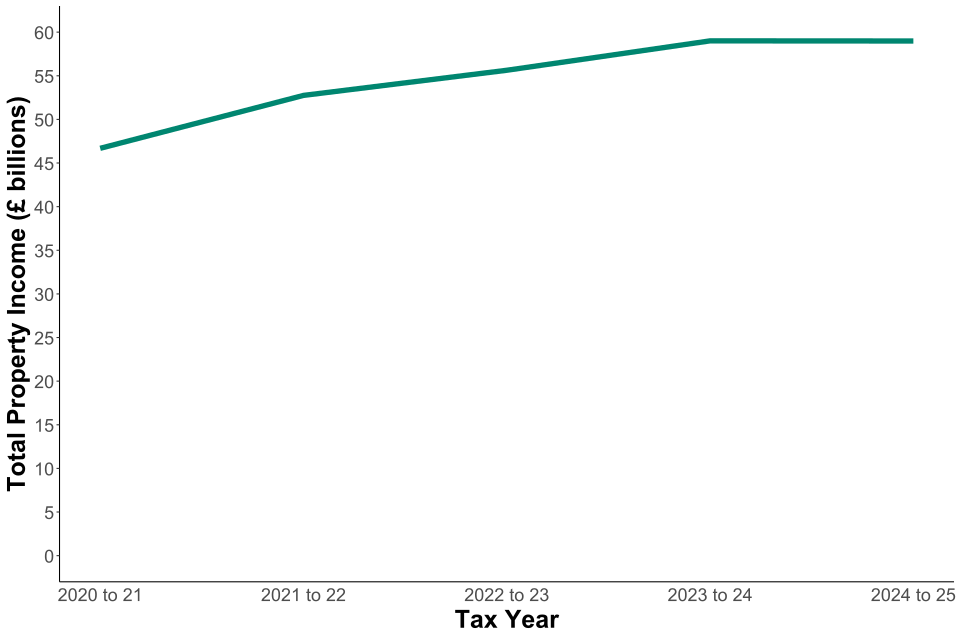
Figure 1 demonstrates a consistent upwards trend in the 4 years between 2020 to 2021and 2023-24 before a leveling off:
-
overall, total income from UK property increased by £12.3 billion, or 26% between 2020 to 2021 and 2024 to 2025, driven by an increase in both average property income and the number of individuals reporting property income, which increased to 2.88 million in 2024 to 2025 from 2.81 million in 2020 to 2021
-
total property income declared by unincorporated landlords remained fairly consistent in 2024 to 2025, at £58.99 billion, compared with £59 billion in 2023 to 2024
The underlying data for figure 1 can be found in the Property income statistics tables
Figure 2: Average rental income per landlord declared by unincorporated landlords, 2020 to 2021 to 2024 to 2025
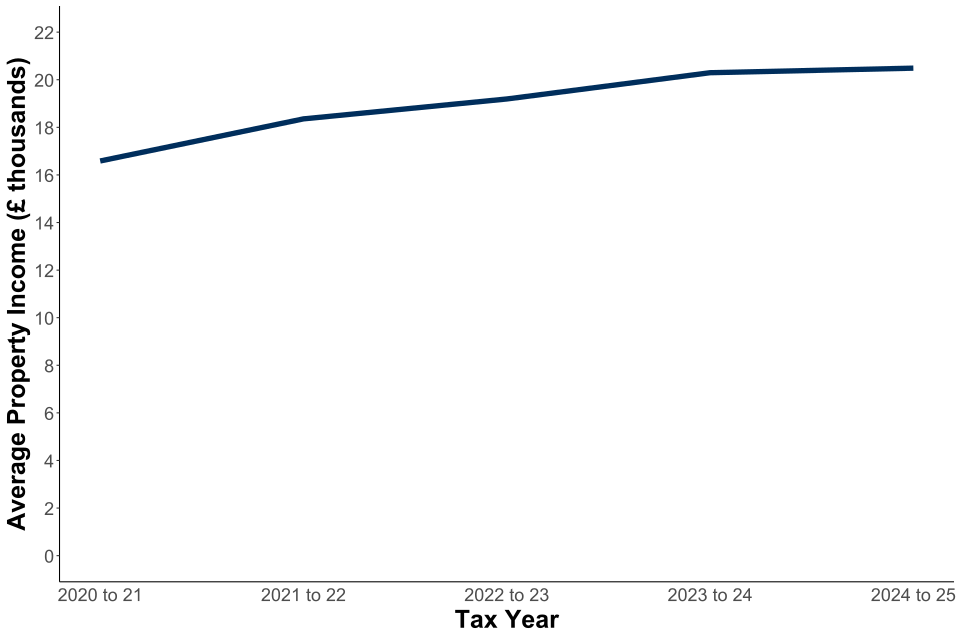
Figure 2 demonstrates a consistent upwards upward trend in the 5 years between 2020 to 2021and 2024 to 2025:
-
overall, average income per landlord from UK property increased by £3,900, or 24% between 2020 to 2021 and 2024 to 2025
-
average property income declared by unincorporated landlords increased in 2024 to 2025, to £20,500, the highest average in the last 5 years, compared with £20,300 in 2023 to 2024
The underlying data for figure 2 can be found in the Property income statistics tables
4. Income from UK furnished holiday lettings
Income from UK furnished holiday lettings is declared on ITSA returns and reported separately from other property income in 2024 to 2025. It represents a small group relative to the overall landlord population size. Note UK furnished holiday lettings only are within scope of this publication. Non-UK furnished holiday lettings are excluded from the numbers provided.
Table 2: Number of furnished holiday lettings and income declared in 2024 to 2025
| No. of tax entities (millions) | Total income declared (£ billions) |
|---|---|
| 0.13 | 2.46 |
The key points from Table 2 are:
-
in 2024 to 2025, 0.13 million unincorporated landlords declared furnished holiday letting income as part of their Self Assessment tax return
-
in 2024 to 2025, UK furnished holiday lettings accounted for £2.46 billion in property income which is 4% of the UK rental market income
Figure 3: Total furnished holiday lettings income declared by unincorporated landlords, 2020 to 2021 to 2024 to 2025
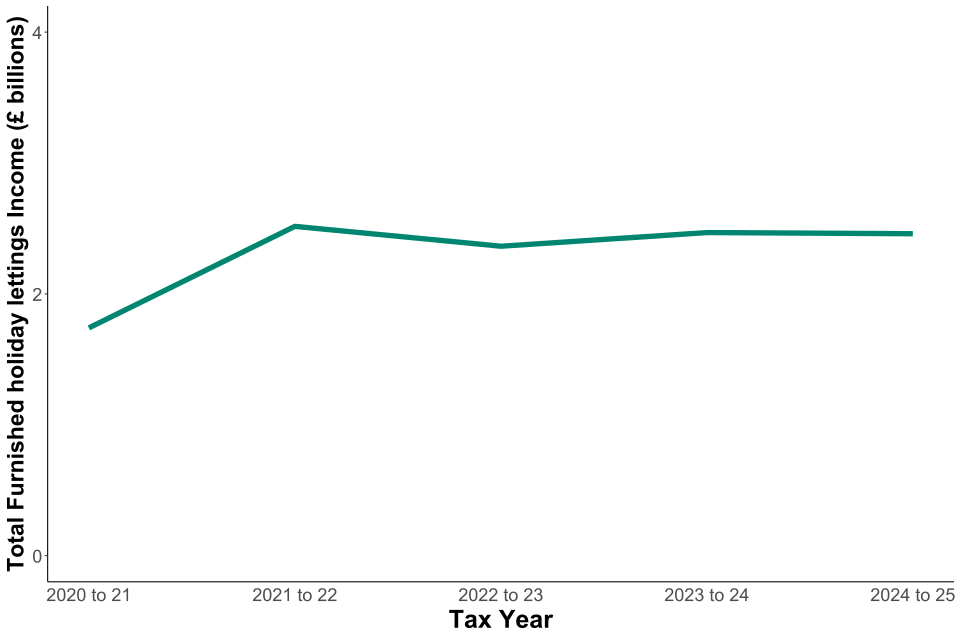
Figure 3 demonstrates an increase in income between 2020 to 2021 and 2021 to 2022 and a plateau since:
-
total income from UK furnished holiday lettings increased by 45% between 2020 to 2021 and 2021 to 2022, driven by an increase in both average furnished holiday lettings income and the number of individuals reporting furnished holiday letting income, and has since remained relatively stable
-
total income from UK furnished holiday lettings in 2021 to 2022 was £2.52 billion, its highest point in the last 5 years
-
total income from UK furnished holiday lettings in 2024 to 2025 was £2.46 billion, compared with £2.47 billion in 2023 to 2024
The underlying data for figure 3 can be found in the Property income statistics tables
5. Expenses from all UK property
Unincorporated landlords declare allowable expenses to HMRC that are specific to their property business. There are several categories of allowable expenses, which are typically declared separately to one another. Expenses can be declared regardless of whether or not a landlord has also declared income from property.
Table 3: Allowable expenses declared in 2024 to 2025 by category
| Expense Type | No. declaring (millions) | % of landlords declaring | Total declared (£ billions) |
|---|---|---|---|
| Rent, rates & insurance | 1.91 | 66.1 | 3.81 |
| Repairs & maintenance | 1.92 | 66.2 | 6.41 |
| Residential finance costs | 1.15 | 39.8 | 12.82 |
| Non-residential finance costs | 0.10 | 3.3 | 1.33 |
| Legal, management & professional fees | 1.79 | 61.8 | 4.16 |
| Services, including wages | 0.45 | 15.4 | 1.64 |
| Other allowable expenses | 1.16 | 40.1 | 4.58 |
| Total | 2.54 | 87.7 | 34.75 |
The key points from Table 3 are:
-
the most common categories of expenses declared against property income are rent, rates and insurance as well as repairs and maintenance, with 66.1% and 66.2% of unincorporated landlords declaring expenses of these types respectively
-
the largest category of expenses by amount declared is residential finance costs, with £12.82 billion being claimed in 2024 to 2025. This accounts for 37% of all expenses claimed against UK property income by unincorporated landlords
-
87.7% of the total population of unincorporated landlords declared some form of expenses
Note: comparisons with previous editions are affected by a correction to the services expense estimates. Figures reported on the SA105 return were previously omitted from the services expense category. These figures are now included, resulting in higher services expense estimates than those published in earlier editions
Figure 4: Total property expenses declared by unincorporated landlords, 2020 to 2021 to 2024 to 2025
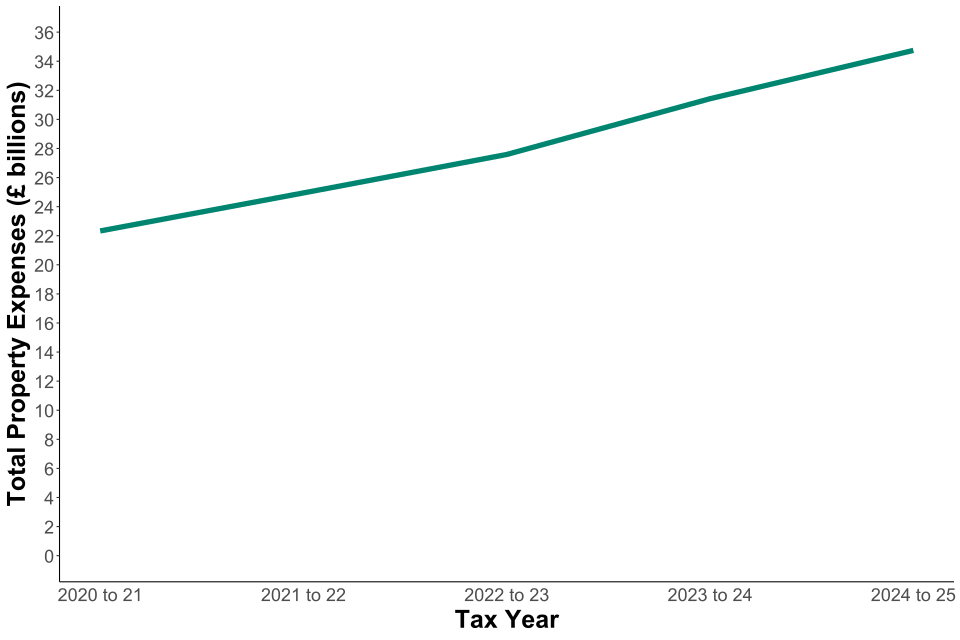
Figure 4 demonstrates a stable upward trend between 2020 to 2021 and 2024 to 2025:
-
overall, total expenses declared by unincorporated landlords increased by £12.42 billion, 56%, between 2020 to 2021 and 2024 to 2025
-
total expenses declared by unincorporated landlords increased by 11% between 2023 to 2024 and 2024 to 2025
The underlying data for figure 4 can be found in the Property income statistics tables
Figure 5: Average property expenses declared per landlord by unincorporated landlords, 2020 to 2021 to 2024 to 2025
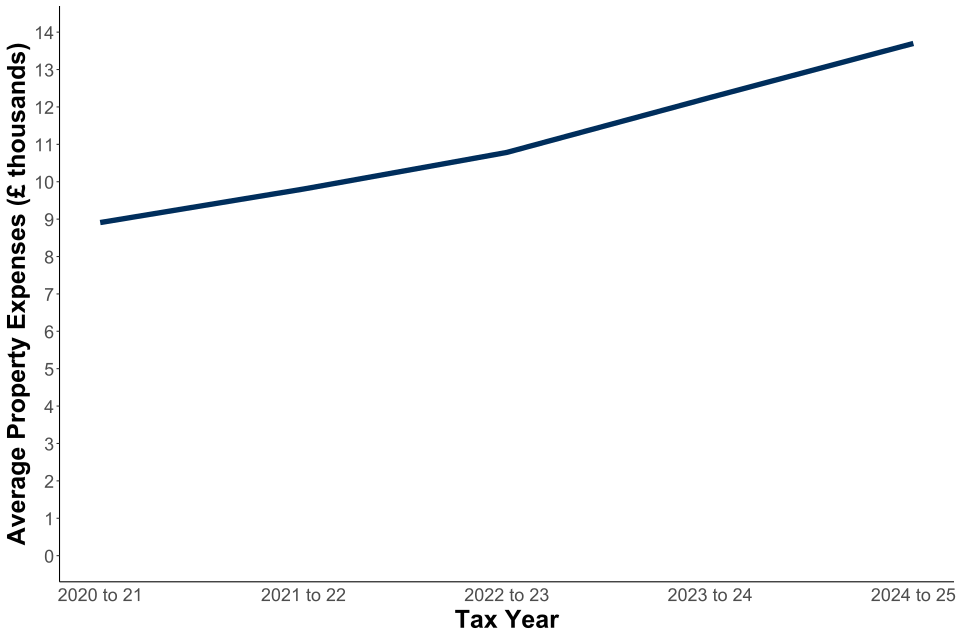
Figure 5 demonstrates a stable upward trend between 2020 to 2021 and 2024 to 2025:
-
the highest average allowable expenses from UK property between 2020 to 2021 and 2024 to 2025 was £13,700 in 2024 to 2025, and the lowest was £8,900 in 2020 to 2021
-
overall, average expenses declared by unincorporated landlords increased by 54% between 2020 to 2021 and 2024 to 2025
-
average expenses declared by unincorporated landlords increased by 12% between 2023 to 2024 and 2024 to 2025
The underlying data for figure 5 can be found in the Property income statistics tables
6. Geographical analysis
Income and Expenses from UK property are broken down by geographical region based on the postcode of the landlord’s registered address. The majority of UK rental property income and expenses are declared by landlords in London and the South East.
This may not be the area where the property is located, which cannot be determined using Self Assessment tax administration data.
Figure 6: Total property income declared by unincorporated landlords by taxpayer address, 2024 to 2025
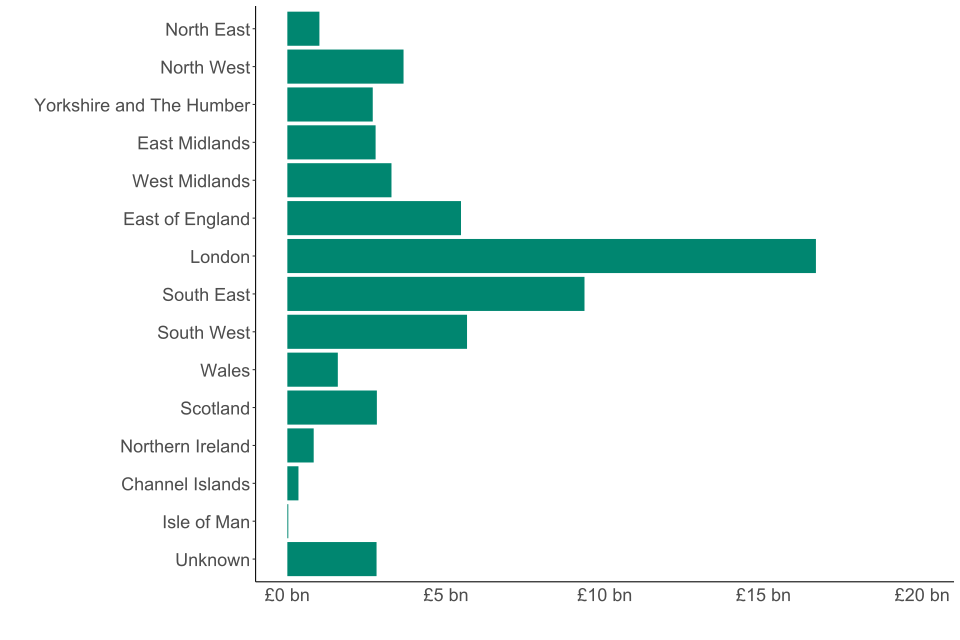
Figure 7: Number of unincorporated landlords reporting property income by taxpayer address, 2024 to 2025
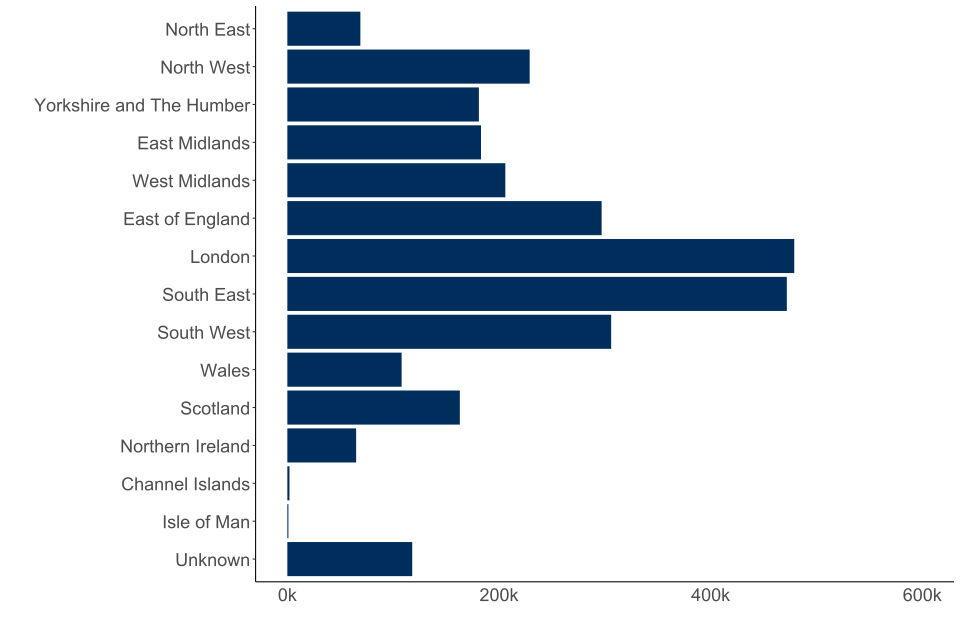
Figures 6 and 7 show a geographical breakdown of property income for 2024 to 2025:
-
in 2024 to 2025, 17% of all unincorporated landlords that declared income from a UK property were based in London. They account for 28% of all income declared from UK property income by unincorporated landlords
-
in 2024 to 2025, 33% of all unincorporated landlords that declared income from a UK property were based in London or the South East combined. They account for 44% of all income declared from UK property income by unincorporated landlords
-
Scotland, Wales, and Northern Ireland accounted for 5%, 3% and 1% of total property income respectively
-
of the regions in England, the North East accounted for the smallest proportion of property income, at 2%
The underlying data for figures 6 and 7 can be found in the Property income statistics tables
Figure 8: Total property expenses declared by unincorporated landlords by taxpayer address, 2024 to 2025
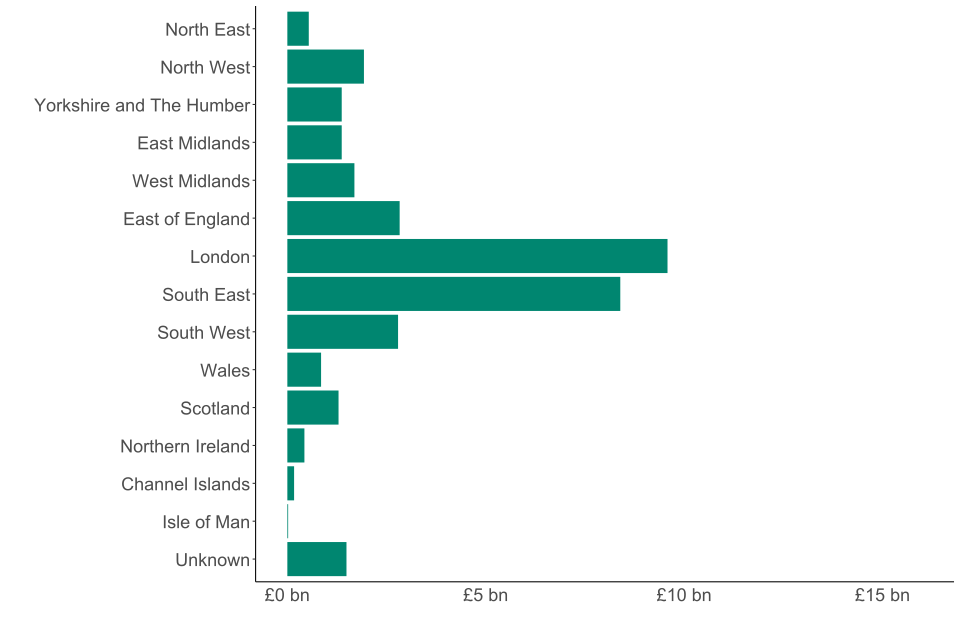
Figure 9: Number of unincorporated landlords declaring property expenses by taxpayer address, 2024 to 2025
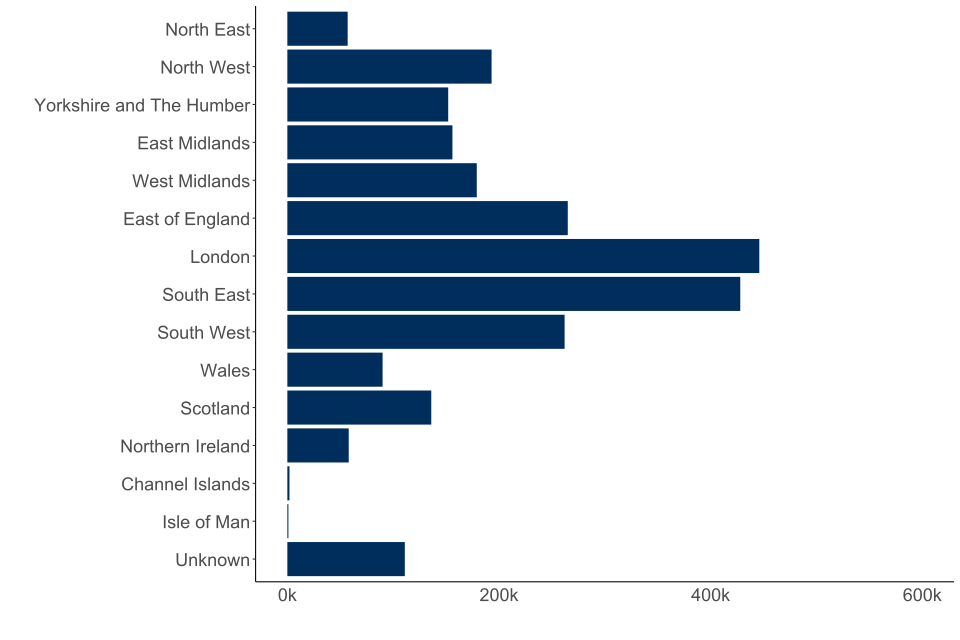
Figures 8 and 9 show a geographical breakdown of allowable property expenses for 2024 to 2025:
-
in 2024 to 2025, 18% of all unincorporated landlords that declared allowable expenses from a UK property were based in London. They account for 28% of all allowable expenses declared from UK property income by unincorporated landlords
-
in 2024 to 2025, 34% of all unincorporated landlords that declared allowable expenses from a UK property were based in London or the South East combined. They account for 52% of all allowable expenses declared from UK property income by unincorporated landlords
-
Scotland, Wales, and Northern Ireland accounted for 4%, 2% and 1% of total property expenses respectively
-
of the regions in England, the North East accounted for the smallest proportion of property expenses, at 2%
The underlying data for figures 8 and 9 can be found in the Property income statistics tables
7. Distribution of property income
The number of unincorporated landlords declaring UK property income is broken down by income bracket based on the landlord’s income from property. Nearly half of the landlords declared property income of £10,000 or below in 2024 to 2025. The income distribution is based only on property income. Landlords may have other forms of income, which are not included here.
Figure 10: Number of unincorporated landlords split by property income band, 2024 to 2025
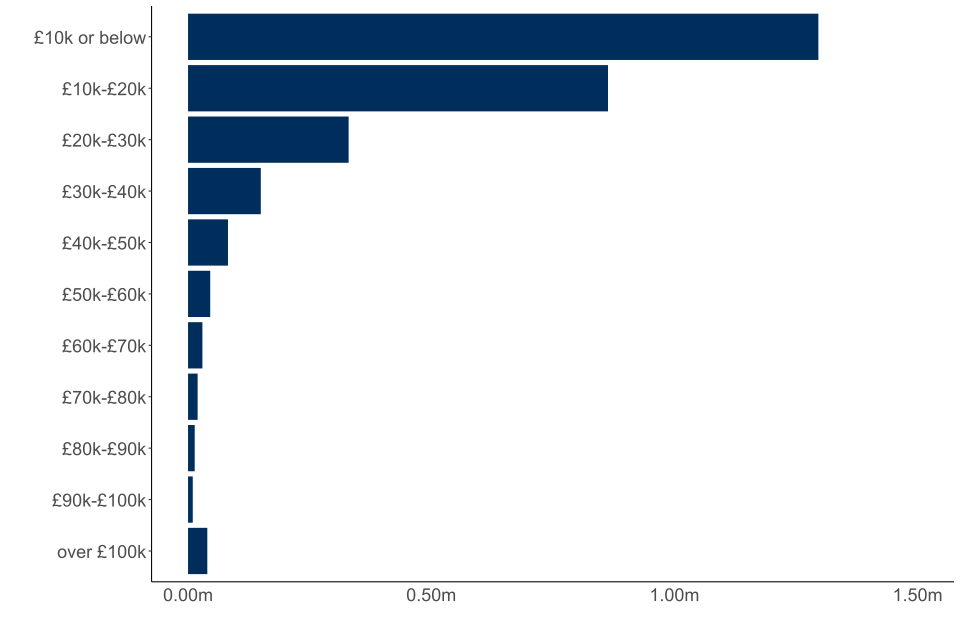
Figure 10 shows a distributional analysis for the UK landlord population in 2024 to 2025:
- 1.3 million earned £10,000 or below of property income in 2024 to 2025.
- this represents 45% of unincorporated landlords that declared UK property income in 2024 to 2025
The underlying data for figure 10 can be found in the Property income statistics tables