Police powers and procedures England and Wales 2010 to 2011: second edition
Published 19 April 2012
Applies to England and Wales

© Crown copyright 2012
This publication is licensed under the terms of the Open Government Licence v3.0 except where otherwise stated. To view this licence, visit nationalarchives.gov.uk/doc/open-government-licence/version/3 or write to the Information Policy Team, The National Archives, Kew, London TW9 4DU, or email: psi@nationalarchives.gov.uk.
Where we have identified any third party copyright information you will need to obtain permission from the copyright holders concerned.
This publication is available at https://www.gov.uk/government/statistics/police-powers-and-procedures-england-and-wales-2010-to-2011-second-edition/police-powers-and-procedures-england-and-wales-2010-to-2011-second-edition
This release draws together statistics on the following topics: arrests for recorded crime; stops and searches under the Police and Criminal Evidence Act 1984 (PACE); breath tests and police action in relation to motoring offences.
Headline figures from the 2010/11 statistics show that in the 12 months to 31 March 2011, the police in England and Wales:
- arrested 1.4 million people, 2% fewer than in 2009/10
- stopped and searched 1.3 million people and/or their vehicles, 8% fewer than in 2009/10
- breath tested 0.7 million people (in 2010), 10% than in 2009
More detailed information, covering a range of police powers and procedures, is available within the following 6 topics:
- Arrests briefing and arrests excel tables are provided on the number of persons arrested for recorded crime in the 12 months to 31 March 2011.
- Detentions briefing and detentions excel tables are provided on the number of persons detained by the police for more than 24 hours in the 12 months to 31 March 2011.
- Stop-search briefing and stop-search excel tables are provided on the number of persons and vehicles stopped and searched, and the number of resultant arrests, in the 12 months to 31 March 2011.
- Road checks briefing and road checks excel tables are provided on the number of road checks and resultant arrests, and the number intimate searches on persons and reasons for these searches, in the 12 months to 31 March 2011.
- Fixed penalty notices briefing and fixed penalty notices excel tables are provided on the number of fixed penalty notices issued for motoring offences in the calendar year 2010.
- Breath tests briefing and breath tests excel tables are provided on the number of screening breath tests carried out, and the proportion that were positive or refused, in the calendar year 2010.
Information about each topic is available in the user guide to police powers and procedures statistics. The guide contains a glossary of terms, notes on interpreting the figures, and information on sources of data on other police powers.
This release replaces the previous Home Office Statistical Bulletin on Police Powers and Procedures. Despite the change in mode of publication the summary text and tables are broadly similar; in addition, manipulable datasets for some topics can now be provided.
0.1 Second edition: corrections
Formulae in Table A.02 were found to be picking up out of date data for 2006/07. The data affected are set out in the errata
Future editions of this annual release will be published on dates announced via the UK Statistics Authority’s Publication Hub: Release Calendar.
1. Arrests
1.1 Introduction
Statistics are presented here on the police powers of arrest. They relate to arrests for notifiable offences only, which form the coverage of recorded crime statistics, and are on a financial year basis. The data are drawn from returns from the 43 local police forces in England and Wales, and cover trends in arrest rates in England and Wales from 2001/02 to 2010/11, as well as breakdowns by offence group, sex and self-defined ethnicity. The Home Office does not receive arrests data from the British Transport Police (BTP).
Figures on arrests reported to the Home Office reflect police activity and should not be used to infer levels of crime committed by offenders, or their specific characteristics.
The user guide provides further details relating to definitions.
1.2 Second edition: corrections
Formulae in Table A.02 were found to be picking up out of date data for 2006/07. The data affected are set out in the errata.
Errors in formulae used to compile arrests data in table A.02 were brought to the attention of the author after publication. The affected figures are set out in the below table.
Errata Table T.02 - Persons arrested for notifiable offences by type of offence and sex, 2006/07.
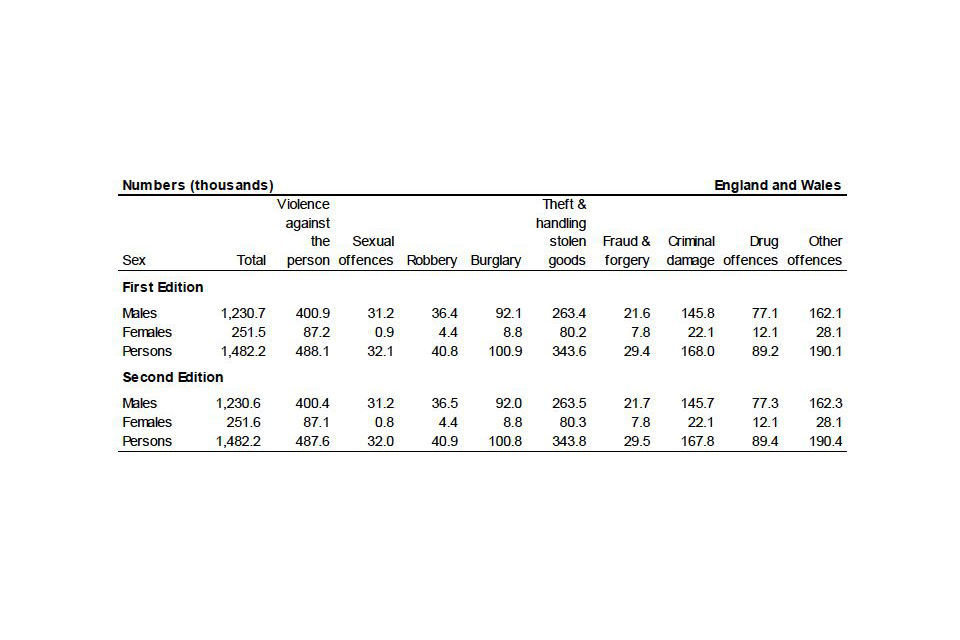
Persons arrested for notifiable offences by type of offence and sex, 2006/07: errata table T.02
1.3 Key facts
The number of persons arrested for notifiable offences fell for the 4th successive year. There was a 2 per cent decrease between 2009/10 and 2010/11, from 1,385,322 to 1,360,451. Recorded crime in England and Wales decreased by 4 per cent over the same period.
Arrests for violence against the person fell for the 4th consecutive year, from a ten-year peak of 487,600 in 2006/07 to 431,300 in 2010/11. The 6 per cent fall in arrests for violence against the person between 2009/10 and 2010/11 compares with a 4 per cent fall in the number of violence against the person offences recorded by police.
There were decreases in the number of 10-to-17-year-olds and 18-to-20-year-olds arrested in 2010/11, by 13 per cent (to 210,660) and 4 per cent (to 198,960) respectively.
Number of arrests, England and Wales, 2001/02 to 2010/11
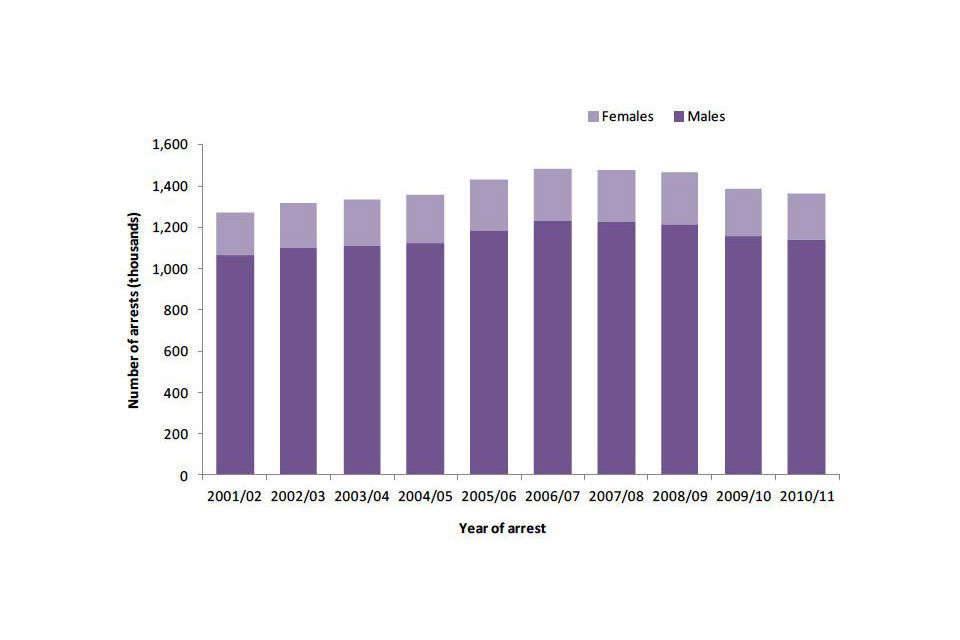
Number of arrests, England and Wales, 2001/02 to 2010/11
Chart notes
Source: Home Office, Arrests table A.01
1.4 Data tables
Data on arrests, sourced from returns received from the 43 police forces in England and Wales, can be found at arrests data tables.
1.5 Arrests by offence group
Decreases in the number of arrests were seen in 4 of the 9 offence groups: criminal damage (down 9%, or 10,927 arrests); fraud and forgery (down 7%, or 2,300 arrests); violence against the person (down 6%, or 25,427 arrests); and theft and handling stolen goods (down 2%, or 4,779 arrests). Despite the decrease in the number of arrests for violence against the person offences, the 431,300 arrests in that category accounted for almost a third of all arrests in 2010/11.
The number of arrests for sexual offences increased for the third consecutive year, and drug offences for the 6th consecutive year.
Arrests for property crime (burglary, theft, fraud and forgery, and criminal damage) accounted for just under 39 per cent (38.8%) of all arrests for notifiable offences in 2010/11, slightly down on the proportion in 2009/10 (39.3%). The number of arrests for property crime fell by 3 per cent to 527,978, the fifth consecutive year a fall has been reported.
Arrests by offence group, England and Wales, change between 2009/10 and 2010/11
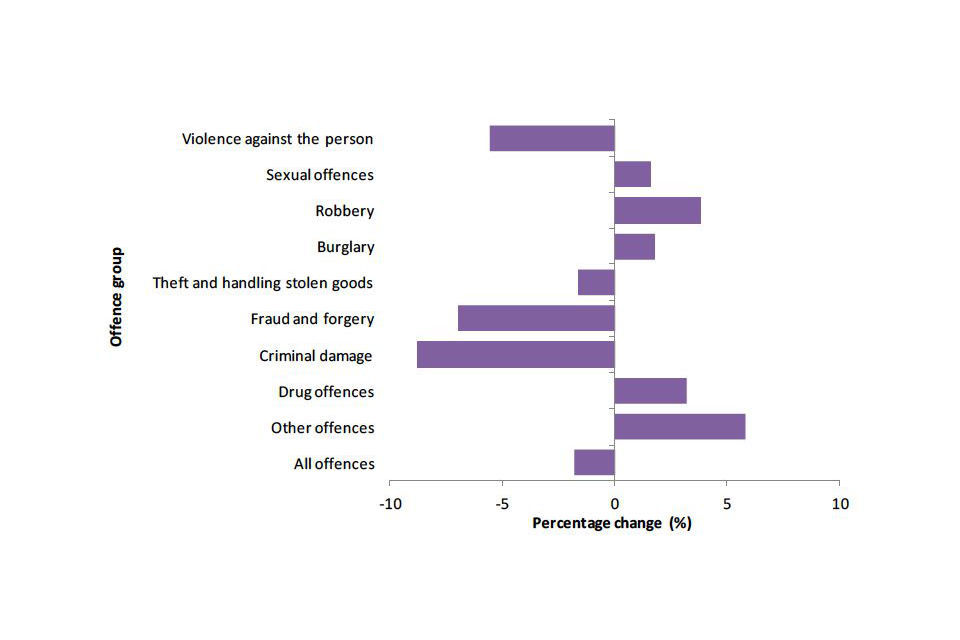
Arrests by offence group, England and Wales, change between 2009/10 and 2010/11
Chart notes
Source: Home Office, Arrests table A.02.
1.6 Arrests by gender and age
As in previous years, the majority of persons arrested for notifiable offences in 2010/11 were male. Since 2001/02 males have consistently accounted for between 83 and 84 per cent of all arrestees.
Arrests of males and females both fell in 2010/11, with male arrests decreasing by 12,976 (1%) to 1,140,497, and female arrests decreasing by 11,895 (5%) to 219,954.
There were decreases in the number of 10-to-17-year-olds and 18-to-20-year-olds arrested in 2010/11, by 13 per cent (to 210,660) and 4 per cent (to 198,960) respectively.
In 2010/11, 70 per cent of both male and female arrestees were aged 21 or over. Persons in this age grouping accounted for the majority of all persons arrested across all offence groups apart from robbery, where they accounted for 37 per cent.
1.7 Arrests by police force area
Thirteen police forces recorded increases in the number of arrests for notifiable offences in 2010/11, while 30 recorded decreases. The largest percentage increases were in Lincolnshire (up 39%), followed by the City of London (up 18%) and Durham (up 11%). The largest percentage falls were recorded in Gloucestershire (down 25%), followed by the West Midlands (down 16%), North Wales (down 14%) and Kent (down 13%).
The Metropolitan Police Service recorded 17,568 more arrests for recorded crime offences in 2010/11 than in 2009/10 (up 7%). In 2010/11, 19 per cent of all arrests in England and Wales were made by the Metropolitan Police Service, an increase of 2 percentage points from 2009/10.
Arrest rates across police forces in 2010/11 varied widely, from 12 per 1,000 population in Surrey to 40 per 1,000 in Cleveland. The average for England and Wales was 25 arrests per 1,000 population.
1.8 Arrests by ethnicity
Persons arrested are asked to define their ethnicity. For the purposes of this analysis these are grouped into 6 main categories: White; Black (or Black British); Asian (or Asian British); Chinese or Other; Mixed; and not stated.
Number and proportion of arrests by ethnicity, 2009/10 and 2010/11
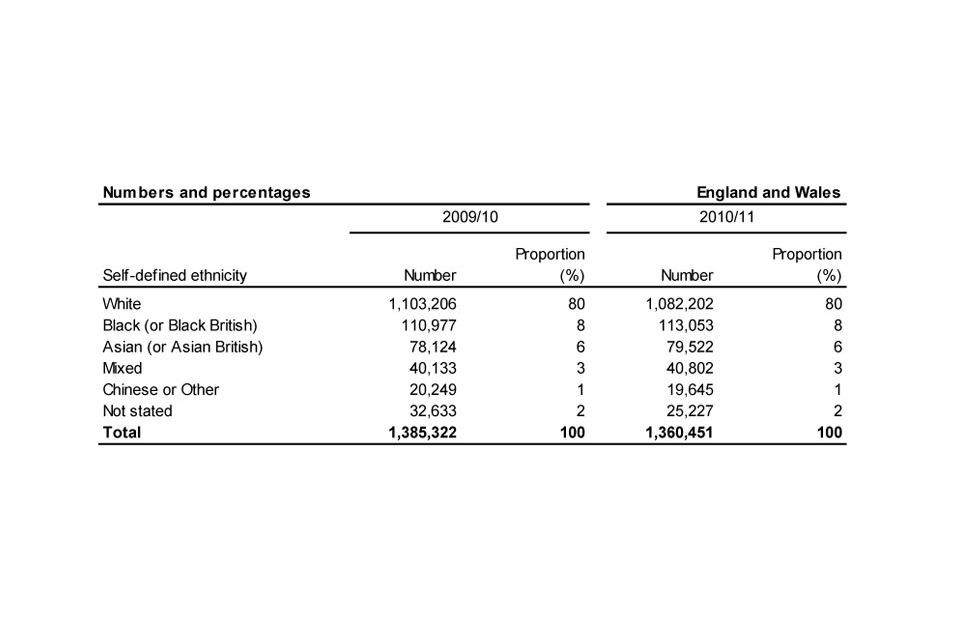
Number and proportion of arrests by ethnicity, 2009/10 and 2010/11
Chart notes
Source: Home Office, Arrests table A.05.
Eighty per cent of persons arrested in England and Wales in 2010/11 defined themselves as White. A further 8 per cent defined themselves as Black, and 6 per cent as Asian. Smaller proportions of arrested persons defined themselves as being of Chinese or Other (1%) or Mixed (3%) ethnicities. 2 per cent of arrestees did not define their ethnicity. Proportions of arrests by ethnicity in 2010/11 were very similar to those for 2009/10.
Some forces, however, recorded larger proportions of arrestees who defined themselves as Black (e.g. Metropolitan, 27%; West Midlands, 12%; Bedfordshire, 10%) or Asian (e.g. Leicestershire, 12%; West Yorkshire, 11%) than for England and Wales as a whole. And a much lower proportion of persons arrested by the Metropolitan Police Service defined themselves as White (48%) than compared with all of England and Wales.
1.9 Data quality and interpreting the figures
In January 2011 Dyfed-Powys police brought in a new system for recording arrests and found that the previous system was under-reporting arrests figures for the first 3 quarters of 2010/11. The new system also currently has some outstanding issues with the mapping of some miscellaneous offence codes. Figures for Dyfed-Powys for 2010/11 are, therefore, based on data from the original system for quarters 1 to 3 (1 April to 31 December 2010), and the best available estimates from the new system for quarter 4 (1 January 2011 to 30 April 2011).
It should be borne in mind that figures on sexual offences are heavily influenced by the willingness of victims to report. In 2009/10, police forces reported taking some additional steps to improve the reporting and recording of rape and other sexual offences. Extra guidance for the recording of sexual offences was incorporated into the Home Office Counting Rules from 1 April 2010 and this reflected good practice that the Association of Chief Police Officers (ACPO) had been promoting over the previous year.
In addition, the number of arrests for drug offences is greatly dependent on police activities and priorities, and doesn’t give a reliable indication of trends in the level of drug offending.
Comparisons with recorded crime are limited here to trends over time. As arrests relate to persons and recorded crime to offences, it is not appropriate to compare actual numbers.
Due to the small resident population within the City of London police force area, caution is needed when examining the ethnic breakdown of those arrested by that force. Differences in the proportion of Black or Minority Ethnic arrestees in some police force areas (e.g. Metropolitan, West Midlands) may, in part, reflect the different proportions of ethnic groups in the overall population, including visitors, in those areas.
1.10 Other data sources
Whilst some ethnic breakdowns are provided here, detailed figures and analysis continue to be the responsibility of the Ministry of Justice. The latest edition of their ’Statistics on Race and the Criminal Justice System’ series is online at Race and the criminal justice system.
The Ministry of Justice also publishes data on individuals given an out of court disposal or proceeded against at court in its ‘Criminal Statistics: England and Wales’ quarterly series, the latest of which is online at Criminal justice statistics.
Figures for recorded crime for 2010/11 are available on the Home Office website at Crime in England and Wales 2010/11.
2. Detentions
2.1 Introduction
Under section 42 of the Police and Criminal Evidence Act (PACE) 1984, detention in police custody before charge on the authority of a police officer is normally limited to 24 hours except where the alleged offence is an indictable one, where the maximum is 36 hours. From 20 January 2004, new powers were introduced which enabled a superintendent or above to authorise continued detention for up to 36 hours for all arrestable offences. Additionally, the police can apply to magistrates for warrants of further detention, extending the maximum detention period to 96 hours. With effect from 1 January 2006 the offence coverage was revised to include all indictable offences.
Information about data quality and interpreting the figures is given below. Further details relating to definitions can be found in the user guide.
2.2 Key facts
The overall number of persons detained for more than 24 hours (up to a maximum of 96 hours) under PACE and subsequently released without charge was 3,999 during 2010/11. A like-for-like comparison of those police forces who provided data for both 2009/10 and 2010/11 shows a fall of 6 per cent.
Ninety-four per cent of those detained for more than 24 hours during 2010/11 were released within 36 hours, the same proportion as the year previously.
Warrants of further detention (issued by magistrates) under PACE, which authorise detention without charge, were applied for on 549 occasions during 2010/11. 9ty-five per cent of these warrants were granted. A similarly high proportion of warrants was granted in earlier years.
In 2010/11, 79 per cent of those detained under warrant were charged, an increase of ten percentage points on 2009/10.
2.3 Data tables
Data on detentions, sourced from returns received from police forces in England and Wales, can be found in detentions tables.
2.4 Data quality and interpreting the figures
The presented figures are correct at the time of publication. They may include revisions submitted by forces for the years covered by, and received since the publication of police powers and procedures 2009/10.
Not all forces have been able to provide figures for 2009/10 and/or 2010/11, for example they may not have been able to extract relevant figures from their recording system. Data for the following have, therefore, been excluded when comparing changes over time: Cheshire, Cleveland, Dorset, Hampshire, Northumbria, North Yorkshire, West Midlands, Wiltshire and South Wales.
Figures on police detention are reported to the Home Office for the purposes of monitoring whether police forces are using their powers of further detention appropriately, rather than to ascertain charging rates. As a result, no figures are collected on the number of persons charged after being held for less than 36 hours with no warrant applied for.
Figures on charging rates for when a person is held for more than 36 hours under warrant are collected because, in these instances, persons can be held in police custody for up to 96 hours and it is important to monitor charging rates when persons are held for extended periods of time.
3. Stops and searches
3.1 Introduction
This section looks at stops and searches conducted by police under various legislation, under which police are able to search persons and vehicles without a warrant. A summary of the relevant powers is included in the user guide.
Financial year data on the type and reason for stops and searches, ethnicity of persons stopped and searched and resultant arrests are presented. These are based on returns submitted to the Home Office from police forces in England and Wales including, since 2009/10, the BTP. While BTP’s stop and search data are included in comparisons between 2009/10 and 2010/11, they are excluded from longer-term trends.
Figures reported to the Home Office on stops and searches, and resultant arrests, reflect police activity and should not be used to infer levels of crime.
3.2 Key facts
Police stopped and searched 1,295,133 persons and/or vehicles in 2010/11, a decrease of eight per cent on 2009/10. These comprised:
1,222,378 stops and searches under section 1 of the Police and Criminal Evidence Act (PACE), an increase of four per cent on 2009/10. Nine per cent of the section 1 stops and searches in 2010/11 resulted in an arrest. 60,963 stops and searches in anticipation of violence (under section 60 of the Criminal Justice and Public Order Act 1994), a 49 per cent decrease compared to the previous year. 11,792 stops and searches in order to prevent acts of terrorism (under section 44 of the Terrorism Act 2000), a decrease of 89 per cent on 2009/10.
3.3 Stops and searches by legislation (excluding BTP), 2001/02 to 2010/11
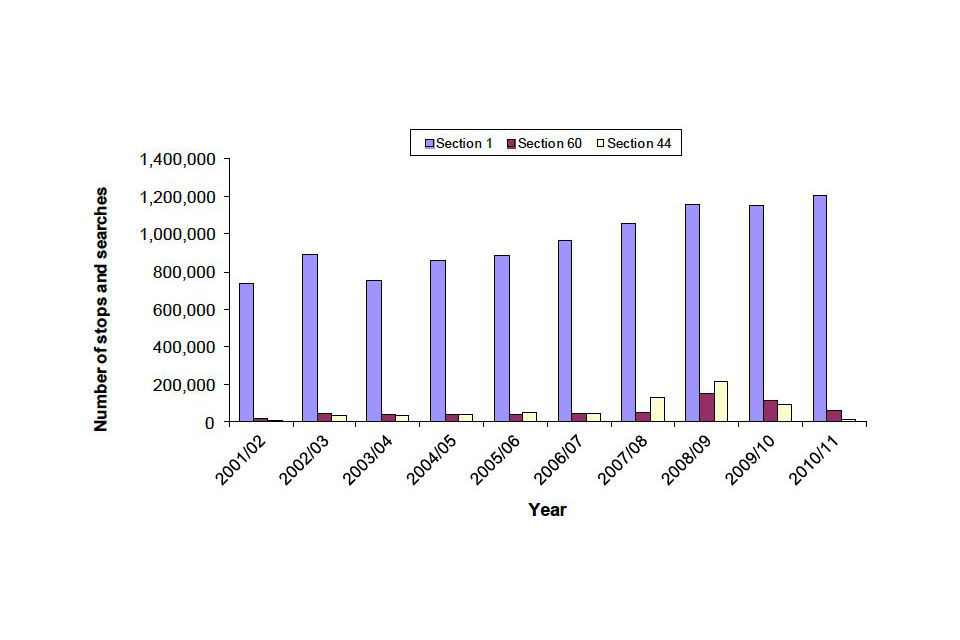
Stops and searches by legislation (excluding BTP), 2001/02 to 2010/11
3.4 Chart notes
Source: Home Office, Stops and Searches table SS.01
Forty-six per cent of all stops and searches in 2010/11 were carried out by the London forces (City of London and Metropolitan Police Service), a slightly smaller proportion than during the previous year (48%).
Ethnicity self-classifications of persons stopped and searched under section 1 of PACE in 2010/11 were of similar proportions across all ethnic groups as in the previous year. The majority (66%) of persons searched under these powers defined themselves as White.
3.5 Data tables
Data sourced from statistical returns received from police forces in England and Wales can be found in the stops and searches tables.
3.6 Section 1 of PACE (and associated legislation)
These give police the power to search persons and/or vehicles for a range of items including stolen property, offensive weapons, controlled drugs or evidence that a person is a terrorist.
Stops and searches under section 1 of PACE increased from 1,177,327 in 2009/10 to 1,222,378 in 2010/11, up four per cent.
Ninety-nine per cent of the 1,222,378 searches conducted throughout England and Wales under section 1 of PACE in 2010/11 were of persons, the same proportion as seen in 2009/10.
Excluding data for Dyfed-Powys and Devon and Cornwall (see section on data quality and interpreting the figures), the articles most commonly searched for in 2010/11 were drugs (50% of the total), and stolen property (20%). These had also been the most commonly searched for articles in 2009/10. There were increases in four of the seven categories of reason for search in 2010/11. The largest percentage increase was recorded for stolen property (up 11% to 234,847), while the biggest percentage decrease was recorded for criminal damage, which fell by 15 per cent (to 17,940).
In 2010/11 the number of arrests following a stop and search rose by six per cent to 113,676. At nine per cent, the proportion of people arrested following a stop and search in 2010/11 remained the same as in 2009/10.
Excluding data for Dyfed-Powys and Devon and Cornwall, the majority of arrests resulting from stops and searches in 2010/11 were for drugs (40,933) and stolen property (28,661). These accounted for 37 per cent and 26 per cent of the resultant arrests respectively.
3.7 Section 60 of the Criminal Justice and Public Order Act 1994
Under section 60 of the Criminal Justice and Public Order Act 1994 police have powers to stop and search persons and/or vehicles in anticipation of violence.
There were 60,963 such searches carried out in 2010/11 compared to 119,973 in 2009/10, a decrease of 49 per cent.
Excluding figures from the BTP, the number of section 60 searches in 2008/09 was almost triple that for 2007/08. This large increase coincided with two initiatives aimed at reducing knife crime – Operation Blunt 2, launched by the Metropolitan Police Service on 19 May 2008, and the Home Office’s Tackling Knives Action Programme, launched in June 2008. The number of section 60 searches in England and Wales (excluding BTP) in 2010/11 was more similar to the levels recorded before the above initiatives were launched.
Thirty-seven forces are recorded as having used section 60 stops and searches in 2010/11, compared to 39 forces in 2009/10. The proportion of stops and searches resulting in an arrest under these powers varied across the forces; overall, two per cent led to an arrest in 2010/11, the same proportion as in 2009/10.
The vast majority (99.9%) of the 60,963 searches conducted under section 60 in 2010/11 were of persons. Only 85 were of vehicles.
3.8 Section 44 of the Terrorism Act 2000
Section 44 of the Terrorism Act 2000 provided police officers with the power to stop and search persons and vehicles (within a particular area during an agreed period without the need of reasonable suspicion) for articles that could be used in connection with terrorism. The majority of police forces that regularly authorised the use of section 44 powers ceased using them following the Home Secretary’s statement on 8 July 2010. These powers differed from searches conducted under section 43 of the Terrorism Act 2000, where the police officer does not need such authorisation but instead reasonable suspicion that the suspect is a terrorist. Such searches are grouped under section 1 PACE “other reason” searches. Further information about stop and search powers under the Terrorism Act 2000 can be found in the user guide.
Nine forces carried out stops and searches to prevent acts of terrorism in 2010/11, compared with 13 in 2009/10. The 11,792 section 44 searches in 2010/11 was down 89 per cent on the 108,685 conducted in 2009/10. This decrease coincided with the repeal of section 44 and the introduction of its replacement, section 47A.
Eighty-four per cent (9,913) of the 2010/11 section 44 searches were conducted by the Metropolitan Police Service and a further seven per cent (798) were conducted by the BTP. The majority of section 44 searches (9,727, or 82%) were of persons.
Seventy-nine (0.7%) of all section 44 searches in 2010/11 resulted in an arrest, compared to 517 (0.5%) in the previous year. None of the 2010/11 arrests were for terrorist offences.
3.9 Geographical patterns
Forty-six per cent of all stops and searches in England and Wales were conducted by the Metropolitan Police Service. A further 14 per cent were conducted by four others (Greater Manchester, Merseyside, Thames Valley and Northumbria).
Nine per cent of all searches in 2010/11 in England and Wales led to an arrest. Police forces with the highest proportion of arrests were Northumbria (19%), Cheshire and Staffordshire (both 16%). Devon and Cornwall had the lowest proportion at five per cent.
There were 23 searches per 1,000 population throughout England and Wales in 2010/11. Rates for police forces varied widely, from four searches per 1,000 population by Essex Police, to 76 per 1,000 population in the area covered by the Metropolitan Police Service.
3.10 Ethnicity of persons searched
Police ask persons being stopped and searched to define their ethnicity. For the purposes of this analysis, ethnicities are grouped into six main categories: White; Black (or Black British); Asian (or Asian British); Chinese or Other; Mixed; and, not stated.
Self-classifications of persons stopped and searched under section 1 of PACE in 2010/11 were of similar proportions across all ethnic groups as compared to the previous year. In 2010/11, 66 per cent of the persons defined themselves as White, 15 per cent as Black and ten per cent as Asian. Smaller proportions defined themselves as Chinese or Other (1%) or Mixed (3%). The ethnicity for four per cent of persons was not stated.
However, a large proportion of section 1 stops and searches were conducted by the Metropolitan Police Service, and these have had considerable effect on the proportions for England and Wales as a whole. Excluding stops and searches by the Metropolitan Police Service, the vast majority of persons searched under section 1 in England and Wales were White (84%); very small proportions were Asian (6%) or Black (4%). In contrast, of the persons searched under section 1 by the Metropolitan Police Service, 43 per cent defined themselves as White, 30 per cent as Black and 16 per cent as Asian. Proportions of persons searched by the Metropolitan Police Service who defined themselves as Mixed (4%) or Chinese or Other (3%) were similar to those seen in other forces in England and Wales (2% and 1% respectively).
Fifty-two per cent of the stops and searches conducted by the Metropolitan Police Service were on Minority Ethnic persons, compared to 13 per cent across all other forces. This in part is explained by both the high population density and the high Minority Ethnic populations (resident and visitor) within the Metropolitan Police Service area.
Nine per cent of the section 1 stops and searches in 2010/11 resulted in an arrest. There was little difference between the proportions across the ethnic groupings, ranging from seven per cent for those defining themselves as Asian and 11 per cent defining themselves as Chinese or Other.
3.11 Data quality and interpreting the figures
Data presented here have been sourced from annual statistical returns received from police forces in England and Wales including, since 2009/10, the BTP. Data from the BTP are included in comparisons between 2009/10 and 2010/11 stops and searches, though are excluded from longer-term trends.
The presented figures are correct at the time of publication. They may include revisions submitted by forces for the years covered by, and received since the publication of, police powers and procedures 2009/10.
Two forces – Dyfed-Powys and Devon and Cornwall – have reported that their recording systems do not allow them to accurately categorize section 1 stops and searches at the current time, resulting in them including a higher number of searches than other forces in the ‘other’ category. Tables SS.01 to SS.03 present the figures as received from these forces. While the total numbers of section 1 stops and searches for these forces are included in the overall comparison between 2009/10 and 2010/11, all of their figures have been excluded in the analysis of searches by reason for search and subsequent arrests by reason for arrest. Efforts are being made to resolve this issue for the ‘Police Powers and Procedures 2011/12’ release.
Due to the relatively small numbers of persons stopped and searched under section 60 of the Criminal Justice and Public Order Act 1994 and section 44 of the Terrorism Act 2000, caution is needed when examining the ethnic breakdown of those arrested as result of such stops and searches. In addition, differences in the proportion of Black or Minority Ethnic persons stopped and searched in some police force areas (e.g. Metropolitan, West Midlands) may, in part, reflect the different proportions of ethnic groups in the overall population, including visitors, in those areas.
This release does not include police stop and account statistics, which have previously been published by the Ministry of Justice. However, as the police are no longer required to record stops and accounts, this data collection is ceasing from 2011/12.
The user guide provides further details relating to definitions, legislation and procedure.
3.12 Other data sources
Quarterly figures for stops and searches under the Terrorism Act 2000 (including data relating to section 43 searches under the Terrorism Act 2000 but excluding section 44 searches of vehicles) appear in the Home Office Statistical Bulletin Operation of police powers under the Terrorism Act 2000 and subsequent legislation: Arrests, outcomes and stops and searches.
Detailed figures and analysis of stops and searches by ethnicity continue to be the responsibility of the Ministry of Justice and will be published as part of their annual publication ‘Statistics on Race and the Criminal Justice System’. The latest release can be accessed via Race and the criminal justice system.
4. Road checks and intimate searches
4.1 Introduction
This section covers the use of police powers, under sections 4 and 55 of the Police and Criminal Evidence Act (PACE) 1984, to conduct road checks and intimate searches. It examines the number of times these powers were used, the number of arrests resulting from road checks, reasons for intimate searches and the results of such searches. The presented data are drawn from returns from police forces in England and Wales, excluding the BTP, and are on a financial year basis.
Further details relating to definitions, legislation and procedures are given in the user guide.
4.2 Key facts
A total of 29 road checks were carried out in 2010/11, 8 more than in 2009/10. They were conducted within 9 police force areas, compared to ten the year before.
- The total number of vehicles recorded as having been stopped in road checks was 3,566 in 2010/11, down 40 per cent (or 2,374 vehicles) on 2009/10. The number has decreased year on year since 2007/08, when 7,200 vehicles were stopped.
- An average of 123 vehicles were stopped in each road check in 2010/11, compared with 283 in 2009/10.
- As in previous years, the majority of road checks in 2010/11 were conducted to ascertain whether a vehicle was carrying a person who had witnessed an indictable offence.
- The number of arrests made as a result of road checks remains relatively low. There were 2 such arrests in 2010/11, both of which were connected with the reason for the road check.
Ninety-four intimate searches were carried out in 2010/11, 8 more than during the previous year.
- Drugs accounted for 90 per cent of known reasons for intimate searches in 2010/11 compared to 87 per cent in 2009/10.
- In 2010/11, class A drugs (mainly heroin, other opiate drugs, LSD and cocaine) were found during 20 per cent of the intimate searches made for drugs compared to 13 per cent in 2009/10.
- As in the previous 2 years, searches for harmful articles in 2010/11 resulted in no such objects being found.
4.3 Data tables
Data sourced from statistical returns submitted by police forces in England and Wales are available at road checks and intimate searches tables.
4.4 Data quality and interpreting the figures
The presented figures are correct at the time of publication. They may include revisions submitted by forces for the years covered by, and received since the publication of, police powers and procedures 2009/10.
For 2010/11, 6 forces were unable to supply road checks data (Cambridgeshire, Dorset, Gloucestershire, Hampshire, Nottinghamshire and Wiltshire), and 4 were unable to supply intimate searches data (Dorset, Gloucestershire, Kent and Wiltshire).
For intimate searches, data on searches conducted include only those where data on who conducted the search are available.
The user guide provides further details relating to definitions, legislation and procedures, and data quality.
5. Fixed penalty notices
5.1 Introduction
This section covers the use of police powers to issue fixed penalty notices (FPNs) issued for endorsable and non-endorsable motoring offences. It looks at FPNs by offence type and how they were dealt with (e.g. penalty paid or a fine registered at court). The presented data are drawn from returns from police forces in England and Wales.
Following a review on reducing the data burdens on police forces in England and Wales and a public consultation under National Statistics procedures, data on written warnings and Vehicle Defect Rectification Scheme (VDRS) notices are no longer collected or published by the Home Office.
The user guide has further information relating to definitions, legislation and procedure.
5.2 Key facts
There were 1.8 million FPNs for motoring offences issued by the police (including traffic wardens) in 2010, a ten per cent decrease on 2009. FPNs issued for endorsable and non-endorsable offences both fell, by 8 per cent and 14 per cent respectively. Since peaking at 3.5 million in 2003 there have been year-on-year decreases in the total number of FPNs issued.
- The largest increase in percentage terms (up 70%) was seen in the other offences category, which includes load offences (e.g. dangerous loads or exceeding the axle weight) and offences peculiar to motor cycles (e.g. failure to wear a crash helmet), though the 9,914 FPNs issued in 2010 accounted for less than one per cent of the total issued. The largest decrease was for obstruction, waiting and parking offences (down 25%).
- The largest increase in numerical terms was for vehicle test and condition offences (up 8,026 offences). The largest decrease was for speed limit offences (down 90,744 offences), though the 986,744 FPNs issued for such offences accounted for more than half of all FPNs issued in 2010.
- There was a slight fall in the issue of FPNs for using a handheld mobile phone while driving (down 790 offences, or 0.6%).
Trend in endorsable and non-endorsable fixed penalty notices, 2001 to 2010
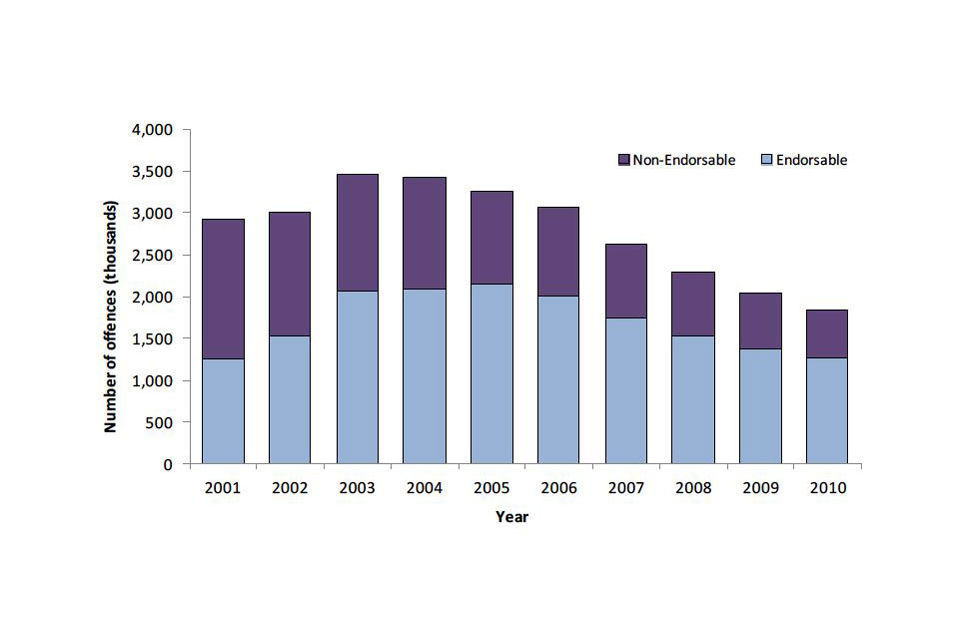
Trend in endorsable and non-endorsable fixed penalty notices, 2001 to 2010
Chart notes
Source: Home Office, Fixed Penalty Notices table FPN.01
5.3 Data tables
Data sourced from statistical returns received from the 43 police forces in England and Wales, can be found in the fixed penalty notices tables. Those in list format cover the years 2007 to 2010 only.
5.4 Additional analysis
Eighty-nine per cent of the FPNs issued by the police in 2010 were paid, while a fine was automatically registered at court for a further 8 per cent. The proportion of both of these outcomes has remained relatively stable since 2005.
FPNs are more likely to be paid for endorsable offences. In 2010, 97 per cent of those issued for endorsable offences were paid without further enforcement, compared with 72 per cent of those issued for non-endorsable offences where the driver was present and 76 per cent of those issued for non-endorsable offences where the driver was absent.
Fixed penalty notices by result, 2001 to 2010
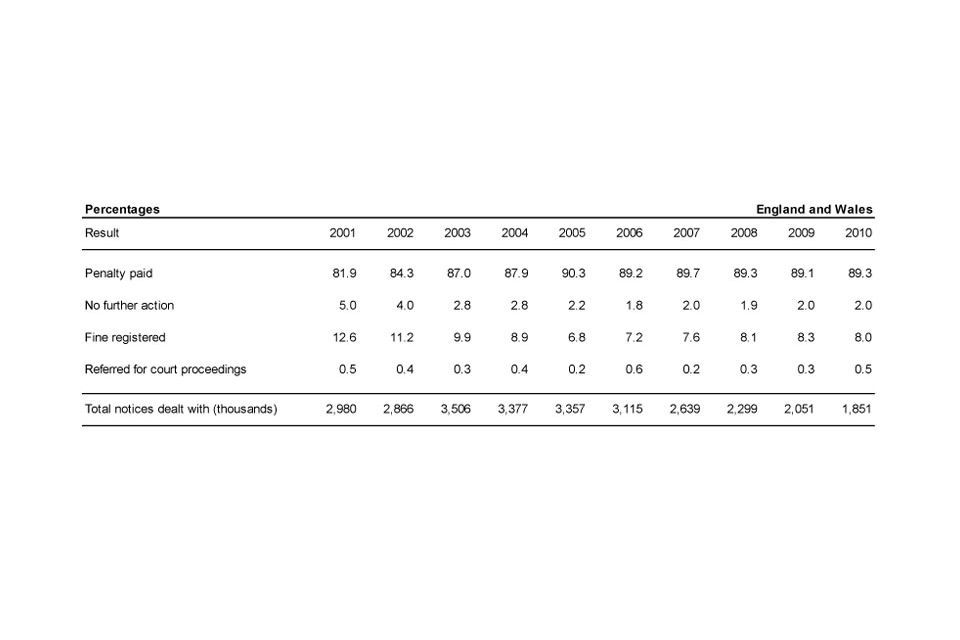
Fixed penalty notices by result, 2001 to 2010
Source: Home Office, Fixed Penalty Notices table FPN.04
There were 853,924 FPNs issued for camera-detected traffic light and speeding offences in 2010, a 12 per cent decrease compared to 2009 (975,490 offences). The majority of these FPNs (92%) were for speeding offences. Cameras provided evidence for 79 per cent of all speeding offence FPNs issued in 2010.
5.5 Data quality and interpreting the figures
The presented figures are correct at the time of publication. They may include revisions submitted by forces for the years covered by, and received since the publication of, police powers and procedures 2009/10.
The National Safety Camera Programme was launched nationally in August 2001. This allowed fixed penalty income from speeding and red traffic light offences to be used to meet the costs of operating the cameras.
On 15 December 2005 the Secretary of State for Transport announced the ending of the National Safety Camera Programme and netting-off funding arrangement for cameras in England and Wales, with effect from March 2007. Camera funding, activities and partnerships were integrated into the wider road safety delivery process from 1 April 2007. Further changes to funding arrangements to increase flexibility were introduced in 2010 and April 2011.
Instead of offering a fixed penalty notice to those who exceed the speed limit but do not require prosecution, forces can use their discretion to offer a speed awareness course. Those who accept the offer and complete the course, at their own expense, are not subject to any other sanction. The majority of forces in England and Wales now offer such courses. These initiatives should be borne in mind when interpreting changes over time.
The user guide provides further details relating to definitions, legislation and procedure, and data quality.
5.6 Other data sources
In addition to FPNs for motoring offences, police officers can also issue FPNs for minor disorder offences under the penalty notice for disorder (PND) scheme, which includes possession of cannabis, alcohol consumption and licensing offences. Data on PNDs are collected and published by the Ministry of Justice in its ‘Criminal Statistics: England and Wales’ quarterly series, available online at criminal justice statistics. This series also contains figures on court proceedings for motoring offences.
Information on Penalty Charge Notices issued by local authorities is dealt with by the Department for Transport (DfT) and can be accessed online at civil parking enforcement
6. Breath tests
6.1 Introduction
This section covers the use of police powers, under the Road Traffic Act 1988, to conduct roadside breath tests to determine whether motorists are driving with alcohol in their body, beyond the prescribed limit. It examines the regional and seasonal use of such powers, as well as the number of motorists who either fail or refuse breath tests. The data presented in this chapter are drawn from returns from police forces in England and Wales and relate only to roadside breath tests (hereafter referred to as ‘breath tests’).
Further details relating to definitions, legislation and procedure are given in the user guide.
6.2 Key facts
Police carried out 733,088 breath tests in 2010 compared to 814,207 in 2009. This ten per cent decrease followed increases in the previous 2 years.
The number of positive or refused tests in 2010 also decreased by ten per cent, from 93,232 in 2009 to 83,932 in 2010.
Eleven per cent of all breath tests in 2010 were refused or gave a positive result, the same proportion as in the previous 12 months.
Trend in breath tests, 2001 to 2010
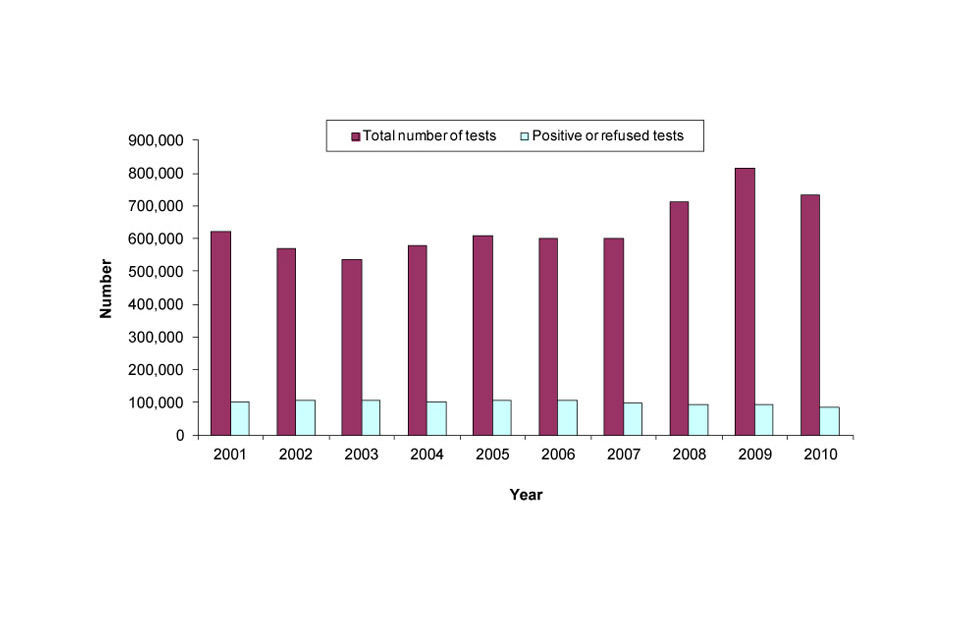
Trend in breath tests, 2001 to 2010
Chart notes
Source: Home Office, Breath Tests table BT.01
6.3 Data tables
Data sourced from statistical returns received from the 43 police forces in England and Wales can be found in the breath test tables.
6.4 Seasonal variations
Twenty per cent of all breath tests in 2010 were conducted during December, which coincides with the annual national Christmas drink and driving campaign. The number of breath tests carried out during December was almost 3 times more than the average number carried out in other months.
The proportion of breath tests conducted in June (14% of total tests) was also higher than in other months. This is likely to be due to police campaigns against drinking and driving during the summer months.
However, the proportions of breath tests resulting in positive readings or refused during June (7%) and December (5%), were lower than in other months (13 to 16%).
6.5 Geographical patterns
In 2010, 13 breath tests were conducted per 1,000 population across England and Wales; the rate for Wales (30 per 1,000 population) was more than twice of that for England (12 per 1,000 population). There was a big variation in the number of tests carried out per 1,000 of the population by individual police forces, from one in West Midlands to 41 in Dyfed-Powys and 43 in North Wales.
The number of breath tests per 1,000 of the population that were positive or refused averaged 1.5 throughout England and Wales, though were not as varied as the total number of breath tests by police force level. The rate of positive or refused tests ranged from 0.9 per 1,000 population in both Northumbria and Avon and Somerset to 3.3 per 1,000 population in Norfolk.
6.6 Data quality and interpreting the figures
The presented figures are correct at the time of publication. They may include revisions submitted by forces for the years covered by, and received since the publication of, police powers and procedures 2009/10.
From April 2008, new digital recording equipment started to be used by forces. The devices are able to record exact breath alcohol readings and the result of individual tests, as well as reason for test, time of day, day of week and age and gender profiles of those tested, and results are downloaded to data systems on a monthly basis and provided to the DfT.
Data presented here have been sourced from annual statistical returns received from the 43 police forces in England and Wales. Some of the forces’ returns for 2010 were based on the figures from the digital devices, others have supplied data from manual recording systems. Negative breath tests may previously have been under-reported to the Home Office; it is anticipated that, as more forces use data from the digital devices, this will lead to an improvement in data recording practices by forces.
The user guide provides further details relating to data quality and interpreting the figures.
6.7 Other data sources
Analysis of reported roadside breath alcohol screening tests, based on data from digital breath testing devices, is published by the DfT. Latest figures were included within the DfT’s Reported Road Casualities in Great Britain: 2010 Annual Report.
The ACPO publishes an annual press release showing the number of persons arrested during the Christmas drink and drug driving campaign, 1 December 2010 to 1 January 2011.