Planning Inspectorate statistical release 25 January 2024
Updated 25 January 2024
Applies to England

© Crown copyright 2024
This publication is licensed under the terms of the Open Government Licence v3.0 except where otherwise stated. To view this licence, visit nationalarchives.gov.uk/doc/open-government-licence/version/3 or write to the Information Policy Team, The National Archives, Kew, London TW9 4DU, or email: psi@nationalarchives.gov.uk.
Where we have identified any third party copyright information you will need to obtain permission from the copyright holders concerned.
This publication is available at https://www.gov.uk/government/statistics/planning-inspectorate-statistical-release-25-january-2024/planning-inspectorate-statistical-release-25-january-2024
1. Introduction
This statistical release provides summary information on appeals, which represent the highest volume (in terms of number of cases) of the Planning Inspectorate’s work.
These statistics are produced each month and the focus is on timeliness of decision-making, an area of particular interest for stakeholders. Information on the decisions that have been made is also included; and on the number of Inspectors available to make those decisions.
These statistics have been published to ensure everyone has equal access to the information and to support the Planning Inspectorate’s commitment to release information where possible.
This statistical bulletin provides: - Appeals decisions and events held from January 2023 to December 2023 - The time taken to reach decisions - Number of open cases - Number of Inspectors
1.1 The Planning Inspectorate
The Planning Inspectorate makes decisions and provides recommendations and advice on a range of land use and planning-related issues across England.
The Planning Inspectorate deals with planning appeals, national infrastructure planning applications, examinations of local plans and other planning-related and specialist casework in England. The Planning Inspectorate is an executive agency, sponsored by the Department for Levelling Up, Housing and Communities.
1.2 Summary
Time to decide cases
The median decision time for cases decided in December was 29 weeks.
Median timeliness by procedure type is shown in the summary table below.
| Procedure type | Last 12 months | December 2023 |
|---|---|---|
| Written Representations | 30 weeks | 29 weeks |
| Hearings | 37 weeks | 34 weeks |
| Inquiries | 55 weeks | 68 weeks |
| All Cases | 31 weeks | 29 weeks |
The median time for planning cases was 28 weeks in December 2023. The 12 month median was 29 weeks.
Enforcement decisions made in December 2023 had a median decision time of 59 weeks, with the 12 month median being 55 weeks.
The median time for planning appeals decided by inquiry under the Rosewell Process in November was 29 weeks and over the 12 months to December 2023 was 30 weeks.
Decisions
The Planning Inspectorate made 18,310 appeal decisions in the last 12 months, an average of 1,526 per month. The number of decisions in December 2023 was 1,428.
There were 1,315 written representations decisions in December 2023 and 16,974 in the last 12 months.
There were 801 decisions made on hearings during the last 12 months, and during December 2023, 65 decisions were issued.
There were 535 decisions made on inquiries during the last 12 months, with 48 in December 2023.
Planning Inspectors
There were 426 Planning Inspectors employed by the Inspectorate at the end of December 2023.
2. Decisions, Events and Open Cases
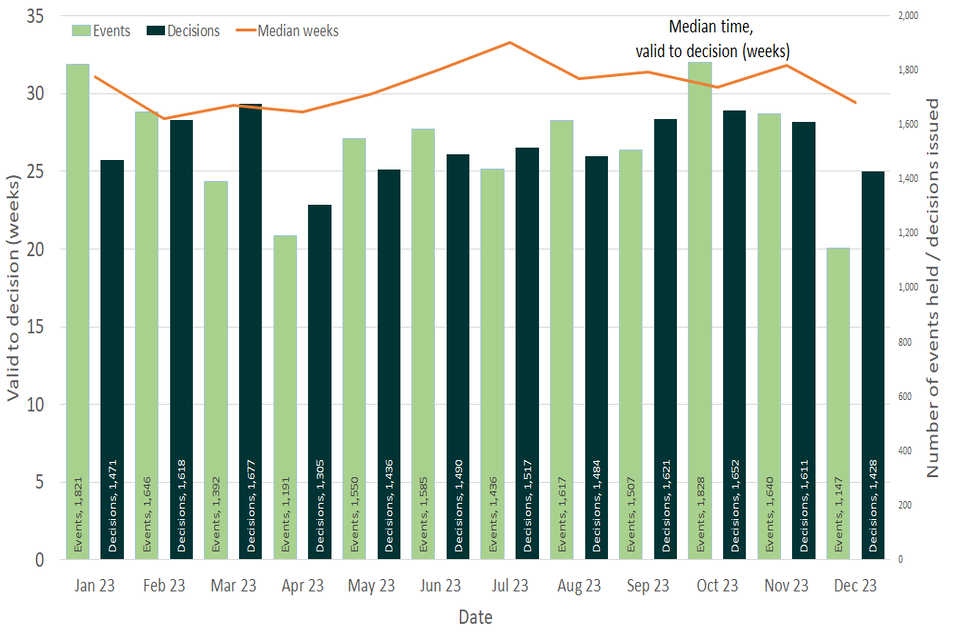
The number of decisions issued in December 2023 was 1,428, with a monthly average of 1,526 over the past 12 months.
The number of events recorded for December 2023 was 1,147, the average over the past 12 months was 1,530.
The median valid to decision time was 29 weeks in December 2023, as seen in Figure 1 and Table 1 below. The median valid to decision time has dropped slightly (2.4 weeks lower than November).
There are no clear trends for the number of events and decisions per month. However, the Christmas and Easter breaks do impact on the number of events arranged for December and April.
Figure 1: Number of events held , decisions issued and median time between valid date & decision date; January 2023 to December 2023.
Source: Horizon
Table 1: Number of events held, decisions issued and median time between valid date & decision date; January 2023 to December 2023.
| Month | Jan 23 | Feb 23 | Mar 23 | Apr 23 | May 23 | Jun 23 | Jul 23 | Aug 23 | Sep 23 | Oct 23 | Nov 23 | Dec 23 | Total |
|---|---|---|---|---|---|---|---|---|---|---|---|---|---|
| Events Held | 1,821 | 1,646 | 1,392 | 1,191 | 1,550 | 1,585 | 1,436 | 1,617 | 1,507 | 1,828 | 1,640 | 1,147 | 18,360 |
| Decisions | 1,471 | 1,618 | 1,677 | 1,305 | 1,436 | 1,490 | 1,517 | 1,484 | 1,621 | 1,652 | 1,611 | 1,428 | 18,310 |
| Median | 31.1 | 28.4 | 29.3 | 28.9 | 30.0 | 31.6 | 33.3 | 31.0 | 31.4 | 30.4 | 31.9 | 29.4 | 30.7 |
Note: This table includes revisions to previously published data. Please see Annex D for further information
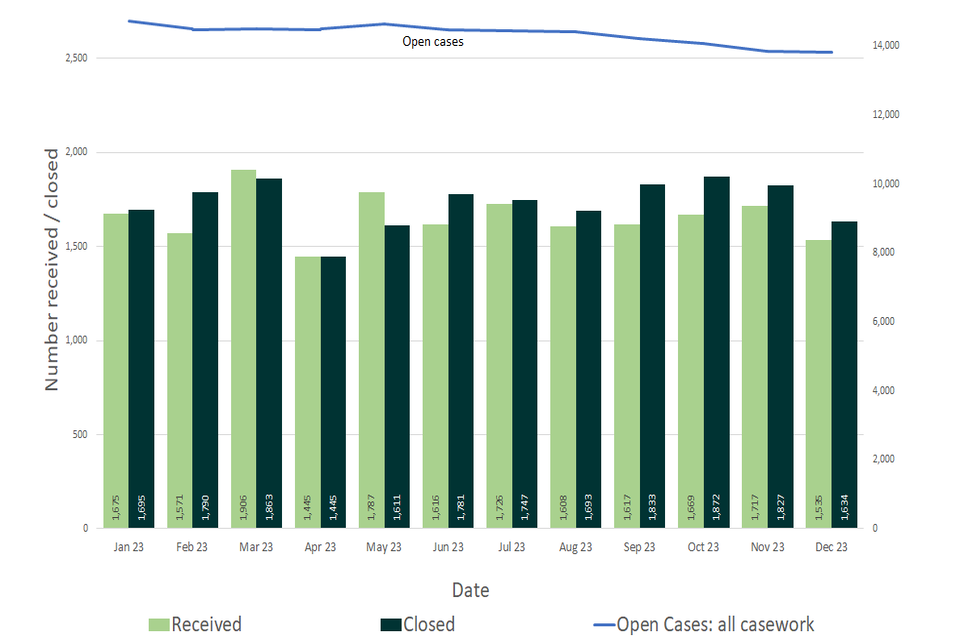
Figure 2 below shows the number of cases received, closed and open for each of the last 12 months. The number of cases closed has exceeded the number of cases received for each of the past seven months.
Note – The number of cases closed is higher than the number of decisions, as it includes cases where an appeal is withdrawn, notice is withdrawn, or the appeal is turned away.
Figure 2: Number of cases received, closed and open; January 2023 to December 2023.
Source: Horizon
Note: there is a known anomaly that means that the number of open cases does not exactly follow the volumes of cases closed or received (for example the number of open cases can increase between months even though the number closed exceeded the number received). The main reasons for this have been identified and are detailed in the Background Quality Report.
Table 2: Number of cases received, closed and open; January 2023 to December 2023.
Note: This table includes revisions to previously published data. Please see Annex D for further information
| Month | Jan 23 | Feb 23 | Mar 23 | Apr 23 | May 23 | Jun 23 | Jul 23 | Aug 23 | Sep 23 | Oct 23 | Nov 23 | Dec 23 | Total |
|---|---|---|---|---|---|---|---|---|---|---|---|---|---|
| Received | 1,675 | 1,571 | 1,906 | 1,445 | 1,787 | 1,616 | 1,726 | 1,608 | 1,617 | 1,669 | 1,717 | 1,535 | 19,872 |
| Closed | 1,695 | 1,790 | 1,863 | 1,445 | 1,611 | 1,781 | 1,747 | 1,693 | 1,833 | 1,872 | 1,827 | 1,634 | 20,791 |
| Open | 14,738 | 14,497 | 14,502 | 14,493 | 14,645 | 14,473 | 14,455 | 14,428 | 14,211 | 14,066 | 13,841 | 13,809 |
Source: Horizon
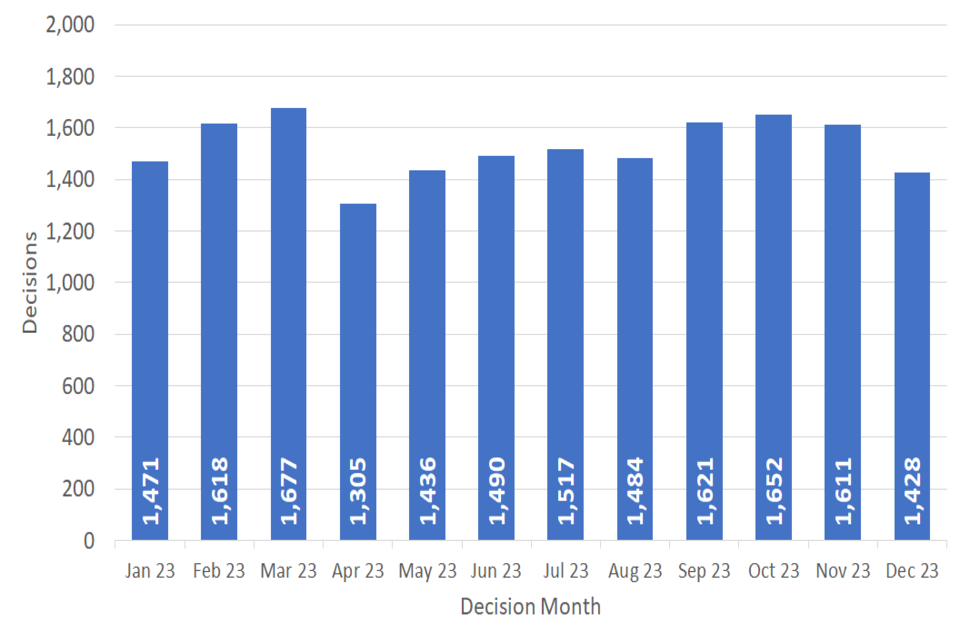
3. Number of Decisions
The Planning Inspectorate has made 18,310 appeal decisions in the last 12 months. There were 1,428 cases decided in December 2023.
Table 3 below shows the monthly breakdown with fewer decisions for the month of April 2023 and September, October and November being among the highest.
Table 3: Appeal Decisions; January 2023 to December 2023.
| Month | Jan 23 | Feb 23 | Mar 23 | Apr 23 | May 23 | Jun 23 | Jul 23 | Aug 23 | Sep 23 | Oct 23 | Nov 23 | Dec 23 | Total |
|---|---|---|---|---|---|---|---|---|---|---|---|---|---|
| Decisions | 1,471 | 1,618 | 1,677 | 1,305 | 1,436 | 1,490 | 1,517 | 1,484 | 1,621 | 1,652 | 1,611 | 1,428 | 18,310 |
Source: Horizon
Figure 3 – Appeal Decisions; January 2023 to December 2023.
Source: Horizon
3.1 Decisions by procedure and case type
Planning Inspectors work on a broader range of work than the appeals featured in this release. For example, they also work on examining Nationally Significant Infrastructure Project applications, Local Plans , Compulsory Purchase Order applications and many other specialist licencing/ application types.
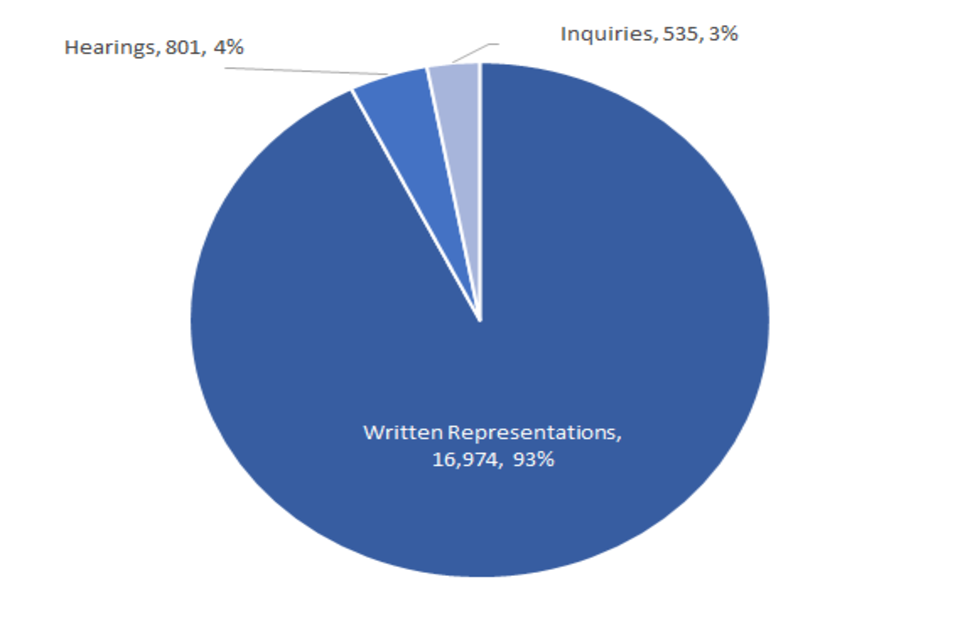
Table 4 below gives the numbers of appeal decisions made broken down by whether the case was dealt with by written representations, hearings, or inquiries.
The large majority of decisions over the past 12 months (16,974) were made on written representations. This is 93% of all appeal decisions made. Table 4 shows that written representation decisions have varied from around 1,220 to around 1,560 per month over the past 12 months. There were 1,315 decisions in December 2023.
There were 801 decisions made on hearings during the last 12 months, the monthly average being 67. During Dcember 2023 65 decisions were issued. In December 2023 48 decisions were made for inquiries. Decisions for inquiries since January 2023 have ranged between 28 and 79.
Table 4: Appeal Decisions by Procedure and Casework Category; January 2023 to December 2023.
| Month | Jan 23 | Feb 23 | Mar 23 | Apr 23 | May 23 | Jun 23 | Jul 23 | Aug 23 | Sep 23 | Oct 23 | Nov 23 | Dec 23 | Total |
|---|---|---|---|---|---|---|---|---|---|---|---|---|---|
| Written Representations | 1,328 | 1,495 | 1,529 | 1,220 | 1,307 | 1,402 | 1,418 | 1,392 | 1,515 | 1,558 | 1,495 | 1,315 | 16,974 |
| Hearings | 64 | 77 | 81 | 57 | 89 | 59 | 65 | 63 | 60 | 54 | 67 | 65 | 801 |
| Inquiries | 79 | 46 | 67 | 28 | 40 | 29 | 34 | 29 | 46 | 40 | 49 | 48 | 535 |
| Total | 1,471 | 1,618 | 1,677 | 1,305 | 1,436 | 1,490 | 1,517 | 1,484 | 1,621 | 1,652 | 1,611 | 1,428 | 18,310 |
| Month | Jan 23 | Feb 23 | Mar 23 | Apr 23 | May 23 | Jun 23 | Jul 23 | Aug 23 | Sep 23 | Oct 23 | Nov 23 | Dec 23 | Total |
| Planning | 1,227 | 1,397 | 1,389 | 1,110 | 1,188 | 1,258 | 1,257 | 1,259 | 1,339 | 1,403 | 1,341 | 1,213 | 15,381 |
| Enforcement | 184 | 169 | 235 | 138 | 149 | 170 | 208 | 192 | 225 | 187 | 228 | 158 | 2,243 |
| Specialist | 60 | 52 | 53 | 57 | 99 | 62 | 52 | 33 | 57 | 62 | 42 | 57 | 686 |
| Total | 1,471 | 1,618 | 1,677 | 1,305 | 1,436 | 1,490 | 1,517 | 1,484 | 1,621 | 1,652 | 1,611 | 1,428 | 18,310 |
Source: Horizon
What are Planning cases? The Planning category includes s78 planning appeals, householder appeals, commercial appeals, listed building consent appeals, advertisement appeals, s106 planning obligation appeals and Called In Planning Applications.
What are Enforcement cases? Enforcement covers enforcement appeals (i.e., appeals against the issue of an enforcement notice served by a local planning authority for alleged breaches of planning control), enforcement listed building notice appeals and lawful development certificate appeals.
What are Specialist cases? Specialist casework includes Common Land, Rights of Way orders (including Schedule 14 cases), Purchase orders, Tree Preservation Orders, High Hedges appeals, Hedgerow appeals, Wayleave, Compulsory Purchase Orders, Secretary of State, Transport, Environmental Permitting Appeals and Coastal Access. Additional casework types have been added to this category over time.
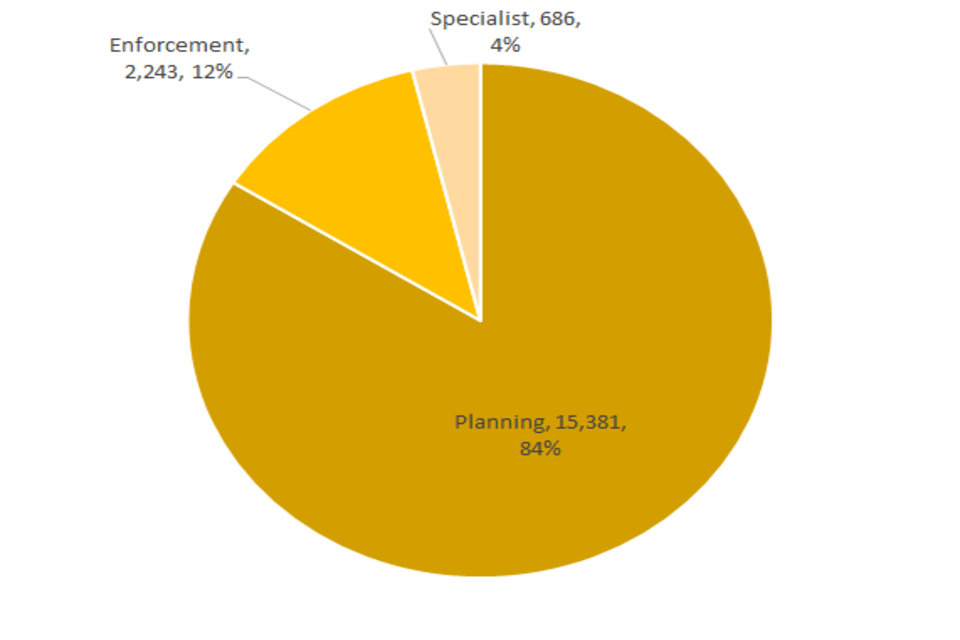
The large majority of cases over the past 12 months were planning (15,381). This is about 84% of all appeal decisions made. There were 2,243 enforcement decisions and 686 specialist decisions. These totals are also shown in Table 4 above and Figure 4 below.
Trends for planning decisions show similar patterns to written representations. The average number of enforcement decisions over the past 12 months was 187. Specialist casework figures continue to vary each month, from a high of 99 in May 2023 to a low of 33 in August 2023.
Figure 4 – Appeal Decisions by Procedure and Casework Category; January 2023 to December 2023.
Source: Horizon
4. Decision timelines
It is important for people to know how long an appeal is going to take, so that they can make informed plans and decisions. This section covers the timeliness of decisions (i.e., how long it takes to make a decision) across appeal casework. In addition to an overall measure, timeliness is analysed by procedure type and casework category, as timeliness varies a great deal depending on these characteristics.
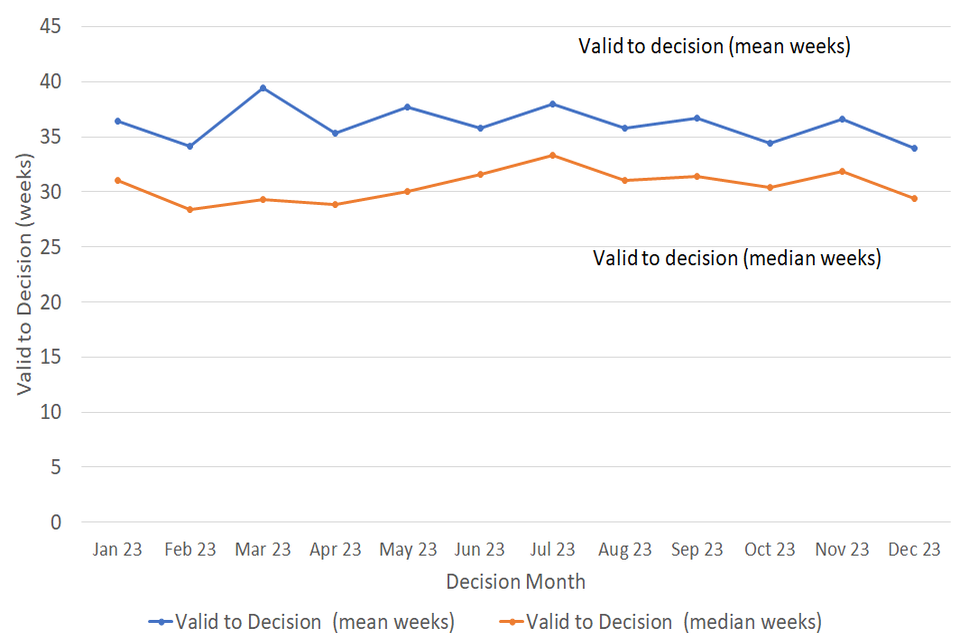
Table 5 below shows that the median time to make a decision, across all cases in the last 12 months, was 31 weeks; and 29 weeks for December 2023. Figure 5 shows the median has ranged from 28 to 33 weeks for each of the last 12 months.
How is timeliness measured?
The time to make a decision is measured from the time the Inspectorate have enough information for the case to proceed (it is deemed ‘valid’) to the time a decision letter is issued. This means that any delay in ‘validating’ the appeal is included in the time to make a decision.
The decisions made in a given month will include those that started many months before, and thus do not give an accurate indication of how long appeals submitted, or deemed ‘valid’ in that month, will take.
Table 5 also shows the mean decision time for the last 12 months is 36 weeks. Each month the median is less than the mean, due to the impact of very long cases. Also included in the table is the standard deviation of decision timeliness, which is a measure of variation.
4.1 What are mean, median, and standard deviation
| Measure | Definition |
|---|---|
| Mean | The total time taken divided by the number of cases. Also referred to as the ‘average’. A measure of how long each case would take, if the total time taken was spread evenly across all cases. |
| Median | This is the time taken by the ‘middle’ case if all cases were sorted from quickest to longest |
| Standard deviation | This is a measure of variability or spread. It is calculated by examining how much each value differs from the mean. A higher standard deviation means the individual decision times vary more widely around the mean. A lower standard deviation would demonstrate greater consistency in the Planning Inspectorate’s decision timeliness. |
Table 5: Median, mean and Standard Deviation of Time to Decision; January 2023 to December 2023.
| Month | Jan 23 | Feb 23 | Mar 23 | Apr 23 | May 23 | Jun 23 | Jul 23 | Aug 23 | Sep 23 | Oct 23 | Nov 23 | Dec 23 | Total |
|---|---|---|---|---|---|---|---|---|---|---|---|---|---|
| Valid to Decision (median weeks) | 31.1 | 28.4 | 29.3 | 28.9 | 30.0 | 31.6 | 33.3 | 31.0 | 31.4 | 30.4 | 31.9 | 29.4 | 30.7 |
| Valid to Decision (mean weeks) | 36.4 | 34.1 | 39.5 | 35.3 | 37.7 | 35.8 | 38.0 | 35.8 | 36.7 | 34.4 | 36.6 | 33.9 | 36.2 |
| Standard Deviation (weeks) | 23.8 | 22.8 | 35.2 | 22.5 | 27.8 | 20.3 | 21.9 | 20.8 | 21.6 | 18.8 | 20.7 | 20.1 | 23.6 |
Source: Horizon
Figure 5: Median and mean Time to Decision; January 2023 to December 2023.
Note: Specialist casework timeliness measures exclude Tree Preservation Order cases
Source: Horizon
4.2 Procedure Type
Table 6 below shows decision timeliness broken down by the procedure type. Hearings and inquires have typically taken longer than written representations , however, for the past seven months written representations and hearings have had similar median decision times. Because 19 of every 20 cases are by written representation, the timeliness measures for written representations are similar to the measure across all cases.
Where a small number of cases has been decided, the average timeliness (whether mean or median) is less meaningful as a measure than where there are many cases. Those noted in the table caption below should be treated with caution as there are fewer than 20 cases decided.
Median times are less affected by a small number of large values than mean times, so are the focus of this commentary. The median time for written representations over the 12 months to December 2023 is 30 weeks. The median time for hearings over the 12 months to December 2023 is 37 weeks. The median time to decide for inquiries over the 12 months to December 2023 was 55 weeks.
Table 6: Mean and Median Time to Decision, with Standard Deviation, by Procedure; January 2023 to December 2023.
Note 1: where the number of decisions issued is fewer than 20, the measures mean, median and standard deviation are less meaningful.
Key: WR= Written Representations; HRG= Hearings; INQ= Inquiries; All= All Cases
| Measure | Procedure | Jan 23 | Feb 23 | Mar 23 | Apr 23 | May 23 | Jun 23 | Jul 23 | Aug 23 | Sep 23 | Oct 23 | Nov 23 | Dec 23 | Total |
|---|---|---|---|---|---|---|---|---|---|---|---|---|---|---|
| Valid to decision (median weeks) | Written Representations | 29.7 | 27.6 | 28.1 | 28.1 | 29.5 | 31.5 | 33.3 | 31.0 | 31.3 | 30.4 | 31.7 | 29.3 | 30.1 |
| Valid to decision (median weeks) | Hearings | 58.4 | 38.3 | 45.1 | 35.1 | 56.6 | 33.6 | 32.9 | 29.6 | 33.1 | 28.1 | 32.0 | 33.9 | 36.9 |
| Valid to decision (median weeks) | Inquiries | 73.3 | 58.0 | 204.6 | 79.1 | 38.4 | 33.7 | 43.6 | 28.4 | 61.9 | 39.4 | 41.0 | 68.2 | 55.1 |
| Valid to decision (median weeks) | All Cases | 30.4 | 28.4 | 29.3 | 28.9 | 30.0 | 31.6 | 33.3 | 31.0 | 31.4 | 30.4 | 31.9 | 29.4 | 30.7 |
| Valid to decision (mean weeks) | Written Representations | 33.3 | 31.9 | 34.1 | 33.6 | 34.3 | 35.0 | 36.9 | 34.8 | 35.3 | 34.0 | 35.7 | 32.3 | 34.3 |
| Valid to decision (mean weeks) | Hearings | 57.9 | 52.6 | 57.9 | 49.4 | 70.6 | 44.4 | 52.1 | 49.0 | 49.4 | 43.0 | 42.9 | 45.9 | 52.2 |
| Valid to decision (mean weeks) | Inquiries | 72.8 | 76.0 | 139.5 | 79.6 | 71.2 | 56.2 | 56.4 | 55.0 | 63.6 | 39.3 | 56.4 | 63.1 | 73.1 |
| Valid to decision (mean weeks) | All Cases | 36.4 | 34.1 | 39.5 | 35.3 | 37.7 | 35.8 | 38.0 | 35.8 | 36.7 | 34.4 | 36.6 | 33.9 | 36.2 |
| Standard Deviation (weeks) | Written Representations | 18.2 | 17.9 | 20.6 | 20.1 | 20.6 | 18.9 | 20.0 | 18.0 | 19.5 | 18.1 | 19.1 | 17.1 | 19.1 |
| Standard Deviation (weeks) | Hearings | 29.3 | 39.0 | 42.4 | 30.2 | 53.2 | 29.4 | 37.2 | 40.1 | 37.9 | 34.2 | 27.0 | 30.4 | 38.4 |
| Standard Deviation (weeks) | Inquiries | 49.8 | 54.6 | 88.7 | 40.7 | 57.2 | 40.1 | 35.6 | 47.2 | 32.9 | 15.5 | 37.7 | 39.8 | 57.8 |
| Standard Deviation (weeks) | All Cases | 23.8 | 22.8 | 35.2 | 22.5 | 27.8 | 20.3 | 21.9 | 20.8 | 21.6 | 18.8 | 20.7 | 20.1 | 23.6 |
| Decisions | Written Representations | 1,328 | 1,495 | 1,529 | 1,220 | 1,307 | 1,402 | 1,418 | 1,392 | 1,515 | 1,558 | 1,495 | 1,315 | 16,974 |
| Decisions | Hearings | 64 | 77 | 81 | 57 | 89 | 59 | 65 | 63 | 60 | 54 | 67 | 65 | 801 |
| Decisions | Inquiries | 79 | 46 | 67 | 28 | 40 | 29 | 34 | 29 | 46 | 40 | 49 | 48 | 535 |
| Decisions | Total | 1,471 | 1,618 | 1,677 | 1,305 | 1,436 | 1,490 | 1,517 | 1,484 | 1,621 | 1,652 | 1,611 | 1,428 | 18,310 |
Source: Horizon
Note: Tree Preservation Order cases are not included in timeliness measures
The standard deviation information indicates that for all three procedures, there is considerable variation, meaning times are widely spread about the mean. For written representations, the amount of variation has been quite stable over recent months, whereas inquiries have experienced considerable month to month changes in the spread of decision times.
4.3 Casework Category
The nature of the cases the Planning Inspectorate deal with varies widely and several factors play a part in determining how long it takes to make a decision. One such factor is the type of casework. Table 7 below shows the time taken to decide, in planning cases, in enforcement cases, and in specialist cases, as does Figure 6.
The median time to decision for planning cases (there are many more of these decisions than in the other categories) is lower than for enforcement cases; and less variable than the times for specialist cases. Table 7 and Figure 6 show the median time for planning cases has been 26 weeks and above for each of the last twelve months.
Table 7: Decisions, Mean, Median and Standard Deviation of Time to Decision – Planning, Enforcement, Specialist Cases; January 2023 to December 2023.
Note 1: This table includes revisions to previously published data. Please see Annex D for further information
| Appeal Type | Measure | Jan 23 | Feb 23 | Mar 23 | Apr 23 | May 23 | Jun 23 | Jul 23 | Aug 23 | Sep 23 | Oct 23 | Nov 23 | Dec 23 | Total |
|---|---|---|---|---|---|---|---|---|---|---|---|---|---|---|
| Planning Cases | Valid to decision (median wks) | 28.3 | 26.1 | 26.0 | 26.6 | 28.7 | 29.9 | 31.6 | 29.0 | 29.9 | 29.3 | 29.9 | 27.9 | 28.7 |
| Planning Cases | Valid to decision (mean wks) | 31.6 | 30.7 | 31.5 | 32.1 | 33.3 | 32.5 | 34.9 | 32.7 | 33.4 | 32.0 | 32.4 | 30.2 | 32.3 |
| Planning Cases | Standard deviation of decision (weeks) | 16.3 | 17.8 | 18.6 | 20.0 | 22.3 | 17.5 | 19.8 | 17.4 | 18.9 | 16.7 | 16.5 | 15.6 | 18.2 |
| Enforcement Cases | Valid to decision (median wks) | 63.4 | 54.1 | 67.6 | 57.9 | 58.4 | 53.1 | 53.1 | 49.9 | 50.0 | 48.3 | 57.7 | 58.5 | 55.1 |
| Enforcement Cases | Valid to decision (mean wks) | 67.9 | 60.1 | 86.1 | 60.5 | 68.8 | 56.2 | 53.4 | 54.4 | 55.2 | 51.7 | 57.6 | 58.9 | 61.1 |
| Enforcement Cases | Standard deviation of decision (weeks) | 36.6 | 36.1 | 62.3 | 26.4 | 41.0 | 21.2 | 22.3 | 26.5 | 24.8 | 23.0 | 22.6 | 25.6 | 34.8 |
| Specialist Cases | Valid to decision (median wks) | 33.0 | 45.4 | 27.4 | 34.6 | 44.7 | 34.3 | 50.4 | 34.6 | 36.4 | 35.1 | 51.7 | 41.7 | 37.8 |
| Specialist Cases | Valid to decision (mean wks) | 38.4 | 52.8 | 42.9 | 36.7 | 49.7 | 48.1 | 56.2 | 45.0 | 43.3 | 41.9 | 57.9 | 50.0 | 46.9 |
| Specialist Cases | Standard deviation of decision (weeks) | 30.6 | 36.9 | 40.7 | 20.0 | 32.8 | 35.1 | 36.9 | 37.5 | 32.7 | 26.9 | 42.3 | 33.3 | 35.0 |
Source: Horizon
Note: Specialist casework timeliness measures exclude Tree Preservation Order cases
Annex A gives information on median and mean time to decision, with standard deviation, for the three procedure types, split by planning, enforcement, and specialist casework categories.
Enforcement decisions made in the past 12 months had a median decision time of 55 weeks.
There are considerably fewer specialist cases which means results are more liable to be distorted by extreme values.
Figure 6 – Median Time to Decision by Casework Category: January 2023 to December 2023.
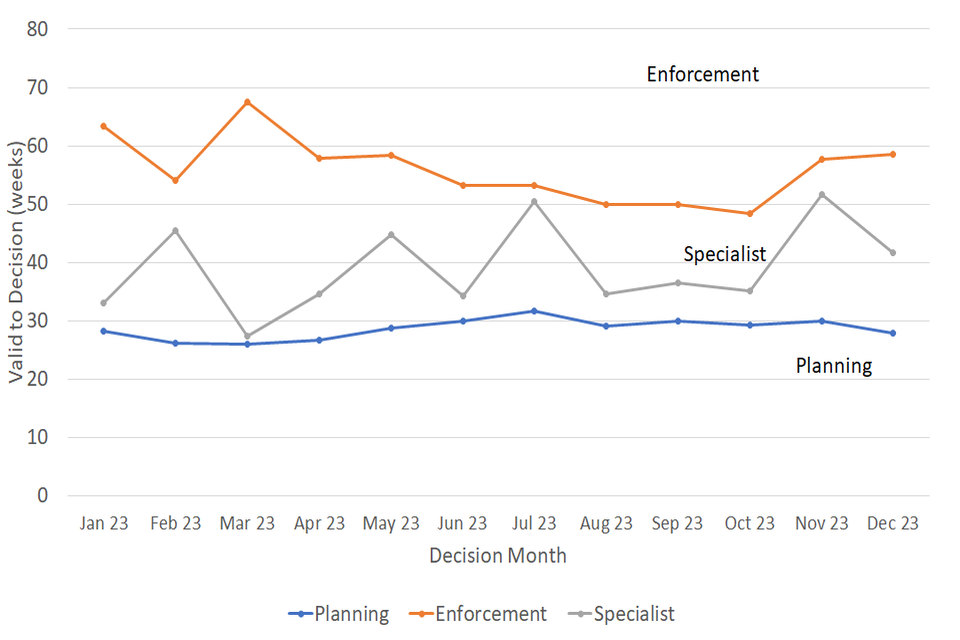
Source: Horizon
Note: Specialist casework timeliness measures exclude Tree Preservation Order cases
Note that the Inspectorate publishes each month, information on the mean and median times from valid to decision, for selected appeal types. The information published also breaks down the time for each stage of the process. See Annex B for further details.
4.4 Planning Inquiry Decisions
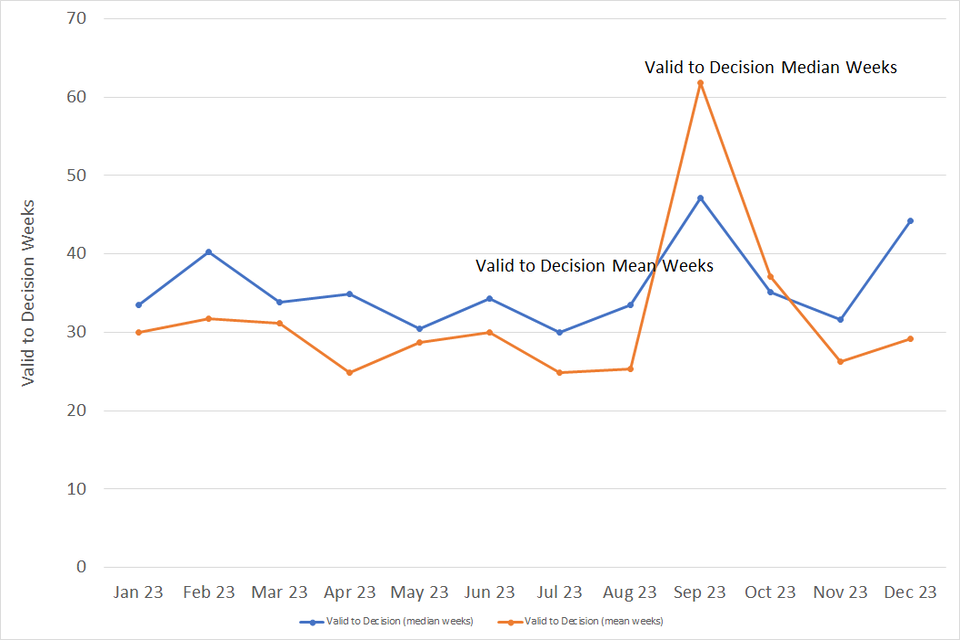
For planning appeals decided by the inquiry process, The Planning Inspectorate has been implementing recommendations from the Rosewell review.
The median time for inquiries under Rosewell process over the 12 months to December 2023 is 30 weeks and the median time to decision for December 2023 was 29 weeks.
Table 8: Decisions, Mean and Median Time to Decision, Planning Inquiry Cases under Rosewell Process; January 2023 to December 2023.
Note 1: where there are fewer than 20 decisions, the measures mean, median and standard deviation are less meaningful.
| Measure | Jan 23 | Feb 23 | Mar 23 | Apr 23 | May 23 | Jun 23 | Jul 23 | Aug 23 | Sep 23 | Oct 23 | Nov 23 | Dec 23 | Total |
|---|---|---|---|---|---|---|---|---|---|---|---|---|---|
| Decisions | 25 | 15 | 17 | 9 | 20 | 17 | 15 | 21 | 32 | 16 | 24 | 21 | 232 |
| Median (weeks) | 30.0 | 31.7 | 31.1 | 24.9 | 28.6 | 30.0 | 24.9 | 25.3 | 61.9 | 37.1 | 26.2 | 29.1 | 29.9 |
| Mean (weeks) | 33.5 | 40.2 | 33.8 | 34.9 | 30.5 | 34.3 | 30.0 | 33.5 | 47.1 | 35.2 | 31.6 | 44.2 | 36.3 |
| St. Dev. (weeks) | 11.7 | 29.2 | 13.7 | 20.2 | 8.9 | 25.8 | 12.2 | 16.8 | 16.2 | 9.0 | 11.7 | 23.0 | 18.1 |
Most inquiry decisions now being issued are under the revised ‘Rosewell’ process but some inquiries, for example those that are linked together with associated enforcement cases, do not follow the Rosewell process.
Table 9: Decisions, Planning Inquiry Cases under non-Rosewell Process; January 2023 to December 2023
| Month | Jan 23 | Feb 23 | Mar 23 | Apr 23 | May 23 | Jun 23 | Jul 23 | Aug 23 | Sep 23 | Oct 23 | Nov 23 | Dec 23 | Total |
|---|---|---|---|---|---|---|---|---|---|---|---|---|---|
| Decisions | 3 | 5 | 3 | 3 | 0 | 0 | 2 | 0 | 1 | 0 | 2 | 3 | 22 |
Source: Horizon
Figure 7 below shows the mean and median time to decision for planning inquiry cases under the Rosewell process.
Figure 7: Mean and Median Time to Decision, Rosewell Inquiry Process; January 2023 to December 2023.
Source: Horizon
5. Open Cases
At the end of Deceber 2023, the Planning Inspectorate had 13,809 cases open. More information on the number of open cases, and how it has changed over the past 12 months, is in Table 2 and Figure 2 above.
The open cases comprised of 12,388 cases being handled through written representations; 800 through hearings; and 568 through inquiries, as well as 51 not currently allocated a procedure type. This is not the number of ‘live’ hearings and inquiries since it includes cases where the event (hearing or inquiry) has yet to start, as well as those where the event has finished but the decision has yet to be issued.
Table 10: Open cases by procedure and stage, as of end of December 2023
| Stage | WR | HRG | INQ | Total |
|---|---|---|---|---|
| Case received but yet to be deemed valid | 2,148 | 27 | 8 | 2,184 |
| Case deemed valid but yet to “start” [Note 1] | 2,753 | 235 | 116 | 3,151 |
| Case started but event (site visit/ hearing/ inquiry) has not yet happened | 5,923 | 439 | 361 | 6,723 |
| Event has happened/ started [Note 2] but decision not yet issued | 1,564 | 99 | 83 | 1,749 |
| Total | 12,388 | 800 | 568 | 13,809 |
Source: Horizon
Note 1 - there are 53 cases that have no procedure type recorded (see Background Quality Report for more detail) These are included in the total but excluded from the breakdown by procedure.
Note 2 – there is a known anomaly that means that the number of open cases does not exactly follow the volumes of cases closed or received (for example the number of open cases can increase between months even though the number closed exceeded the number received). The main reasons for this have been identified and are detailed in the Background Quality Report. The inspectorate are investigating how to introduce new processes to improve the quality of this data which once complete may result in revisions to the number of open cases.
6. Inspectors
Table 11 below shows the number of inspectors in the Planning Inspectorate in each month from January 2023 to December 2023 . This includes headcount (i.e. the number of different individuals) and full-time equivalents (FTE) where those working part time are counted in proportion with their contracted hours. There were 426 Planning Inspectors employed by the Inspectorate in December 2023 – with a full-time equivalent of 384
Table 11: Planning Inspectors – Headcount and FTE; January 2023 to December 2023.(at end of month)
| Month | Jan 23 | Feb 23 | Mar 23 | Apr 23 | May 23 | Jun 23 | Jul 23 | Aug 23 | Sep 23 | Oct 23 | Nov 23 | Dec 23 |
|---|---|---|---|---|---|---|---|---|---|---|---|---|
| Headcount | 409 | 412 | 424 | 422 | 422 | 428 | 439 | 437 | 432 | 430 | 428 | 426 |
| FTE | 366.0 | 368.1 | 380.2 | 378.3 | 378.6 | 383.7 | 394.2 | 393.2 | 388.3 | 386.4 | 385.2 | 383.6 |
Source: SAP HR
As above, Planning Inspectors work on a broader range of work than the appeals featured in this Release. Please note that data on Planning Inspectors is only applicable to salaried employees (it does not include fixed term contract Inspectors or Planning and Appeal Decision Suppliers, previously referred to as non-salaried Inspectors).
7. Quarterly Statistics
The Inspectorate has also published a series of tables of quarterly data. Some of the data published is on casework types that The Planning Inspectorate deals with that are larger in scale, but smaller in volume, than the appeals decisions that are the subject of the preceding sections of these statistics. The best examples of this are Nationally Significant Infrastructure Projects and Local Plans, where volumes never go into the hundreds, and the time between submission to report issue can be over a year. Other data breaks appeals down into more detail than in the monthly totals.
7.1 Appeals against refusal of Planning Permission (Section 78 appeals)
The largest volume of casework dealt with by the Planning Inspectorate are appeals against refusal of Planning Permission, which are made under section 78 of the Town and Country Planning Act 1990. The analysis below deals with just this casework type although figures for other casework types can be found in the published quarterly statistics.
7.2 Number of appeals received compared to decisions issued.
In the last twelve months, January 2023 to December 2023, there have been 10,007 Section 78 planning appeals (s78) received, 6.7% lower than for the period January 2022 to December 2022.
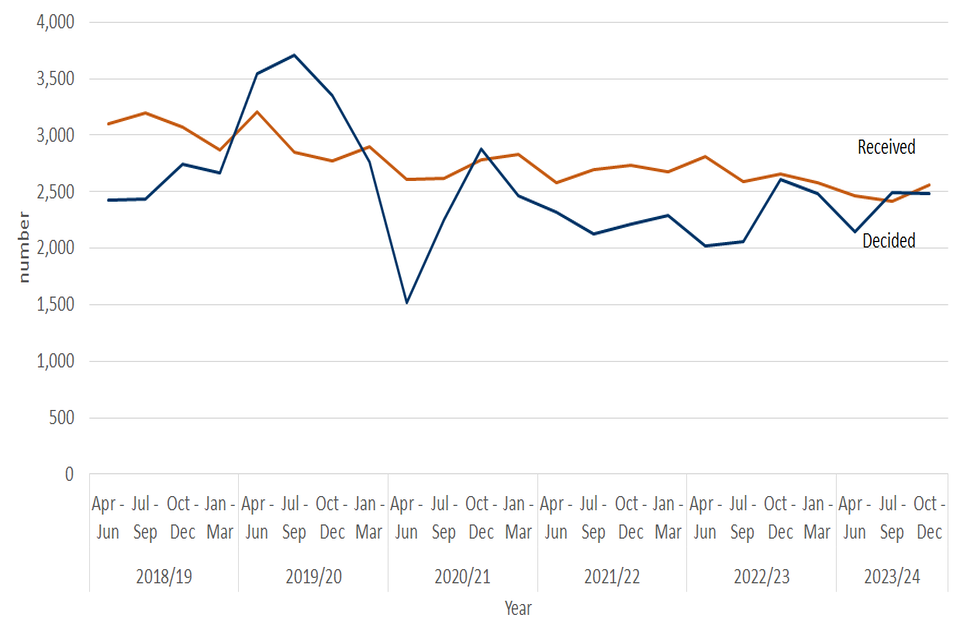
In the last five financial years (April 2018 to December 2023) the highest level of quarterly receipts (3,203) occurred in April to June 2019 and the highest number of decisions (3,705) was in July to September 2019. Over the past year the average number of receipts per quarter was 2,502 and the average number of decisions per quarter was 2,401.
The number of appeals received in October to December 2023 (2,557) was 3.7% lower than the same period in 2022. Appeal receipts since the pandemic started average 2,638 per quarter (April 20 to December 23). During 2019, the last 4 quarters before the pandemic, the Inspectorate received an average of 2,929 appeals per quarter.
Figure 8: Number of s78 Planning appeal, receipts and decisions, 2018/19 to 2023/24, by quarter
Source: Horizon & Picaso. Full published data in Tables 2.1 and Table 2.4.
See Annex C, Table A, for full data table.
The number of decisions issued in October to December 2023, was 0.6% lower than the previous quarter and 4.9% lower than the corresponding quarter last year.
7.3 Appeals Allowed
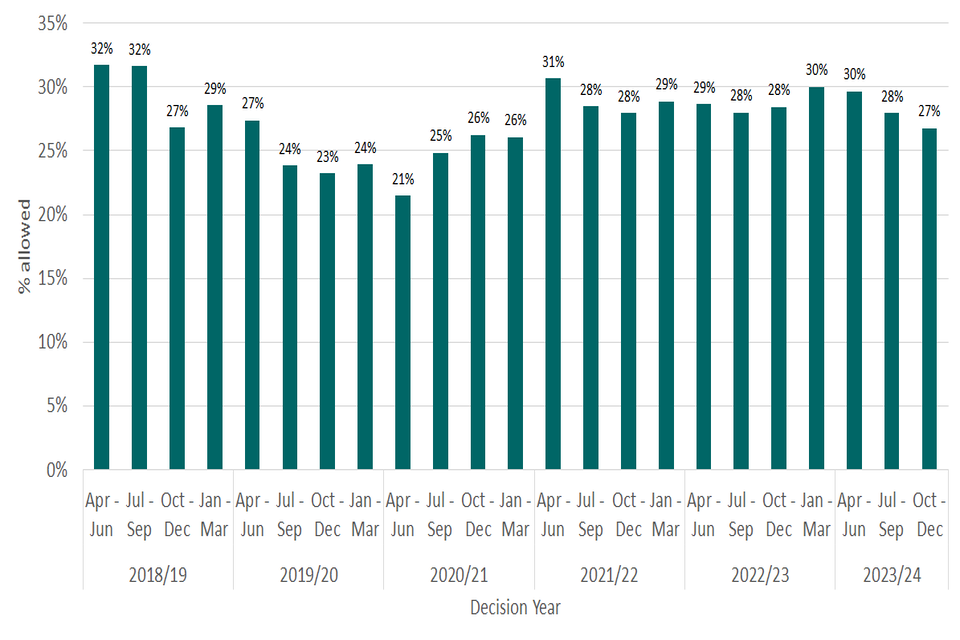
The percentage of Section 78 planning appeals that were allowed in the latest quarter was 27%, a fall from 28% in the previous quarter (see figure 9).
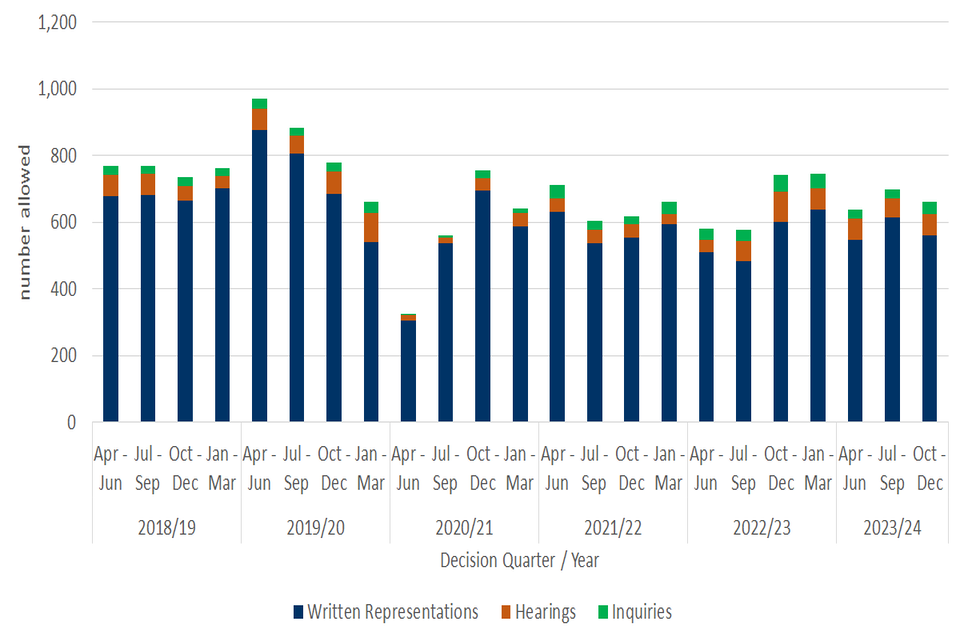
There were 663 appeals allowed between October and December 2023, 34 less than in the previous quarter. (see Figure 11).
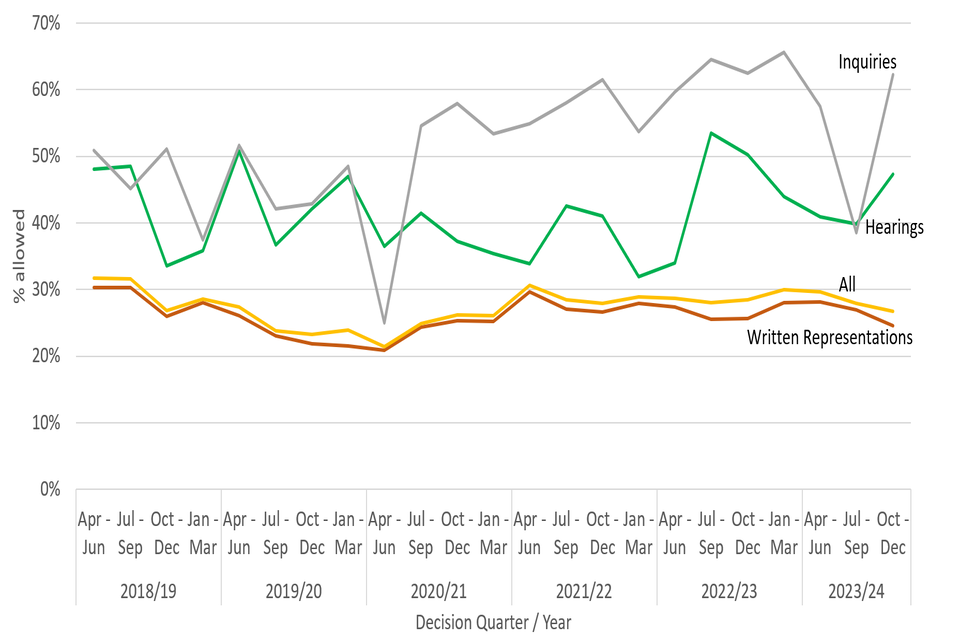
The consistency in the overall percentage allowed is heavily influenced by the number of written representations appeals allowed, as this procedure type contributes by far the greatest number of decisions each year. There has been slightly more variation in the percentage allowed for hearings and inquiries. See Figure 10 below for further details.
Figure 9: S78 planning appeals, percentage allowed, 2018/19 to 2023/24, by quarter
Source: Horizon & Picaso. Full published data in Table 2.4 s78 planning appeals decided.
See Annex C Table B, for full data table
Figure 10: S78 planning appeals, percentage allowed by procedure type, 2018/19 to 2023/24, by quarter
Source: Horizon & Picaso. Full published data in Table 2.4 s78 planning appeals decided.
See Annex C Table B, for full data table
Figure 11: S78 planning appeals, number of appeals allowed, 2018/19 to 2023/24, by quarter
Source: Horizon & Picaso. Full published data in Table 2.4 s78 planning appeals decided.
See Annex C, Table C, for full data table
8. Annex A – Mean and median time to decision, with standard deviation, for planning, enforcement, and specialist casework
8.1 Planning
Note: where there are fewer than 20 decisions, the measures mean, median and standard deviation are less meaningful. This applies to April, June, July and October 2023 for inquiries decisions.
| Planning | Measure | Jan 23 | Feb 23 | Mar 23 | Apr 23 | May 23 | Jun 23 | Jul 23 | Aug 23 | Sep 23 | Oct 23 | Nov 23 | Dec 23 | Total |
|---|---|---|---|---|---|---|---|---|---|---|---|---|---|---|
| Written Representations | Decisions | 1,160 | 1,323 | 1,310 | 1,059 | 1,106 | 1,189 | 1,191 | 1,188 | 1,263 | 1,345 | 1,270 | 1,143 | 14,547 |
| Written Representations | Median Average Weeks | 28.1 | 26.0 | 25.9 | 26.6 | 28.3 | 29.9 | 31.9 | 29.1 | 29.7 | 29.3 | 30.0 | 27.9 | 28.7 |
| Written Representations | Mean Average Weeks | 30.9 | 29.8 | 30.6 | 31.4 | 31.8 | 32.0 | 34.2 | 32.2 | 32.7 | 31.7 | 32.4 | 29.5 | 31.6 |
| Written Representations | Standard Deviation Weeks | 15.4 | 15.9 | 17.0 | 18.7 | 18.2 | 16.5 | 18.1 | 15.7 | 17.7 | 15.8 | 16.4 | 14.3 | 16.7 |
| Hearings | Decisions | 39 | 54 | 59 | 39 | 62 | 52 | 49 | 50 | 43 | 42 | 45 | 46 | 580 |
| Hearings | Median Average Weeks | 44.7 | 25.4 | 40.3 | 27.0 | 40.2 | 31.5 | 25.4 | 26.3 | 25.1 | 25.0 | 25.1 | 24.0 | 28.2 |
| Hearings | Mean Average Weeks | 48.5 | 41.9 | 47.6 | 42.7 | 61.4 | 42.9 | 50.7 | 43.4 | 40.1 | 39.5 | 31.2 | 38.2 | 44.6 |
| Hearings | Standard Deviation Weeks | 27.5 | 31.5 | 32.8 | 30.6 | 52.9 | 29.5 | 40.5 | 39.3 | 34.1 | 35.0 | 15.7 | 28.6 | 35.8 |
| Inquiries | Decisions | 28 | 20 | 20 | 12 | 20 | 17 | 17 | 21 | 33 | 16 | 26 | 24 | 254 |
| Inquiries | Median Average Weeks | 30.0 | 32.5 | 33.4 | 28.8 | 28.6 | 30.0 | 27.7 | 25.3 | 61.9 | 37.1 | 26.2 | 31.1 | 30.7 |
| Inquiries | Mean Average Weeks | 37.3 | 55.5 | 42.7 | 56.6 | 30.5 | 34.3 | 36.1 | 33.5 | 50.2 | 35.2 | 34.4 | 45.4 | 40.9 |
| Inquiries | Standard Deviation Weeks | 18.8 | 41.4 | 31.5 | 43.9 | 8.9 | 25.8 | 20.4 | 16.8 | 23.7 | 9.0 | 19.9 | 24.0 | 26.2 |
| All Cases | Decisions | 1,227 | 1,397 | 1,389 | 1,110 | 1,188 | 1,258 | 1,257 | 1,259 | 1,339 | 1,403 | 1,341 | 1,213 | 15,381 |
| All Cases | Median Average Weeks | 28.3 | 26.1 | 26.0 | 26.6 | 28.7 | 29.9 | 31.6 | 29.0 | 29.9 | 29.3 | 29.9 | 27.9 | 28.7 |
| All Cases | Mean Average Weeks | 31.6 | 30.7 | 31.5 | 32.1 | 33.3 | 32.5 | 34.9 | 32.7 | 33.4 | 32.0 | 32.4 | 30.2 | 32.3 |
| All Cases | Standard Deviation Weeks | 16.3 | 17.8 | 18.6 | 20.0 | 22.3 | 17.5 | 19.8 | 17.4 | 18.9 | 16.7 | 16.5 | 15.6 | 18.2 |
8.2 Enforcement
Note: where there are fewer than 20 decisions, the measures mean, median and standard deviation are less meaningful. This applies to all months for hearing other than March, May and November 2023 and all months for inquiry decisions other than January, February, March and October 2023.
| Enforcement | Measure | Jan 23 | Feb 23 | Mar 23 | Apr 23 | May 23 | Jun 23 | Jul 23 | Aug 23 | Sep 23 | Oct 23 | Nov 23 | Dec 23 | Total |
|---|---|---|---|---|---|---|---|---|---|---|---|---|---|---|
| Written Representations | Decisions | 122 | 130 | 174 | 112 | 112 | 157 | 185 | 180 | 203 | 156 | 189 | 125 | 1,845 |
| Written Representations | Median Average Weeks | 53.5 | 48.2 | 58.1 | 53.6 | 56.7 | 52.9 | 51.9 | 48.2 | 47.6 | 49.4 | 55.3 | 53.9 | 52.1 |
| Written Representations | Mean Average Weeks | 56.7 | 51.6 | 60.8 | 54.1 | 56.6 | 54.4 | 51.9 | 51.9 | 51.0 | 52.8 | 55.2 | 54.4 | 54.1 |
| Written Representations | Standard Deviation Weeks | 23.6 | 22.6 | 24.8 | 21.9 | 24.5 | 17.7 | 21.3 | 22.3 | 19.7 | 22.9 | 19.9 | 18.9 | 21.8 |
| Hearings | Decisions | 15 | 17 | 20 | 12 | 23 | 6 | 11 | 9 | 13 | 11 | 22 | 16 | 175 |
| Hearings | Median Average Weeks | 74.7 | 73.6 | 67.4 | 69.9 | 78.9 | 50.5 | 34.0 | 58.3 | 75.3 | 61.0 | 63.8 | 62.6 | 68.9 |
| Hearings | Mean Average Weeks | 80.8 | 87.9 | 84.1 | 70.5 | 96.5 | 56.6 | 50.4 | 74.8 | 81.9 | 56.6 | 66.7 | 66.8 | 75.7 |
| Hearings | Standard Deviation Weeks | 22.3 | 40.8 | 51.4 | 17.8 | 48.9 | 25.1 | 24.8 | 40.6 | 34.7 | 27.0 | 29.5 | 25.5 | 38.3 |
| Inquiries | Decisions | 47 | 22 | 41 | 14 | 14 | 7 | 12 | 3 | 9 | 20 | 17 | 17 | 223 |
| Inquiries | Median Average Weeks | 82.0 | 72.6 | 224.3 | 114.2 | 149.3 | 101.3 | 80.1 | 146.1 | 94.6 | 46.3 | 72.7 | 87.6 | 82.4 |
| Inquiries | Mean Average Weeks | 92.9 | 89.0 | 194.1 | 103.3 | 120.8 | 98.2 | 78.6 | 146.1 | 110.2 | 40.3 | 73.3 | 84.2 | 107.5 |
| Inquiries | Standard Deviation Weeks | 51.4 | 61.9 | 62.9 | 23.2 | 63.3 | 39.2 | 19.8 | 0.0 | 20.2 | 17.0 | 29.9 | 44.5 | 66.0 |
| All Cases | Decisions | 184 | 169 | 235 | 138 | 149 | 170 | 208 | 192 | 225 | 187 | 228 | 158 | 2,243 |
| All Cases | Median Average Weeks | 63.4 | 54.1 | 67.6 | 57.9 | 58.4 | 53.1 | 53.1 | 49.9 | 50.0 | 48.3 | 57.7 | 58.5 | 55.1 |
| All Cases | Mean Average Weeks | 67.9 | 60.1 | 86.1 | 60.5 | 68.8 | 56.2 | 53.4 | 54.4 | 54.3 | 51.7 | 57.6 | 58.9 | 61.1 |
| All Cases | Standard Deviation Weeks | 36.6 | 36.1 | 62.3 | 26.4 | 41.0 | 21.2 | 22.3 | 26.5 | 24.8 | 23.0 | 22.6 | 25.6 | 34.8 |
8.3 Specialist
Note: where there are fewer than 20 decisions, the measures mean, median and standard deviation are less meaningful. This applies to all months’ hearings decisions; and all months inquiries decisions.
| Specialist | Measure | Jan 23 | Feb 23 | Mar 23 | Apr 23 | May 23 | Jun 23 | Jul 23 | Aug 23 | Sep 23 | Oct 23 | Nov 23 | Dec 23 | Total |
|---|---|---|---|---|---|---|---|---|---|---|---|---|---|---|
| Written Representations | Decisions | 46 | 42 | 45 | 49 | 89 | 56 | 42 | 24 | 49 | 57 | 36 | 47 | 582 |
| Written Representations | Median Average Weeks | 23.6 | 35.6 | 23.1 | 31.9 | 37.5 | 31.6 | 48.6 | 23.6 | 28.1 | 34.0 | 43.6 | 39.7 | 32.7 |
| Written Representations | Mean Average Weeks | 30.4 | 40.1 | 31.5 | 34.0 | 42.1 | 42.1 | 50.9 | 31.6 | 40.4 | 40.5 | 49.0 | 44.4 | 40.2 |
| Written Representations | Standard Deviation Weeks | 23.1 | 26.1 | 23.9 | 18.9 | 29.1 | 35.2 | 33.3 | 20.7 | 33.5 | 27.6 | 35.0 | 28.8 | 29.6 |
| Hearings | Decisions | 10 | 6 | 2 | 6 | 4 | 1 | 5 | 4 | 4 | 1 | 0 | 3 | 46 |
| Hearings | Median Average Weeks | 70.6 | 30.3 | 99.1 | 37.6 | 71.5 | - | 70.9 | 63.8 | 37.2 | - | - | 65.6 | 63.8 |
| Hearings | Mean Average Weeks | 63.5 | 30.3 | 99.1 | 52.6 | 64.4 | - | 70.0 | 61.9 | 37.2 | - | - | 65.6 | 62.9 |
| Hearings | Standard Deviation Weeks | 19.0 | 0.0 | 55.9 | 24.3 | 26.4 | - | 12.2 | 16.4 | 1.1 | - | - | 0.0 | 27.5 |
| Inquiries | Decisions | 4 | 4 | 6 | 2 | 6 | 5 | 5 | 5 | 4 | 4 | 6 | 7 | 58 |
| Inquiries | Median Average Weeks | 73.8 | 111.6 | 69.9 | 51.9 | 97.5 | 68.3 | 42.7 | 65.9 | 59.9 | 47.1 | 93.6 | 78.4 | 68.5 |
| Inquiries | Mean Average Weeks | 85.0 | 106.1 | 88.7 | 51.9 | 91.3 | 71.7 | 71.9 | 90.6 | 68.9 | 50.2 | 103.9 | 72.3 | 81.5 |
| Inquiries | Standard Deviation Weeks | 41.7 | 26.3 | 58.3 | 3.0 | 23.6 | 23.9 | 58.4 | 59.4 | 21.9 | 20.7 | 46.6 | 43.1 | 44.6 |
| All Cases | Decisions | 60 | 52 | 53 | 57 | 99 | 62 | 52 | 33 | 57 | 62 | 42 | 57 | 686 |
| All Cases | Median Average Weeks | 26.9 | 33.0 | 45.4 | 27.4 | 34.6 | 44.7 | 34.3 | 50.4 | 34.6 | 36.4 | 34.6 | 41.7 | 37.8 |
| All Cases | Mean Average Weeks | 38.4 | 52.8 | 42.9 | 36.7 | 49.7 | 48.1 | 56.2 | 45.0 | 43.3 | 41.9 | 57.9 | 50.0 | 46.9 |
| All Cases | Standard Deviation Weeks | 30.6 | 36.9 | 40.7 | 20.0 | 32.8 | 35.1 | 36.9 | 37.5 | 32.7 | 26.9 | 42.3 | 33.3 | 35.0 |
Tree Preservation order decisions have been removed from the average time calculations in this table due to problems with recorded validation dates, which mean that we are currently unable to accurately calculate their decision times.
9. Annex B – Detailed Information on timeliness (December 2023)
The information below is published today on the number and length of decisions made in December 2023 :
Note 1: when there are fewer than 20 decisions the measures mean, median and standard deviation are less meaningful.
| Casework Type | Procedure Type | Median (weeks) | Mean (weeks) | Decisions |
|---|---|---|---|---|
| s78 planning appeals | Written Representations | 31.1 | 33.8 | 675 |
| s78 planning appeals | Hearings | 24.0 | 38.3 | 45 |
| s78 planning appeals | Inquiries | 33.1 | 45.5 | 21 |
| Householder appeals | Written Representations | 18.0 | 19.5 | 375 |
| Enforcement appeals | Written Representations | 53.9 | 54.4 | 125 |
| Enforcement appeals | Hearings | 62.6 | 66.8 | 16 |
| Enforcement appeals | Inquiries | 87.6 | 84.2 | 17 |
The smaller the number of decisions, the less helpful the mean and median are as measures for summarising performance. Particular care should be taken when there are fewer than twenty decisions. These are shaded grey in the table but have been provided for completeness and transparency.
The information published below shows the time taken for different stages of the appeals process:
| Measure | s78 Written Representations [Note 1] | s78 Hearings | s78 Inquiries | Householder appeals |
|---|---|---|---|---|
| Weeks between valid date & start date | ||||
| Median (average) | 10.9 | 1.9 | 1.7 | 3.3 |
| Mean (average) | 9.5 | 2.9 | 2.7 | 4.9 |
| Cases that started in December 2023 | 560 | 21 | 13 | 253 |
| Weeks between start date & event date | ||||
| Median (average) | 11.0 | 16.7 | 16.1 | 6.0 |
| Mean (average) | 14.3 | 20.5 | 18.5 | 8.7 |
| Cases where an event occurred during December 2023 | 549 | 27 | 19 | 278 |
| Weeks between event date & decision date | ||||
| Median (average) | 4.4 | 4.4 | 6.3 | 2.9 |
| Mean (average) | 5.7 | 8.3 | 10.0 | 3.5 |
| Cases that have been decided in December 2023 | 663 | 38 | 15 | 373 |
Note: Only cases with both dates recorded appear in this table, meaning that numbers for cases decided and events recorded may be lower than those presented elsewhere.
Explanation of date terminology
| Valid date | When a case is deemed to have been validly received. Note – this is not always the date the case was validated. If a case is validated after the date it was validly received, it is the date it was validly received that is the valid date. |
|---|---|
| Start date | When a timetable, on how the appeal will progress, is issued to both the appellant and local authority. This timetable tells the appellant when to submit the information the Inspectors need to determine the appeal. It also tells the local authority when to notify interested parties about the appeal. |
| Event date | When the site visit, hearing, or inquiry occurred. |
| Decision date | When the decision was issued by The Planning Inspectorate. |
Find out more about the process here - https://www.gov.uk/appeal-planning-decision/after-you-appeal
10. Annex C – Quarterly Tables
Annex C, Table a: s78 planning appeals received and decided, by quarter since 2018/19
| Year | Quarter | received | decided |
|---|---|---|---|
| 2018/19 | Apr - Jun | 3,104 | 2,428 |
| Jul - Sep | 3,192 | 2,431 | |
| Oct - Dec | 3,074 | 2,739 | |
| Jan - Mar | 2,867 | 2,665 | |
| 2019/20 | Apr - Jun | 3,203 | 3,540 |
| Jul - Sep | 2,849 | 3,705 | |
| Oct - Dec | 2,771 | 3,350 | |
| Jan - Mar | 2,894 | 2,759 | |
| 2020/21 | Apr - Jun | 2,609 | 1,514 |
| Jul - Sep | 2,613 | 2,252 | |
| Oct - Dec | 2,781 | 2,879 | |
| Jan - Mar | 2,832 | 2,467 | |
| 2021/22 | Apr - Jun | 2,581 | 2,320 |
| Jul - Sep | 2,692 | 2,124 | |
| Oct - Dec | 2,729 | 2,212 | |
| Jan - Mar | 2,671 | 2,294 | |
| 2022/23 | Apr - Jun | 2,811 | 2,024 |
| Jul - Sep | 2,584 | 2,057 | |
| Oct - Dec | 2,656 | 2,606 | |
| Jan - Mar | 2,579 | 2,483 | |
| 2023/24 | Apr - Jun | 2,459 | 2,148 |
| Jul - Sep | 2,412 | 2,493 | |
| Oct - Dec | 2,557 | 2,478 |
ANNEX C, Table b: s78 planning appeals, percentage allowed by procedure type, 2018/19 to 2023/24
| Year | Quarter | Written Representations | Hearings | Inquiries | All |
|---|---|---|---|---|---|
| 2018/19 | Apr - Jun | 30% | 48% | 51% | 32% |
| Jul - Sep | 30% | 48% | 45% | 32% | |
| Oct - Dec | 26% | 34% | 51% | 27% | |
| Jan - Mar | 28% | 36% | 38% | 29% | |
| 2019/20 | Apr - Jun | 26% | 51% | 52% | 27% |
| Jul - Sep | 23% | 37% | 42% | 24% | |
| Oct - Dec | 22% | 42% | 43% | 23% | |
| Jan - Mar | 22% | 47% | 48% | 24% | |
| 2020/21 | Apr - Jun | 21% | 37% | 25% | 21% |
| Jul - Sep | 24% | 41% | 55% | 25% | |
| Oct - Dec | 25% | 37% | 58% | 26% | |
| Jan - Mar | 25% | 35% | 53% | 26% | |
| 2021/22 | Apr - Jun | 30% | 34% | 55% | 31% |
| Jul - Sep | 27% | 43% | 58% | 28% | |
| Oct - Dec | 27% | 41% | 62% | 28% | |
| Jan - Mar | 28% | 32% | 54% | 29% | |
| 2022/23 | Apr - Jun | 27% | 34% | 60% | 29% |
| Jul - Sep | 26% | 54% | 65% | 28% | |
| Oct - Dec | 26% | 50% | 63% | 28% | |
| Jan - Mar | 28% | 44% | 66% | 30% | |
| 2023/24 | Apr - Jun | 28% | 41% | 57% | 30% |
| Jul - Sep | 27% | 40% | 39% | 28% | |
| Oct - Dec | 25% | 47% | 62% | 27% |
ANNEX C, Table c: s78 planning appeals, number allowed by procedure type, 2018/19 to 2023/24
| Year | Quarter | Written Representations | Hearings | Inquiries | All |
|---|---|---|---|---|---|
| 2018/19 | Apr - Jun | 679 | 62 | 29 | 770 |
| Jul - Sep | 683 | 63 | 23 | 769 | |
| Oct - Dec | 666 | 44 | 24 | 734 | |
| Jan - Mar | 702 | 38 | 21 | 761 | |
| 2019/20 | Apr - Jun | 877 | 62 | 31 | 970 |
| Jul - Sep | 805 | 55 | 24 | 884 | |
| Oct - Dec | 684 | 67 | 27 | 778 | |
| Jan - Mar | 541 | 87 | 32 | 660 | |
| 2020/21 | Apr - Jun | 304 | 19 | 2 | 325 |
| Jul - Sep | 537 | 17 | 6 | 560 | |
| Oct - Dec | 695 | 38 | 22 | 755 | |
| Jan - Mar | 588 | 39 | 16 | 643 | |
| 2021/22 | Apr - Jun | 632 | 40 | 39 | 711 |
| Jul - Sep | 536 | 40 | 29 | 605 | |
| Oct - Dec | 553 | 41 | 24 | 618 | |
| Jan - Mar | 595 | 31 | 36 | 662 | |
| 2022/23 | Apr - Jun | 509 | 37 | 34 | 580 |
| Jul - Sep | 484 | 61 | 31 | 576 | |
| Oct - Dec | 602 | 89 | 50 | 741 | |
| Jan - Mar | 637 | 66 | 42 | 745 | |
| 2023/24 | Apr - Jun | 549 | 61 | 27 | 637 |
| Jul - Sep | 615 | 55 | 27 | 697 | |
| Oct - Dec | 562 | 63 | 38 | 663 |
11. Annex D Revisions to the data tables
This Annex lists all revisions made to the data since the last statistical release.
Note: Classed as a revision are any values which have changed by more than five (when measuring number of decisions/ cases) or more than 0.5 weeks (for mean, median or standard deviation of weeks).
Timeliness measures for all 12 months have been reproduced without Tree Preservation Order cases in this publication. This is due to problems with recorded validation dates, which mean that we are currently unable to accurately calculate their decision times
| Table | Revisions |
|---|---|
| Table 1 | Events held: November 2023 |
| Table 2 | Received: November 2023 |
| Table 2 | Closed: November 2023 |
| Table 2 | Open Cases: October and November 2023 |
| Table 6 | Valid to decision mean weeks: hearings November 2023 |
| Table 6 | Valid to decision mean weeks: inquiries November 2023 |
| Table 6 | Standard Deviation: inquiries November 2023 |
| Table 7 | Specialist cases: Valid to decision median weeks: October 2023 |
| Table 7 | Specialist cases: Valid to decision mean weeks November 2023 |
| Table 7 | Specialist cases: Standard deviation November 2023 |
| Annex A Planning | Median weeks: Hearings November 2023 |
| Annex A Planning | Mean weeks: Hearings November 2023 |
| Annex A Planning | Standard Deviation: Hearings November 2023 |
| Annex A Enforcement | Median weeks: Written Representations September 2023 |
| Annex A Specialist | Median weeks: Written Representations October 2023 |
| Annex A Specialist | Mean weeks: Written Representations June 2023 |
| Annex A Specialist | Standard Deviation: Written Representations October 2023 |
| Annex A Specialist | Median weeks: Inquiries November 2023 |
| Annex A Specialist | Mean weeks: Inquiries November 2023 |
| Annex A Specialist | Standard Deviation: Inquiries November 2023 |
12. Background notes
12.1 Data sources
Horizon / Picaso – The main casework management systems used for processing appeals casework (note that Picaso is no longer a live system).
SAP HR – The Human Resources system database used to store all information regarding members of staff.
12.2 Compliance with the Code of Practice for Statistics
These statistics have been published in accordance with the Code of Practice for Statistics, which cover trustworthiness, quality, and value. They have been pre-announced, and publication is overseen by the Head of Profession.
12.3 Technical Notes
A Background Quality Report is published alongside this Statistical Release. It provides more detail on the quality of statistics in this publication.
| Definition | |
|---|---|
| Data quality | Data on cases is taken from a live casework system, and details of cases can change for a number of reasons even after a decision has been made. We are seeking to get a better understanding of the nature and volume of these changes and will provide further information as it is available. |
| Data quality | We carry out regular checks on the quality of our data and may undertake ad hoc data cleansing exercises. Therefore, all the data for the last 12 rolling months is published in provisional form. |
| Data quality | We have indicated in this publication any data where a number of cases has changed by more than five cases in a month; or where a measure (mean, median or standard deviation) has changed by more than 0.5 weeks. |
| Measuring weeks | Data are measured in days and then converted to weeks. |
| Measuring weeks | Note that not all decimal values are possible where converting days to weeks. 1 day is 1/7 of a week, or 0.14 weeks (to two decimal places). 2 days = 0.29; 3 days = 0.43; 4 days = 0.57; 5 days = 0.71; 6 days = 0.86. |
| Measuring weeks | When these are used to calculate averages, or displayed to one decimal place, the result will not equate to a full day which can be misleading: it may appear that we are measuring part days (e.g. 19.8 weeks) but we only measure in whole days. |
13. Glossary
| Term | Explanation |
|---|---|
| Appeals | The right to appeal a planning decision made by a local authority is a key feature of the planning system, as is appealing when an authority is taking too long. |
| Appeals decided | Number of appeals by the date the appeal was decided by The Planning Inspectorate. |
| Appeals received | Number of appeals by the date the appeal was received by The Planning Inspectorate. |
| Applications | Planning Inspectorate manage the application process for proposed Nationally Significant Infrastructure Projects (NSIPs) within England and Wales in line with the 2008 Planning Act. |
| Closed | The total number of appeals decided, withdrawn, or turned away. |
| Decision | The outcome of the case e.g. appeal allowed or rejected. The date of the decision is taken as the date a decision letter is sent to the appellant. |
| Event | A site visit, hearing, or inquiry (may be virtual) |
| Event Type | The different options of how an Inspector visits a site for a written representations appeal. |
| Examinations | The process of examining local plans is dealt with by the Planning Inspectorate. Every Local Planning Authority is required to have a local plan. This includes a vision for the future and plan to address housing needs in the area. |
| Examinations | When a Local Planning Authority has finished preparing and consulting on a local plan it must be submitted to the Secretary of State who appoints an Inspector to carry out an independent examination. |
| FTE | Full Time Equivalent – a count of employees where those working part time are counted in proportion with their contracted hours. |
| Headcount | Total number of staff employed regardless of how many hours they work (i.e. the number of different individuals). |
| Hearings | A hearing involves the submission of written evidence by the main parties and a hearing once all the written submissions have been received. |
| Hearings | This takes the form of a round-the-table discussion (in person or virtually) that will be led by the planning inspector. It allows for all parties to respond to any questions that the inspector might have, and to let everyone make their case known. |
| Hearings | Source: Planning Portal |
| Inquiries | An inquiry is usually used for complex cases where legal issues may need to be considered. The main parties will usually have legal representatives to present their case and to cross-examine any witnesses. Prior to the inquiry date, the Planning Inspectorate will expect to have received various documents from all parties that will be taking part in the appeal. These may include statements of case and proofs of evidence from expert witnesses. Third parties may also take part. The inquiry will be led by the inspector and will follow a formal procedure. |
| Inquiries | At some point during or on conclusion of the inquiry the inspector and the main parties will undertake a site visit. |
| Inquiries | Source: Planning Portal |
| Live appeals | Number of live appeals in that have an appeal valid date but no end date (either decision date or a closed date, e.g. for appeals that have been withdrawn). |
| Mean | The total time taken divided by the number of cases. Also referred to as the ‘average’. A measure of how long each case would take, if the total time taken was spread evenly across all cases. |
| Median | This is the time taken by the ‘middle’ case if all cases were sorted from quickest to longest |
| Open Cases | Number of cases that have been received but on which a decision has not yet been made/ issued. Will differ from Live Appeals as it includes those received but not yet verified. |
| Procedure Type | The method by which The Planning Inspectorate processes and decides appeals. |
| Standard deviation | This is a measure of variability or spread. It is calculated by examining how much each value differs from the mean. A higher standard deviation means the individual decision times vary more widely around the mean. |
| Written Representations | Most planning appeals are decided by the written representations’ procedure. With this procedure the Inspector considers written evidence from the appellant, the LPA and anyone else who has an interest in the appeal. The site is also likely to be visited. |
14. Contact Us
The Planning Inspectorate welcome feedback on our statistical products. If you have any comments or questions about this publication or about our statistics in general, you can contact us as follows:
Media enquiries 0303 444 5004 email press.office@planninginspectorate.gov.uk
Public enquiries email statistics@planninginspectorate.gov.uk
Please note we are currently reviewing our statistics with a view to making them as clear and helpful as possible for users. We would be delighted if you could contact us via the address below with any views on this approach; particularly on what content would be most useful and why.
email statistics@planninginspectorate.gov.uk
If you require information which is not available within this or other available publications, you may wish to submit a Request for Information under the Freedom of Information Act 2000 to the Planning Inspectorate.