Ministerial Measures - Experimental Statistics 01 June 2023
Updated 1 June 2023
Applies to England

© Crown copyright 2023
This publication is licensed under the terms of the Open Government Licence v3.0 except where otherwise stated. To view this licence, visit nationalarchives.gov.uk/doc/open-government-licence/version/3 or write to the Information Policy Team, The National Archives, Kew, London TW9 4DU, or email: psi@nationalarchives.gov.uk.
Where we have identified any third party copyright information you will need to obtain permission from the copyright holders concerned.
This publication is available at https://www.gov.uk/government/statistics/planning-inspectorate-statistical-release-18-may-2023/ministerial-measures-experimental-statistics-01-june-2023
1. Introduction
This report provides information on how the Planning Inspectorate has performed against new measures by which Ministers agreed to assess the organisation’s casework performance for appeals. These measures are:
A. Appeals valid on first submission B. How long appeals take o There is also an ambition for more consistent, timely decisions C. Customer satisfaction D. Number of cases quality assured
Full details of these are available.
For measure A this report covers the twelve months January to December 2022. Information on how long appeal decisions take from valid receipt to decision (measure B) covers the 12 months from May 2022 to April 2023. No information is available on measure C. Measure D covers the three months January to March 2023.
This is the fourth time such information has been produced, and work is still in development. Following a review, this series continues with the status of “Experimental”, with updates provided every three months. The next publication will be in August 2023.
The review of these statistics highlighted an issue in the measure of appeals valid on first submission. This has resulted in changes to the way this is calculated and presented. More detail is given in the section below and in the accompanying Background Quality Report.
These statistics are designated as Experimental Statistics and any feedback would be welcome. Please send comments to statistics@planninginspectorate.gov.uk
2. A. Appeals Valid on First Submission
Ambition: Proportion rising annually and ambition to reach 100%. Rising to at least 85% in 2023/24.
For appeals received during October to December 2022, 64.4% were valid first time . Table 1 shows the proportion valid on first submission over the year. The proportion valid at first submission appears to be stable at around 63% to 65%.
Data Note
After reviewing the statistics, we found many appeals lacking necessary validity information, even several weeks after receipt. As a result, information on cases valid first time for Jan to Mar cannot be reliably estimated and so have been excluded from this publication while this is investigated.
These values for valid on first submission should be treated as provisional. Further investigation is required to help understand the causes and the impact of cases with incomplete information. See the Background Quality Report for more information.
The Inspectorate is developing new digital public services. As more appeals are submitted through those services the proportion of valid cases submitted validly first time is expected to rise.
Table 1 - Proportion of Appeals Valid on First Submission, By Quarter, for Appeals Received Oct 21 - Dec 2022 (Provisional)
| Appeals Received | Oct – Dec 2021 | Jan – Mar 2022 | Apr – Jun 2022 | Jul -Sep 2022 | Oct – Dec 2022 |
|---|---|---|---|---|---|
| % Valid First Time | 64.6% | 64.5% | 64.1% | 62.5% | 64.4% |
Source: Horizon
Figure 1 below shows how the proportion valid first-time varied for a selection of appeal types, for appeals received during 2023. Note that previous publications gave this breakdown for the most recent quarter – but due to the unreliability of recent data, it is more appropriate to give less recent data.
Please note that this is calculated using a proxy: included are those cases where the date that the appeal had been validly received, is the same as the date that the case was first received. Additionally, be aware that the date for ‘validly received’ is the date on which the information was received, even if is assessed as being valid on a later date.
The figures in Table 1 differ from those published in February, which are given here for transparency: particularly the large difference for Oct – Dec 22.
| Oct – Dec 21 | Jan – Mar 22 | Apr – Jun 22 | Jul – Sep 22 | Oct – Dec 22 |
|---|---|---|---|---|
| 64.9% | 64.7% | 64.6% | 63.3% | 72.5% |
Figure 1 – Proportion of Appeals Valid on First Submission for Selected Appeal Types, Cases Received Jan – Dec 2023 (Provisional)
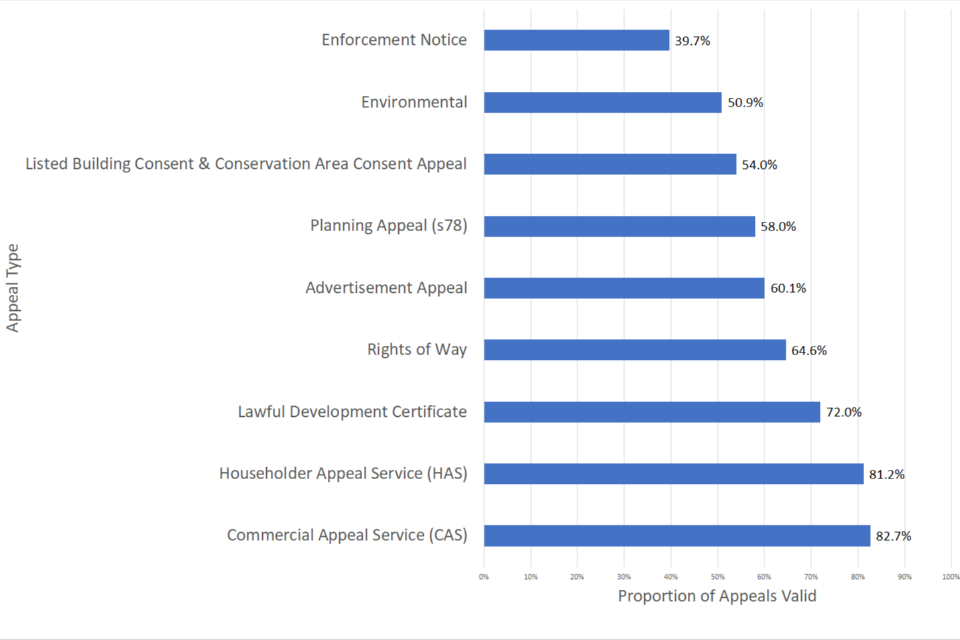
Source: Horizon
Robust data on the reasons for appeals not being valid are not currently available. The Inspectorate are developing new digital public services and as more cases are submitted using those services the data we hold will improve.
3. B. How Long Appeals Take
Ambition: As an initial milestone in making more consistent, timely decisions - The Planning Inspectorate should be working towards consistently achieving decisions in these ranges:
Appeals decided entirely using writing evidence in 16 – 20 weeks
Appeals decided including at least some evidence through hearing or inquiry in 24 - 26 weeks (30 weeks to recommendation for called in or recovered cases)
This section provides information on how long it has taken to make decisions in the last 12 months (in this case, May 2022 to April 2023). Complementary statistics for the same period can be found in our monthly Official Statistics publication .
Figure 2 below shows the proportion of cases decided:
- within 20 weeks ;
- within 26 weeks (but more than 20 weeks);
- within 52 weeks (but more than 26 weeks); and
- more than 52 weeks.
The data applies to all cases decided in the year to the end of April 2023; and is broken down by the procedure used to arrive at the decision. The data for this Figure is available at Annex B.
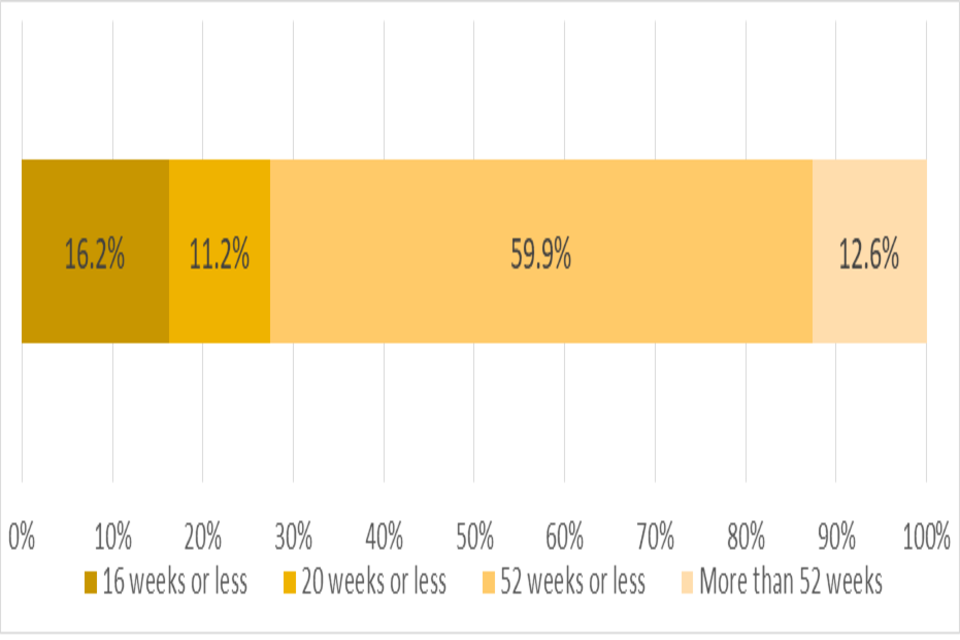
Figure 2 shows how many cases are decided within a year, and how many take longer than a year. It shows that a much smaller proportion (13%) of cases decided by written representations take more than a year than those decided by Hearings (53%) or Inquiries (51%).
It also shows that a greater proportion of cases decided by written representations are decided within 20 weeks (28%) than those decided by Hearings (10%) or Inquiries (3%).
Figure 2: Time for Valid to Decision, for Decisions in the year to end April 2023
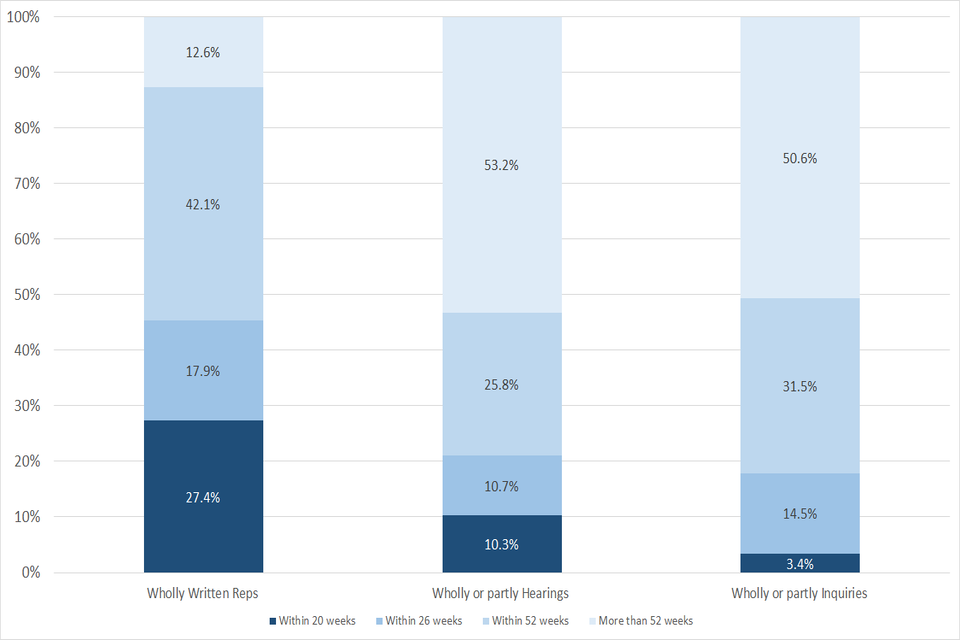
Source: Horizon
Measures set by the Minister that apply to cases decided wholly by written representations are shown in Annex C.
Consultation
If you would like to make a suggestion on which information you would like to see; or would like to have the chance to comment on any proposals on what is published, please contact us via statistics@planninginspectorate.gov.uk
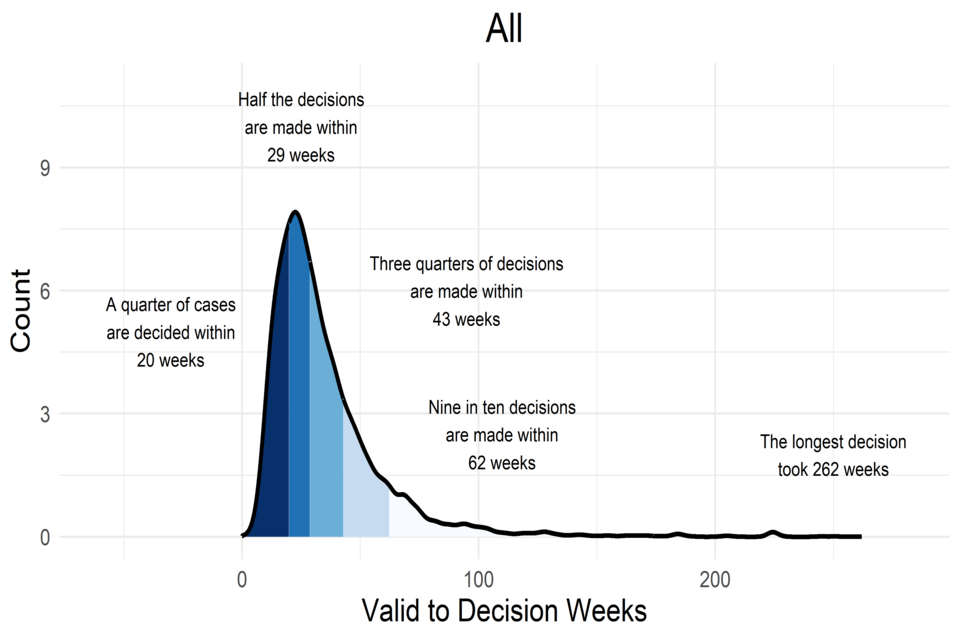
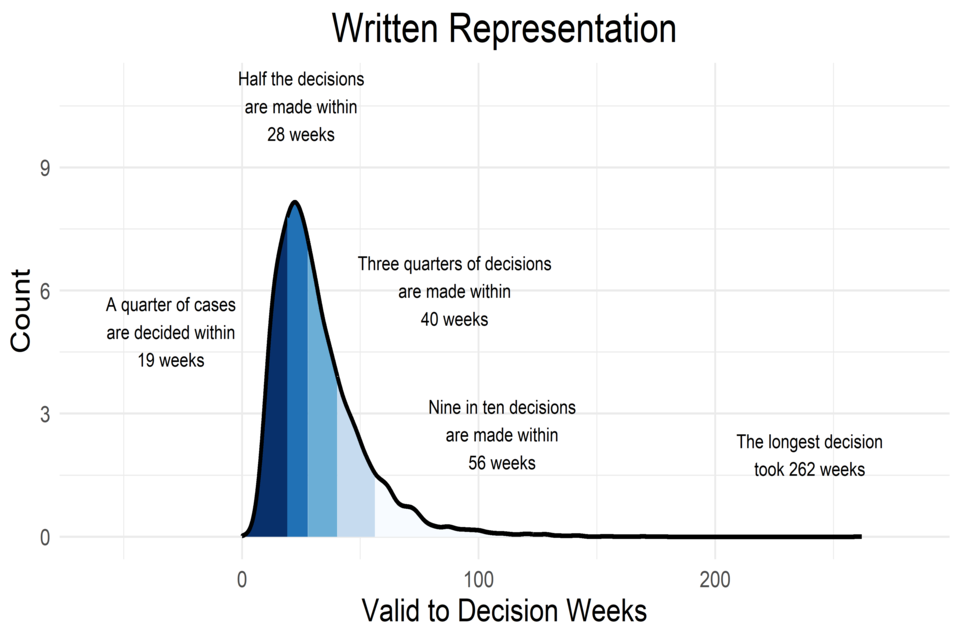
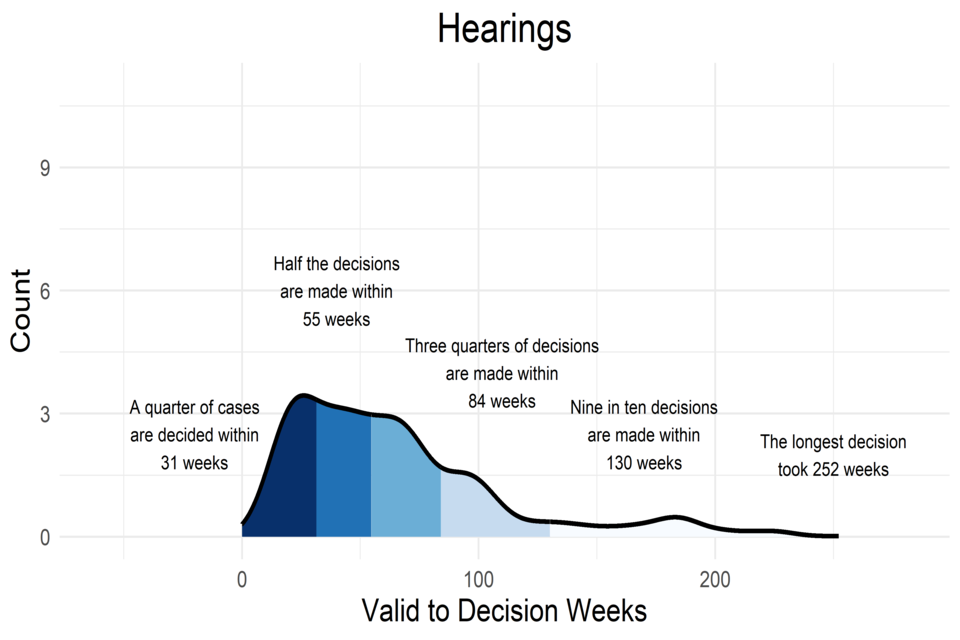
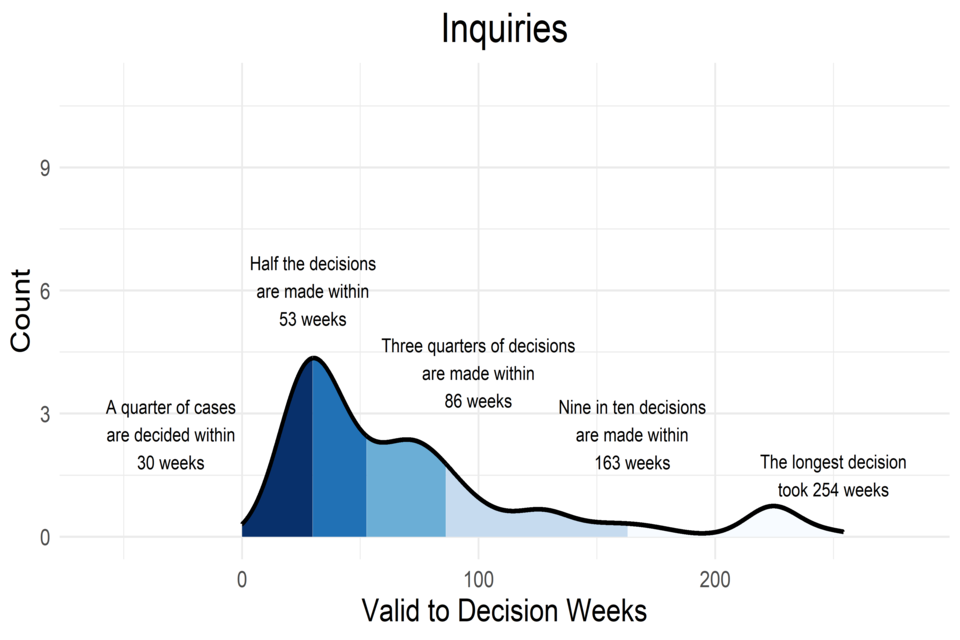
Figure 2 shows the proportion of cases that meet Ministerial timescales. Figure 3 below shows more detail. It gives the full spread of time taken to decide cases, providing visibility of those cases far outside the accepted range. It shows all cases decided in the 12 months to the end of April 2023; and a breakdown by the decision procedure. Larger pictures are available at Annex D.
Figure 3 shows: - The spread of time taken to decide for all cases, is similar to the spread for those decided wholly by written representations. This is because the large majority (15,981/17,394) of cases are decided this way. - For all procedure types, there are a small number of cases that take over four years (200 weeks and more) – one decided through written representations, forty-one through inquiries, 18 through hearings. - Three quarters of cases decided wholly by written representations are decided within 40 weeks. The corresponding time for three quarters of cases decided wholly or partly by Hearings is 84 weeks and for those wholly or partly by Inquiries is 86 weeks – in each case, more than twice as long. - Nine in ten cases decided wholly by written representations are decided within 56 weeks. The corresponding time for nine out ten cases decided wholly or partly by Hearings (130 weeks) and Inquiries (163 weeks), is more than twice as long.
Figure 3 – Spread of time taken to decide cases (in weeks), for cases decided May 22 – April 23
Note: The figure for “Half the decisions are made within” is the 50th percentile; this is the same as the median time to decide these cases, which is how this is presented in the Official Statistics.
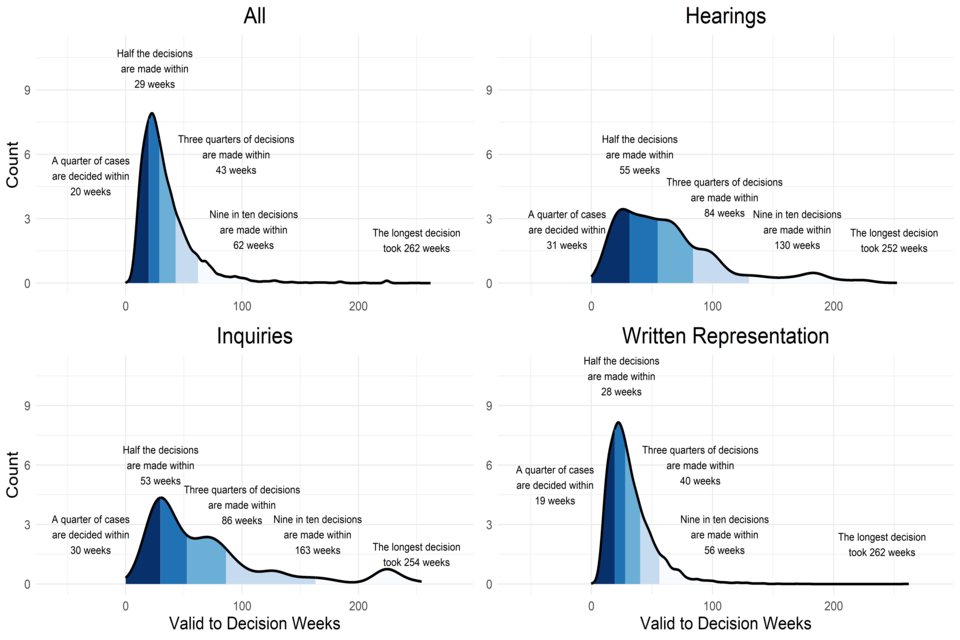
Source: Horizon
The Ministerial measure requires information on how long appeal decisions take from valid receipt to decision , with information on various percentiles.
Ambition: Decision time for 50th percentile falling. Decision time for 90th percentile falling faster than 50th percentile.
Figure 3 – Spread of time taken to decide cases (in weeks), for cases decided May 22 – April 23
Note: The figure for “Half the decisions are made within” is the 50th percentile; this is the same as the median time to decide these cases, which is how this is presented in the Official Statistics.
The Ministerial measure requires information on how long appeal decisions take from valid receipt to decision , with information on various percentiles.
Ambition: Decision time for 50th percentile falling. Decision time for 90th percentile falling faster than 50th percentile.
The ambition is that cases are decided more quickly, and the time taken for longest cases is reduced. If the ambition is met, the gap between the 50th percentile and 90th percentile needs to reduce.
What is a percentile?
A percentile is a measure that shows the value below which a given percentage of the values in a group of numbers fall.
For example, if we tell you the 25th percentile for decision times, then you know that 25% of decisions are issued in less time (or the same time) as that.
Table 2 below shows the 25th, 50th, 75th and 90th percentiles for valid to decision, in weeks, for the decisions made from May 2022 to April 2023. Note that these match the timings given in text on the shapes in Figure 3 above.
Table 2 - Percentiles for Valid to Decision (in weeks) for decisions made May 2022 – April 2023 – and number of decisions in that time
| Procedure | 25th percentile | 50th percentile | 75th percentile | 90th percentile | 100th percentile | Number of decisions |
|---|---|---|---|---|---|---|
| Written reps | 19 weeks | 28 weeks | 40 weeks | 56 weeks | 262 weeks | 15,981 |
| Hearing | 31 weeks | 55 weeks | 84 weeks | 130 weeks | 252 weeks | 889 |
| Inquiry | 30 weeks | 53 weeks | 86 weeks | 163 weeks | 254 weeks | 524 |
| All | 20 weeks | 29 weeks | 43 weeks | 62 weeks | 262 weeks | 17,394 |
Source: Horizon
If performance changes, it will be more quickly apparent by looking at quarterly data than 12 monthly data. And the ambition is to show a fall. So Annex E shows the same percentiles, for decisions in the three months January to March 2023. There are relatively few hearings and inquiries in each quarter, which means quarterly percentiles for these appeals are susceptible to extreme values - so they should be viewed with caution. Future publications will provide updates on subsequent quarters.
Figure 4 and Table 3 below show the 50th and 90th percentiles for valid to decision time (in weeks) for the last six quarters, for all decisions. It shows that both measures are rising rather than falling; and that the gap between them is not reducing.
Figure 4: All Appeal Decisions, 50th and 90th Percentile for Valid to Decision, By Quarter, Oct 21 – April 23
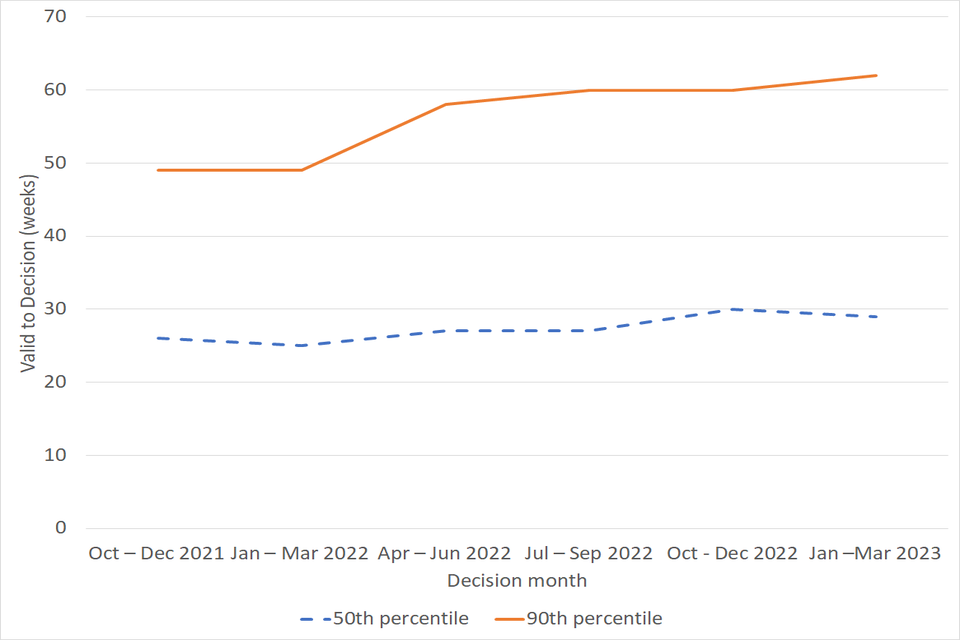
Table 3 - All appeal Decisions, 50th and 90th percentiles of Valid to Decision (weeks), October 2021 to March 2023
| Decision made: | 50th percentile | 90th percentile | Gap |
|---|---|---|---|
| Oct – Dec 2021 | 26 weeks | 49 weeks | 23 weeks |
| Jan – Mar 2022 | 25 weeks | 49 weeks | 24 weeks |
| Apr – Jun 22 | 27 weeks | 58 weeks | 31 weeks |
| Jul – Sep 22 | 27 weeks | 60 weeks | 33 weeks |
| Oct – Dec 22 | 30 weeks | 60 weeks | 30 weeks |
| Jan – Mar 22 | 29 weeks | 62 weeks | 33 weeks |
Source: Horizon
The table above covers all appeal decisions. Annex F gives figures for appeals decided wholly by written representations; wholly or partially through hearings; and wholly or partially through inquiries.
4. C Customer Satisfaction
Ambition: Proportion of customers reporting satisfaction with the planning Inspectorate’s services rising annually.
The Planning Inspectorate are working with the Institute for Customer Service to conduct a satisfaction survey. The data capture phase was carried out in April and early May 2023. The results will be reported when available.
5. D Number of Cases Quality Assured
Ambition: There is no minimum number or percentage ambition on this measure.
During the three months January to March 2023, 1,099 appeal cases were quality assured. These are shown in Table 4 below.
Table 4 - Number of appeal decisions quality assured, January to March 2023
| Number | Category | Explanation |
|---|---|---|
| 69 | Inspector Manager team reading | Inspector Managers are expected to review a proportion of their Inspectors’ decisions post-decision. This is to ensure quality standards and to identify learning opportunities and to check for consistency with the relevant quality framework. |
| 81 | APOs | Recommendations made by Appeals Planning Officers (APOs) are all reviewed as part of routine quality assurance before a decision is issued by an Inspector |
| 949 | Inspector in Training – pre-decision | The majority of decisions made by Inspectors in Training (IITs) are reviewed for teaching purposes. Each review is by an experienced Inspector |
| 1,099 | Total Appeal decisions |
Source: MiPINS
To put these totals in context, the 1,099 appeal decisions quality assured constitutes between a fifth a quarter (23%) of all decisions (4,766) issued over that period.
Table 5 shows the number of cases quality assured, beyond appeal cases, for the same quarter. These are much larger more complex cases than the average appeal case.
Table 5 - Number of Other Cases Quality Assured, January to March 2023
| Number | Category | Explanation |
|---|---|---|
| 8 | Local Plans | All Local Plans are quality assured as part of the examination process. Ten Local Plan Reports were issued in this quarter; quality assurance for some of these took place before the quarter. |
| 1 | Nationally Significant Infrastructure Projects (NSIP) | All NSIP decisions are quality assured as part of the examination process. One recommendation report was submitted to the Secretary of State this quarter. |
Source: Local Plan and NSIP case records
6. Annex A - Proportion of Appeals Valid First Time for Selected Appeal Types, Appeals Received Jan – Dec 2022 (Provisional)
| Appeal Type | Proportion valid on first submission | Number of Appeals |
|---|---|---|
| Planning Appeal (s78) | 58.0% | 10,725 |
| Householder Appeal Service (HAS) | 81.2% | 5,015 |
| Enforcement Notice | 39.7% | 2,446 |
| Lawful Development Certificate | 72.0% | 638 |
| Commercial Appeal Service (CAS) | 82.7% | 474 |
| Listed Building Consent & Conservation Area Consent Appeal | 54.0% | 424 |
| Advertisement Appeal | 60.1% | 310 |
| Rights of Way | 64.6% | 136 |
| Environmental | 50.9% | 104 |
Source: Horizon
7. Annex B: Proportion of Appeals decided within 20, 26 and 52 weeks - Decisions May 2022 - Apr 2023
| Within 20 weeks | Within 26 weeks | Within 52 weeks | More than 52 weeks | |
|---|---|---|---|---|
| Wholly Written Reps | 27.4% | 17.9% | 42.1% | 12.6% |
| Wholly or partly Hearings | 10.3% | 10.7% | 25.8% | 53.2% |
| Wholly or partly Inquiries | 3.4% | 14.5% | 31.5% | 50.6% |
8. Annex C: Decisions made wholly through written representations – Decisions in the 12 months to the end of April 2023 -Weeks from valid to Decision
Performance against Ministerial measures – note this takes different groupings (16 weeks and 20 weeks)
9. Annex D – Variation in Valid to Decisions (weeks) for appeal decisions made May 2022 to April 2023, by procedure
10. Annex E - Percentiles for Valid to Decision (in weeks) for decisions made May 2022 – April 2023 – and number of decisions in that time
| Procedure | 25th percentile | 50th percentile | 75th percentile | 90th percentile | 100th percentile | Number of decisions |
|---|---|---|---|---|---|---|
| Written reps | 19 weeks | 29 weeks | 42 weeks | 59 weeks | 135 weeks | 4,354 |
| Hearing | 24 weeks | 49 weeks | 76 weeks | 102 weeks | 252 weeks | 223 |
| Inquiry | 37 weeks | 78 weeks | 131 weeks | 224 weeks | 254 weeks | 189 |
| All | 20 weeks | 30 weeks | 45 weeks | 65 weeks | 254 weeks | 4,766 |
Source: Horizon
11. Annex F - Appeal Decisions, 50th and 90th percentiles of Valid to Decision (weeks), July 2021 to March 2023 - by procedure
Note: all measurements are in weeks
| Wholly by written representations | |||
|---|---|---|---|
| Decision made: | 50th percentile | 90th percentile | Gap |
| Jul – Sep 2021 | 22 | 43 | 21 |
| Oct – Dec 2021 | 25 | 44 | 19 |
| Jan – Mar 2022 | 25 | 45 | 20 |
| Apr – Jun 2022 | 26 | 49 | 23 |
| Jul – Sep 2022 | 26 | 53 | 27 |
| Oct – Dec 2022 | 29 | 56 | 27 |
| Jan – Mar 2023 | 28 | 56 | 26 |
| Wholly or partially through Hearings | |||
| Decision made: | 50th percentile | 90th percentile | Gap |
| Jul – Sep 2021 | 46 | 87 | 41 |
| Oct – Dec 2021 | 51 | 106 | 55 |
| Jan – Mar 2022 | 53 | 134 | 81 |
| Apr – Jun 2022 | 91 | 184 | 93 |
| Jul – Sep 2022 | 56 | 138 | 82 |
| Oct – Dec 2022 | 48 | 101 | 52 |
| Jan – Mar 2023 | 55 | 130 | 75 |
| Wholly or partially through Inquiries | |||
| Decision made: | 50th percentile | 90th percentile | Gap |
| Jul – Sep 2021 | 75 | 137 | 62 |
| Oct – Dec 2021 | 54 | 130 | 76 |
| Jan – Mar 2022 | 57 | 106 | 49 |
| Apr – Jun 2022 | 63 | 117 | 54 |
| Jul – Sep 2022 | 69 | 128 | 59 |
| Oct – Dec 2022 | 39 | 101 | 62 |
| Jan – Mar 2023 | 53 | 163 | 110 |
| Source: Horizon |