Planning Inspectorate Ministerial Measures - Experimental Statistics 19 February 2026
Published 19 February 2026
Applies to England

© Crown copyright 2026
This publication is licensed under the terms of the Open Government Licence v3.0 except where otherwise stated. To view this licence, visit nationalarchives.gov.uk/doc/open-government-licence/version/3 or write to the Information Policy Team, The National Archives, Kew, London TW9 4DU, or email: psi@nationalarchives.gov.uk.
Where we have identified any third party copyright information you will need to obtain permission from the copyright holders concerned.
This publication is available at https://www.gov.uk/government/statistics/planning-inspectorate-ministerial-measures-experimental-statistics-19-february-2026/planning-inspectorate-ministerial-measures-experimental-statistics-19-february-2026
1. Introduction
This report provides information on how the Planning Inspectorate has performed against measures by which Ministers agreed to assess the organisation’s casework performance for appeals.
These measures are:
- Measure A: Appeals valid on first submission
- Measure B: How long appeals take (There is also an ambition for more consistent, timely decisions)
- Measure C: Customer satisfaction
- Number of cases quality assured
Full details of these are available at https://assets.publishing.service.gov.uk/government/uploads/system/uploads/attachment_data/file/1049462/Housing_Minister_letter_to_PINS.pdf
For measure A, this report covers the period July 2024 to September 2025.
Measure B covers the 12 months from January 2025 to December 2025.
For measure C, survey fieldwork was carried out in April and early May 2023.
Measure D covers the three months October to December 2025.
These statistics are designated as Official Statistics in Development. Any feedback would be welcome. Please send comments to statistics@planninginspectorate.gov.uk
2. A. Appeals Valid on First Submission
Ambition: Proportion rising annually and ambition to reach 100%
For appeals received during July – September 2025, 53.4% were valid first time. Table 1 shows the proportion valid on first submission over the year.
The figures in this time series are revised at each publication as some cases take many months to be validated.
Table 1 - Proportion of Appeals Valid on First Submission, By Quarter, for Appeals Received July 2024 to September 2025
| Appeals Received | Jul – Sep 2024 | Oct – Dec 2024 | Jan – Mar 2025 | Apr – Jun 2025 | Jul – Sep 2025 |
|---|---|---|---|---|---|
| % Valid First Time | 51.10% | 51.30% | 52.00% | 51.50% | 53.40% |
Source: Horizon and Manage Appeals
Figure 1 – Proportion of Appeals Valid on First Submission for Selected Appeal Types, Cases Received October 2024 to September 2025
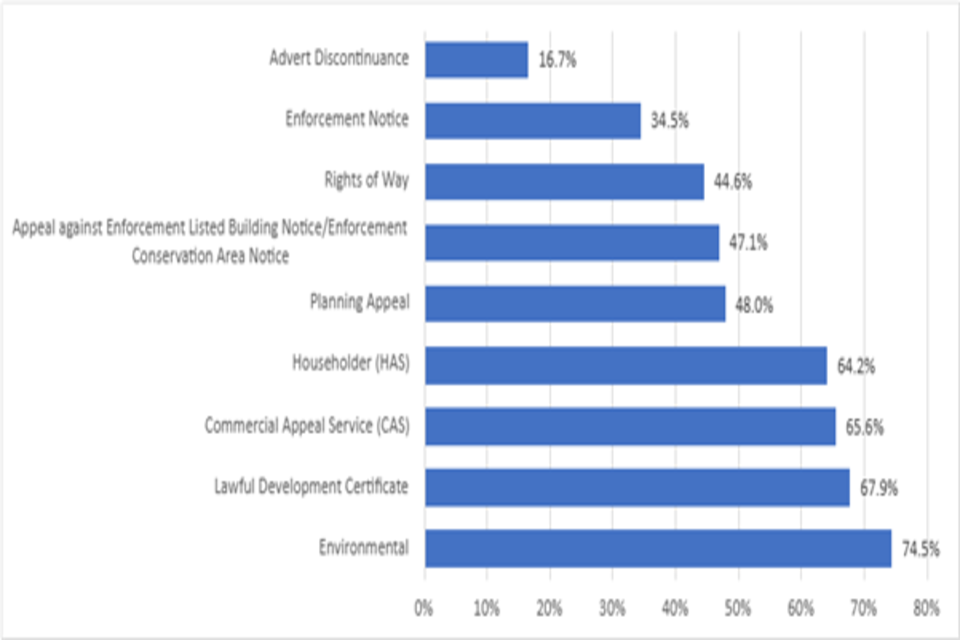
Bar chart showing data in Annex A (below)
Source: Horizon and Manage Appeals
3. B. How Long Appeals Take
Ambition: As an initial milestone in making more consistent, timely decisions - The Planning Inspectorate should be working towards consistently achieving decisions in these ranges: Appeals decided entirely using written evidence in 16 – 20 weeks. Appeals decided including at least some evidence through hearing or inquiry in 24 - 26 weeks (30 weeks to recommendation for called in or recovered cases)
Note: We are currently working towards a solution to exclude Rights of Way from the next Ministerial Measures release. Casework for these is done on behalf of a different Secretary of State, and as such they have their own targets that do not align with the 20 and 26 weeks.
This section provides information on how long it has taken to make decisions in the last 12 months (in this case, January 2025 to December 2025).
Figure 2 below shows the proportion of cases decided:
- within 20 weeks ;
- within 26 weeks (but more than 20 weeks);
- within 52 weeks (but more than 26 weeks); and
- more than 52 weeks.
The data applies to all cases decided in the year to the end of December 2025 and is broken down by the procedure used to arrive at the decision. The data for this Figure is available at Annex B.
Figure 2 shows that a much smaller proportion (12.6%) of cases decided by written representations take more than a year than those decided by hearings (16.1%) or inquiries (20.5%).
It also shows that a greater proportion of cases decided by written representations are decided within 20 weeks (42.0%) than those decided by hearings (24.4%) or inquiries (12.3%).
Figure 2: Time for Valid to Decision, for Decisions January 2025 to December 2025
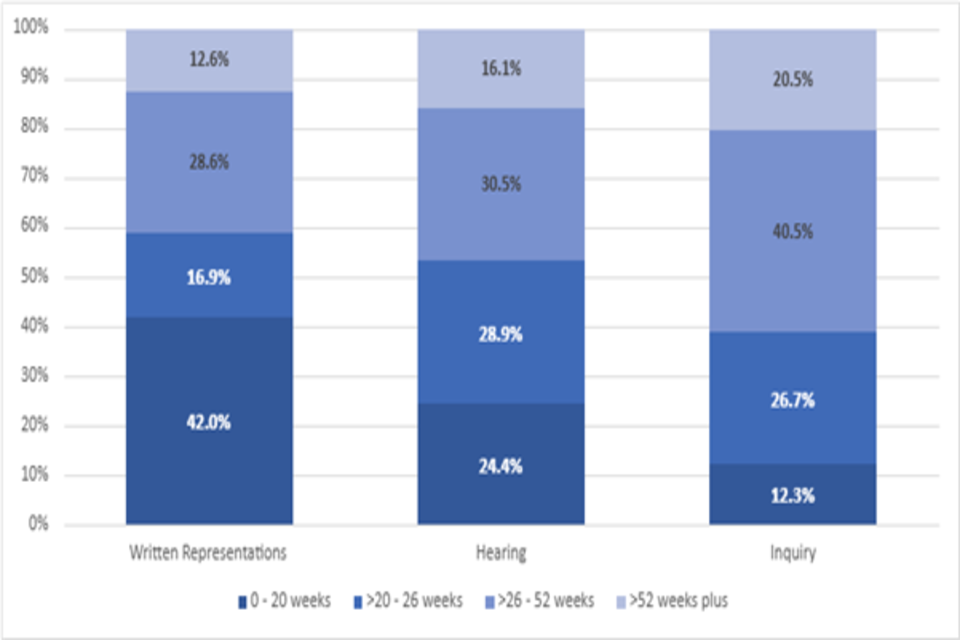
Bar chart showing data in Annex B (below)
Source: Horizon and Manage Appeals
Measures set by the Minister that apply to cases decided wholly by written representations are shown in Annex C.
Consultation If you would like to make a suggestion on which information you would like to see; or would like to have the chance to comment on any proposals on what is published, please contact us via statistics@planninginspectorate.gov.uk
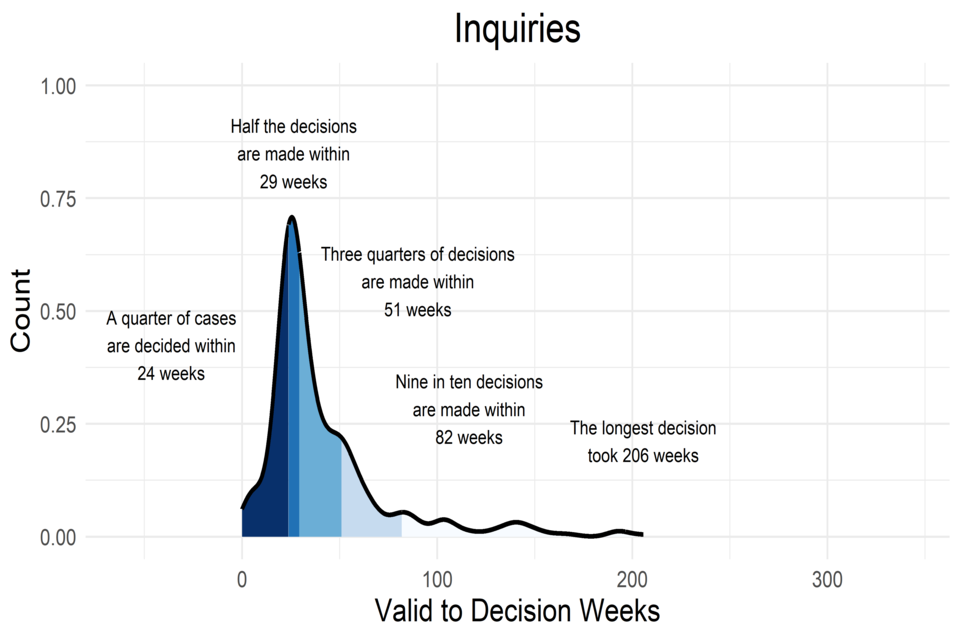
Figure 2 shows the proportion of cases decided in time bands. Figure 3 below shows more detail. It gives the full spread of time taken to decide cases, providing visibility of those cases far outside the accepted range. It shows all cases decided in the 12 months to the end of December 2025; and a breakdown by the decision procedure.
Figure 3 shows:
- The spread of time taken to decide for all cases, is similar to the spread for those decided wholly by written representations. This is because the large majority (18,741/19,982 which is 94%) of cases are decided this way.
- Three quarters of cases decided wholly by written representations are decided within 34 weeks. The corresponding time for three quarters of cases decided wholly or partly by hearings is 40 weeks and for those wholly or partly by inquiries is 51 weeks.
- Nine in ten cases decided wholly by written representations are decided within 62 weeks. The corresponding time for nine out ten cases decided wholly or partly by hearings is 71 weeks and for inquiries it is 82 weeks.
Figure 3 – Spread of time taken to decide cases (in weeks), for cases decided January 2025 – December 2025.
Note: The figure for “Half the decisions are made within” is the 50th percentile; this is the same as the median time to decide these cases, which is how this is presented in the quarterly Official Statistics publication.
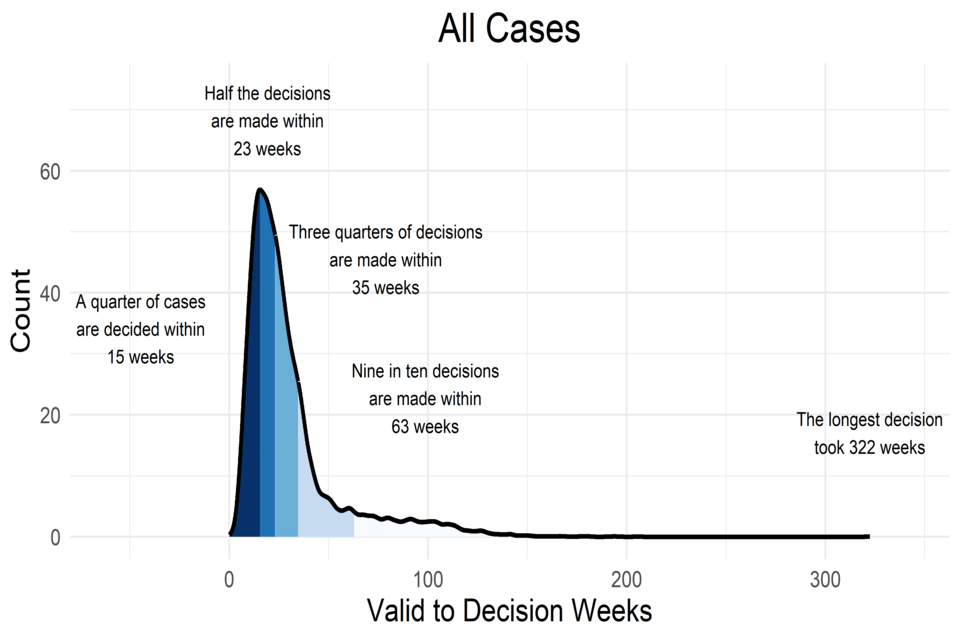
Histogram showing data in Table 2 All row (below)
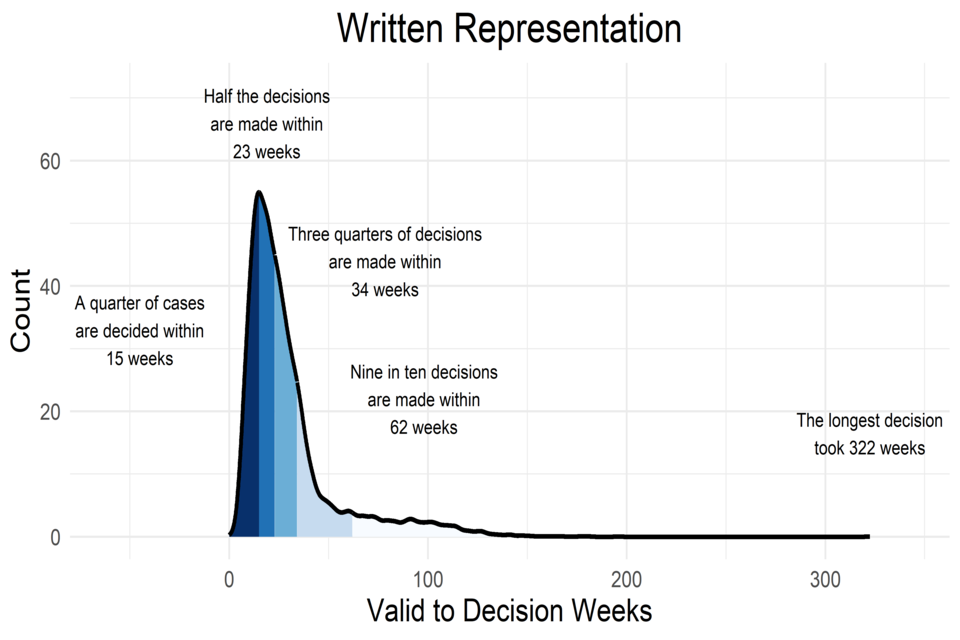
Histogram showing data in Table 2 Written reps row (below)
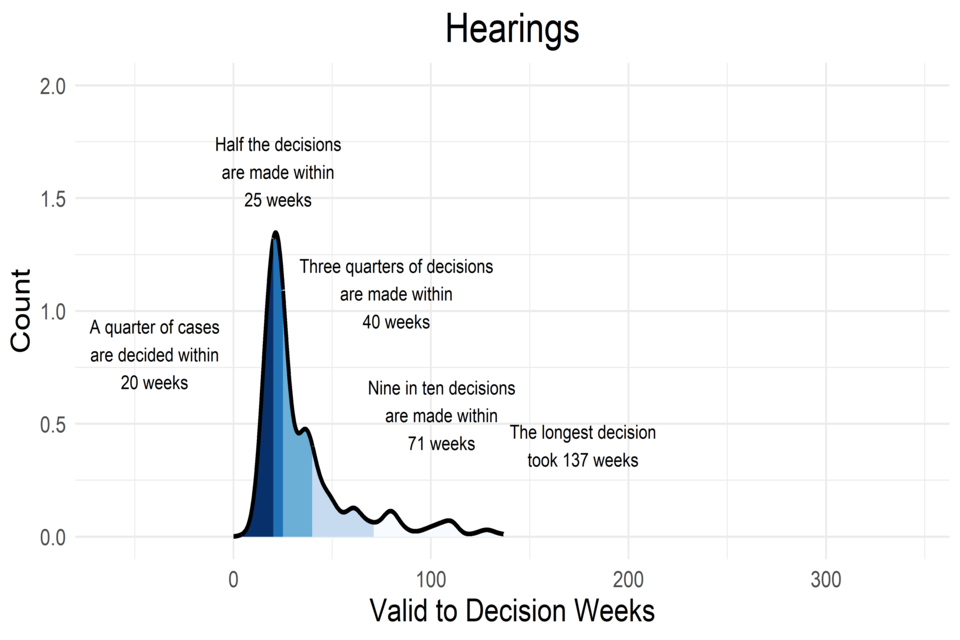
Histogram showing data in Table 2 Hearing row (below)
Source: Horizon and Manage Appeals
The Ministerial measure requires information on how long appeal decisions take from valid receipt to decision , with information on various percentiles.
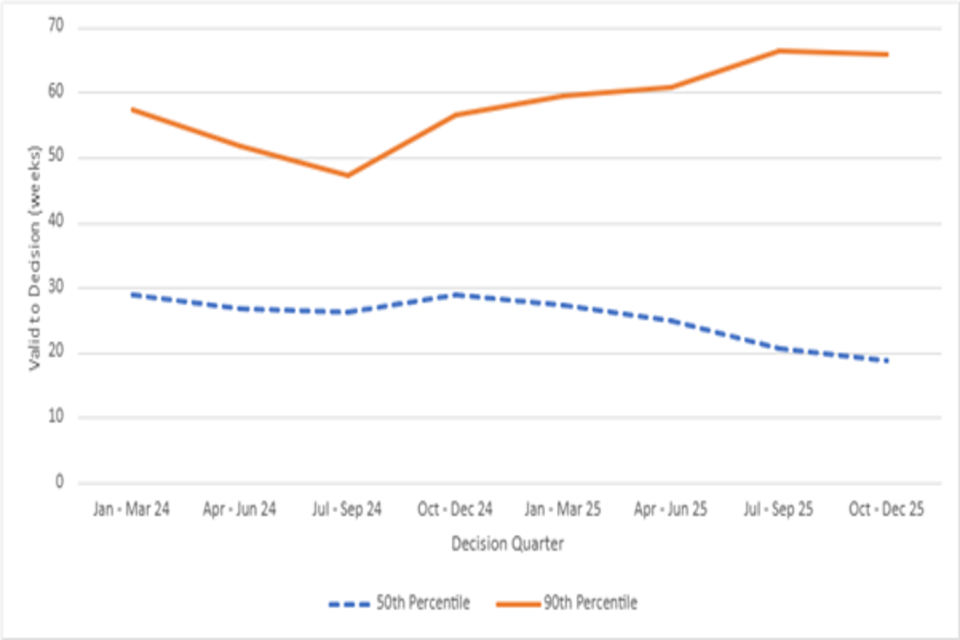
Ambition: Decision time for 50th percentile falling. Decision time for 90th percentile falling faster than 50th percentile.
The ambition is that cases are decided more quickly, and the time taken for longest cases is reduced. If the ambition is met, the gap between the 50th percentile and 90th percentile needs to reduce.
A percentile is a measure that shows the value below which a given percentage of the values in a group of numbers fall. For example, if we tell you the 25th percentile for decision times, then you know that 25% of decisions are issued in less time (or the same time) as that.
Table 2 below shows the 25th, 50th, 75th and 90th percentiles for valid to decision, in weeks, for the decisions made from January 2025 to December 2025. Note that these match the timings given in text on the shapes in Figure 3 above.
Table 2 - Percentiles for Valid to Decision (in weeks) for decisions made January 2025 to December 2025 – and number of decisions in that time Note: There are currently 2 cases that have been excluded from the decision count. This is due to an issue affecting the data whereby the valid date is after the decision date. We are working on a solution to fix this.
| Appeal Decisions | 25th percentile | 50th percentile | 75th percentile | 90th percentile | 100th percentile | Number of decisions |
|---|---|---|---|---|---|---|
| Written reps | 15 weeks | 23 weeks | 34 weeks | 62 weeks | 322 weeks | 18,741 |
| Hearing | 20 weeks | 25 weeks | 40 weeks | 71 weeks | 137 weeks | 836 |
| Inquiry | 24 weeks | 29 weeks | 51 weeks | 82 weeks | 206 weeks | 405 |
| All | 15 weeks | 23 weeks | 35 weeks | 63 weeks | 322 weeks | 19,982 |
Source: Horizon and Manage Appeals
If performance changes, it will be more quickly apparent by looking at quarterly data than 12 monthly data. Annex D shows the same percentiles, for decisions in the three months October to December 2025.
There are relatively few hearings and inquiries in each quarter, which means quarterly percentiles for these appeals are susceptible to extreme values - so they should be viewed with caution.
Figure 4: All Appeal Decisions, 50th and 90th Percentile for Valid to Decision, By Quarter, January 2024 – December 2025
Line chart showing data in Table 3 (below)
Source: Horizon and Manage Appeals
Table 3 - All appeal Decisions, 50th and 90th percentiles of Valid to Decision (weeks), January 2024 – December 2025
| Decision made: | 50th percentile | 90th percentile | Gap |
|---|---|---|---|
| Jan - Mar 24 | 29 Weeks | 57 Weeks | 28 Weeks |
| Apr - Jun 24 | 27 Weeks | 52 Weeks | 25 Weeks |
| Jul - Sep 24 | 26 Weeks | 47 Weeks | 21 Weeks |
| Oct - Dec 24 | 29 Weeks | 57 Weeks | 28 Weeks |
| Jan - Mar 25 | 27 Weeks | 59 Weeks | 32 Weeks |
| Apr - Jun 25 | 25 Weeks | 61 Weeks | 36 Weeks |
| Jul - Sep 25 | 21 Weeks | 66 Weeks | 46 Weeks |
| Oct - Dec 25 | 19 Weeks | 66 Weeks | 47 Weeks |
Source: Horizon and Manage Appeals
The table above covers all appeal decisions. Annex F gives figures for appeals decided wholly by written representations; wholly or partially through hearings; and wholly or partially through inquiries.
4. C. Customer Satisfaction
Ambition: Proportion of customers reporting satisfaction with the Planning Inspectorate’s services rising annually
No new validated customer satisfaction score is available for this reporting period.
The Planning Inspectorate has undertaken a further customer survey; however we are currently carrying out due diligence on changes made to the survey design, sampling approach and analysis. Until this work is complete, we cannot be confident that the new results are directly comparable with the 2023 baseline score of 56.8.
Our immediate focus is to: - fully understand any changes in survey design and delivery; - assess whether meaningful comparison with the 2023 results is possible; and - determine whether a reset or revised approach to measuring customer satisfaction is required.
We will be explicit in future publications about the status of this measure, and will include updated customer satisfaction information once an appropriate, validated approach has been confirmed.
5. D. Number Of Cases Quality Assured
Ambition: There is no minimum number or percentage ambition on this measure.
During the three months October to December, 826 appeal cases were quality assured. These are shown in Table 4 below.
Table 4 - Number of appeal decisions quality assured, October to December 2025
| Number | Category | Explanation |
|---|---|---|
| 236 | Inspector Manager team reading | Inspector Managers are expected to review a proportion of their Inspectors’ decisions post-decision. This is to ensure quality standards and to identify learning opportunities and to check for consistency with the relevant quality framework. |
| 257 | APOs | Recommendations made by Appeals Planning Officers (APOs) are all reviewed as part of routine quality assurance before a decision is issued by an Inspector. |
| 935 | Inspector in Training – pre-decision | Most decisions made by Inspectors in Training (IITs) are reviewed for teaching purposes. Each review is by an experienced Inspector. |
| 1,428 | Total Appeal decisions |
Source: MiPINs
To put these totals in context, the 1,428 appeal decisions quality assured constitutes over a quarter (28%) of all decisions (5,129) issued over that period.
Table 5 shows the number of cases quality assured, beyond appeal cases, for the same quarter. These are much larger, more complex cases than the typical appeal case.
Table 5 - Number of Other Cases Quality Assured, October to December 2025
| Number | Category | Explanation |
|---|---|---|
| 6 | Local Plans | All Local Plans are quality assured as part of the examination process. 6 Local Plan Reports were issued in this quarter; quality assurance also took place for plans yet to be published. |
| 4 | Nationally Significant Infrastructure Projects (NSIP) | All NSIP decisions are quality assured as part of the examination process. 4 recommendation reports were submitted to the Secretary of State this quarter. |
Source: Local Plan and NSIP case records
6. Annexes
Annex A - Proportion of Appeals Valid First Time for Selected Appeal Types, Appeals Received October 2024 to September 2025
| Appeal Type | Proportion valid on first submission | Number of Appeals Received |
|---|---|---|
| Planning Appeal | 48.00% | 9493 |
| Householder (HAS) | 64.20% | 4394 |
| Enforcement Notice | 34.50% | 2498 |
| Lawful Development Certificate | 67.90% | 913 |
| Commercial Appeal Service (CAS) | 65.60% | 486 |
| Rights of Way | 44.60% | 382 |
| Environmental | 74.50% | 178 |
| Appeal against Enforcement Listed Building Notice/Enforcement Conservation Area Notice | 47.10% | 54 |
| Advert Discontinuance | 16.70% | 8 |
Source: Horizon and Manage Appeals
Note: Appeals not yet validated are included in the number of appeals received but excluded from the calculation on proportion valid on first submission
Annex B: Proportion of Appeals decided within 20, 26 and 52 weeks - Decisions January 2025 to December 2025
| Within 20 weeks | Within 26 weeks | Within 52 weeks | More than 52 weeks | |
|---|---|---|---|---|
| Wholly Written Reps | 42.0% | 16.9% | 28.6% | 12.6% |
| Wholly or partly Hearings | 24.4% | 28.9% | 30.5% | 16.1% |
| Wholly or partly Inquiries | 12.3% | 26.7% | 40.5% | 20.5% |
Annex C: Decisions made wholly through written representations – Decisions January 2025 to December 2025 - Weeks from valid to Decision
Performance against Ministerial measures – note this takes different groupings (16 weeks and 20 weeks)
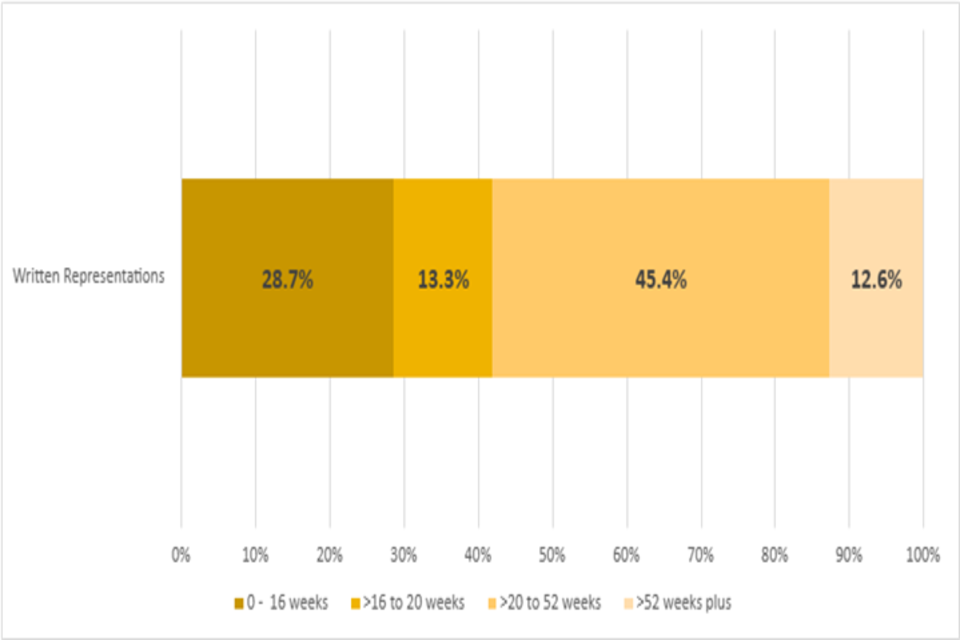
Bar chart showing data in Annex B (below)
Annex D - Percentiles for Valid to Decision (in weeks) for decisions made October to December 2025 and number of decisions in that time.
| Procedure | 25th percentile | 50th percentile | 75th percentile | 90th percentile | 100th percentile | Number of decisions |
|---|---|---|---|---|---|---|
| Written reps | 13 weeks | 18 weeks | 32 weeks | 66 weeks | 196 weeks | 4,878 |
| Hearing | 18 weeks | 24 weeks | 33 weeks | 62 weeks | 129 weeks | 158 |
| Inquiry | 20 weeks | 25 weeks | 34 weeks | 63 weeks | 161 weeks | 93 |
| All | 13 weeks | 19 weeks | 32 weeks | 66 weeks | 196 weeks | 5,129 |
Source: Horizon and Manage Appeals
Annex E - Appeal Decisions, 50th and 90th percentiles of Valid to Decision (weeks), January 2024 to December 2025 - by procedure
Note: all measurements are in weeks
Wholly by written representations
| Decision made: | 50th percentile | 90th percentile | Gap |
|---|---|---|---|
| Jan - Mar 24 | 29 | 54 | 25 |
| Apr - Jun 24 | 26 | 48 | 21 |
| Jul - Sep 24 | 26 | 45 | 19 |
| Oct - Dec 24 | 29 | 53 | 25 |
| Jan - Mar 25 | 27 | 54 | 27 |
| Apr - Jun 25 | 25 | 61 | 36 |
| Jul - Sep 25 | 20 | 66 | 46 |
| Oct - Dec 25 | 18 | 66 | 48 |
Wholly or partially through Hearings
| Decision made: | 50th percentile | 90th percentile | Gap |
|---|---|---|---|
| Jan - Mar 24 | 34 | 101 | 67 |
| Apr - Jun 24 | 29 | 91 | 61 |
| Jul - Sep 24 | 29 | 90 | 61 |
| Oct - Dec 24 | 35 | 105 | 70 |
| Jan - Mar 25 | 33 | 80 | 47 |
| Apr - Jun 25 | 24 | 49 | 25 |
| Jul - Sep 25 | 23 | 73 | 50 |
| Oct - Dec 25 | 24 | 62 | 38 |
Wholly or partially through Inquiries
| Decision made: | 50th percentile | 90th percentile | Gap |
|---|---|---|---|
| Jan - Mar 24 | 40 | 105 | 64 |
| Apr - Jun 24 | 47 | 100 | 52 |
| Jul - Sep 24 | 29 | 85 | 55 |
| Oct - Dec 24 | 28 | 81 | 53 |
| Jan - Mar 25 | 37 | 90 | 53 |
| Apr - Jun 25 | 34 | 108 | 74 |
| Jul - Sep 25 | 28 | 62 | 34 |
| Oct - Dec 25 | 25 | 63 | 38 |