Participation Survey October to December 2021: Main Report
Updated 13 February 2025
Applies to England

© Crown copyright 2025
This publication is licensed under the terms of the Open Government Licence v3.0 except where otherwise stated. To view this licence, visit nationalarchives.gov.uk/doc/open-government-licence/version/3 or write to the Information Policy Team, The National Archives, Kew, London TW9 4DU, or email: psi@nationalarchives.gov.uk.
Where we have identified any third party copyright information you will need to obtain permission from the copyright holders concerned.
This publication is available at https://www.gov.uk/government/statistics/participation-survey-october-to-december-2021-report/participation-survey-october-to-december-2021-main-report
13 February 2025 - A small number of figures have had revisions due to a minor processing error. The data tables in the October to December 2022 release (including October to December 2021) have been updated.
The October to December 2021 report has not been updated with these revisions. Please use the revised October to December 2021 data tables published as part of the October to December 2022 data tables for the latest estimates.
30 November 2023 - We have updated our breakdowns by disability status in the 2021/22 annual data tables to align with the Government Statistical Service harmonised standard. For further information, please see the update on the Participation Survey website.
The 2021/22 annual report has not been updated, and therefore please use the revised 2021/22 annual data tables, 2022/23 annual data tables and 2022/23 annual report for the latest disability estimates.
Background
Released: 20th April 2022
Geographic Coverage: England
This release provides provisional estimates[footnote 1] on participation in DCMS sectors reported during the period of October to December 2021. The Participation Survey is a nationally representative annual survey of adults (16+) in England that aims to track the latest trends in engagement in DCMS sectors. The survey is a push to web survey of adults, with a paper survey for those not digitally engaged.
This report presents the headline estimates for the core questions (questions asked to all respondents)[footnote 2] reported during October – December 2021. Further estimates can be found in the accompanying data tables. Differences between groups are only reported on in this publication where they are statistically significant i.e. where we can be more confident that the differences seen in our sampled respondents reflect the population[footnote 3].
Chapter 1 - Culture
1.1 Background
The Participation Survey collects information about the way adults (16+) engage with arts, heritage, museums and galleries, and library sectors, both in physical (in-person) and digital ways.
1.2 Key Findings
The graphic below shows the percentage of respondents who engaged physically (in person), digitally (online) and in total (either physical, digital or – for libraries – other) in the different cultural areas covered by the survey (arts, libraries, heritage and museums & galleries).
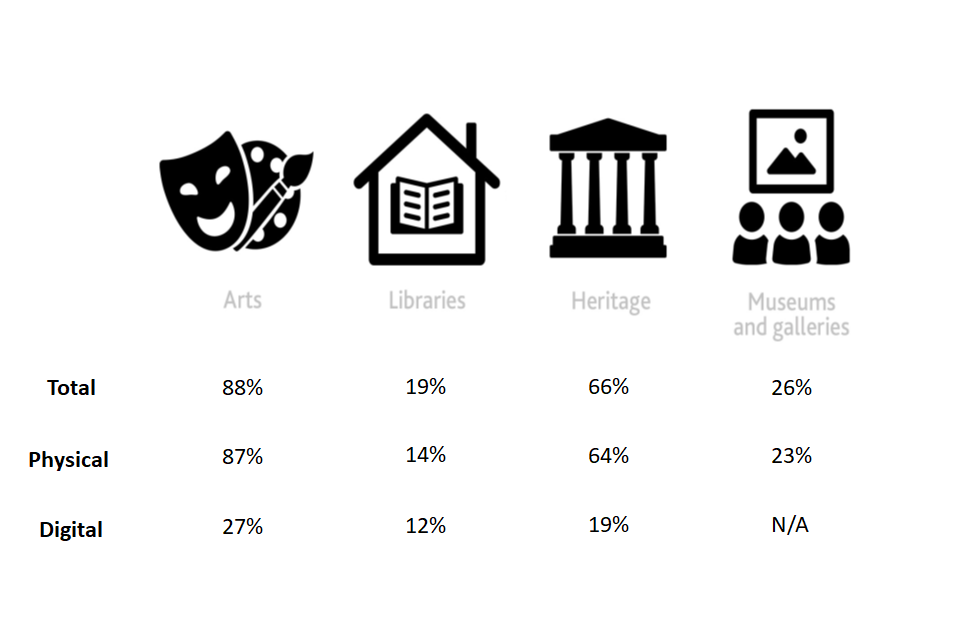
Figure 1.1: Cultural engagement (Arts, Libraries, Heritage and Museum & Galleries) in the previous 12 months, England: October to December 2021
- “A lack of interest” and “due to COVID-19 restrictions or concerns” were the most common barriers for engaging with cultural sectors.
The Participation Survey is a household self-completion survey (online survey with a paper survey for those not digitally enabled) of adults aged 16+ in England. This chapter summarises results related to cultural engagement reported during October to December 2021 for engagement in the previous 12 months.
Differences between groups are reported on in this publication only where they are statistically significant i.e. where we can be more confident that the differences seen in our sampled respondents reflect the population[footnote 3].
The Culture chapter is broken down into questions about arts, libraries, heritage and museums & galleries.
1.3 Arts
In October to December 2021, 88% of respondents had engaged with the arts physically or digitally at least once in the last 12 months. This means that they either participated in or attended an arts event. As Figure 1.2 shows, this proportion was 87% for engaging physically and 27% for engaging digitally; whilst 26% of respondents had engaged with the arts both physically and digitally, 61% had engaged with the arts physically but not digitally, and 1% of adults had engaged digitally, but not physically.

A Venn Diagram showing engagement with physical, digital and both for the arts sector. Physical engagement is in dark blue. Digital engagement in light blue with a white outline. The intersection is dark blue with a white outline.
In October to December 2021, an estimated 46% of adults reported that they had engaged with the arts three or more times in the last 12 months, whilst 14% had not engaged with the arts at all. In between these extremes, 19% had engaged with the arts once and 21% twice in the 12 months prior to responding to the survey.
The most common arts activity participated in was reading books or magazines (63% of respondents) followed by playing video games including on a smartphone or tablet (35%). Of those playing video games, 41% paid to play video games online. The most common arts event attended was a cinema screening – 34% of respondents. This was followed by a live music event (17%).
1.3.1 Who engages with the arts?
This section looks at the demographic breakdowns in arts engagement in England.
Age, Regions, Gender and Ethnicity
In October to December 2021, adults aged 75 and above (84%) engaged with the arts (attendance or participation) less in the previous 12 months than all other age groups except 45-64 year olds. Adults aged 16-24 years old (90%) engaged with the arts physically more than all other age groups except 65-74 year olds.
Interestingly, for digital arts engagement, the trends are different: adults aged 16-24 and 25-44 years old (24%) engaged less in the arts than other age groups (28-30%).

Horizontal bar chart, with error bars, showing physical and digital arts engagement in the previous 12 months, broken down by age. Physical is in dark blue. Digital is in light blue.
Respondents from the South East (91%) and South West (90%) were more likely to have engaged physically in the arts than those from all other regions except the North East.
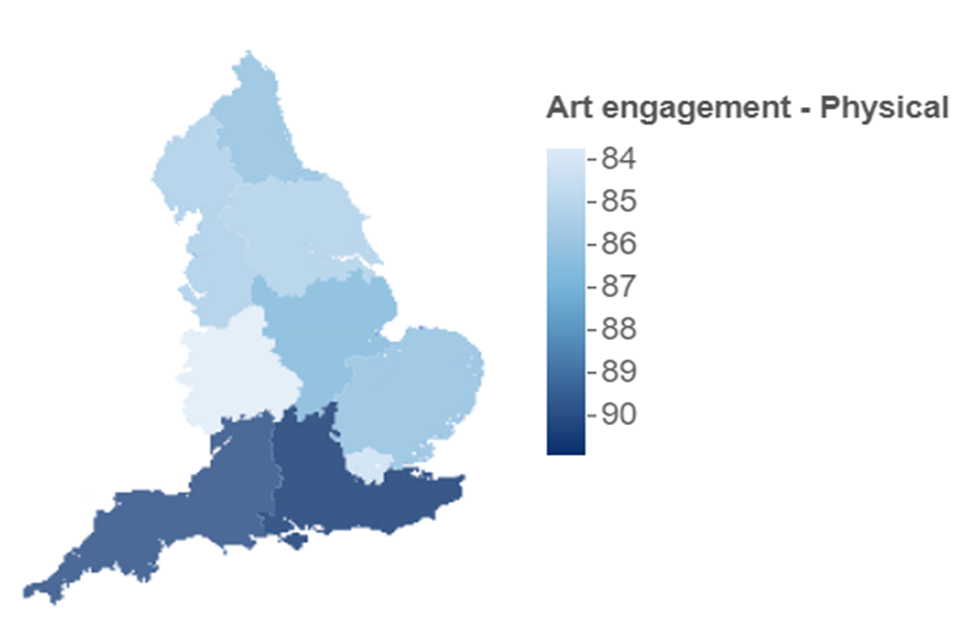
Map showing Physical arts engagement in the previous 12 months, broken down by region. The map is shaded from light to dark blue. The lightest blue region has the lowest engagement and the darkest blue has the highest.
Looking at the digital engagement in the arts, respondents from the South East and London (both 30%) were more likely to have engaged digitally in the arts than those from the West Midlands, East Midlands, Yorkshire and The Humber, North West and North East (23-25%) where digital engagement was lower.

Map showing digital arts engagement in the previous 12 months, broken down by region. The map is shaded from light to dark blue. The lightest blue region has the lowest engagement and the darkest blue has the highest.
Men [footnote 4] were less likely than women to report having engaged with the arts physically at least once in the previous 12 months – 85% compared with 88% respectively. For digital engagement in the arts, however, this gap is not present (both were 27%).
Respondents from a Black (78%) or Asian (77%) ethnic group were less likely to have engaged with the arts physically than respondents from a White (89%) or Mixed (86%) ethnic group. However, these findings were reversed when it came to digital arts engagement, where respondents from a Black ethnic group (34%) were the most engaged among these ethnic groups.
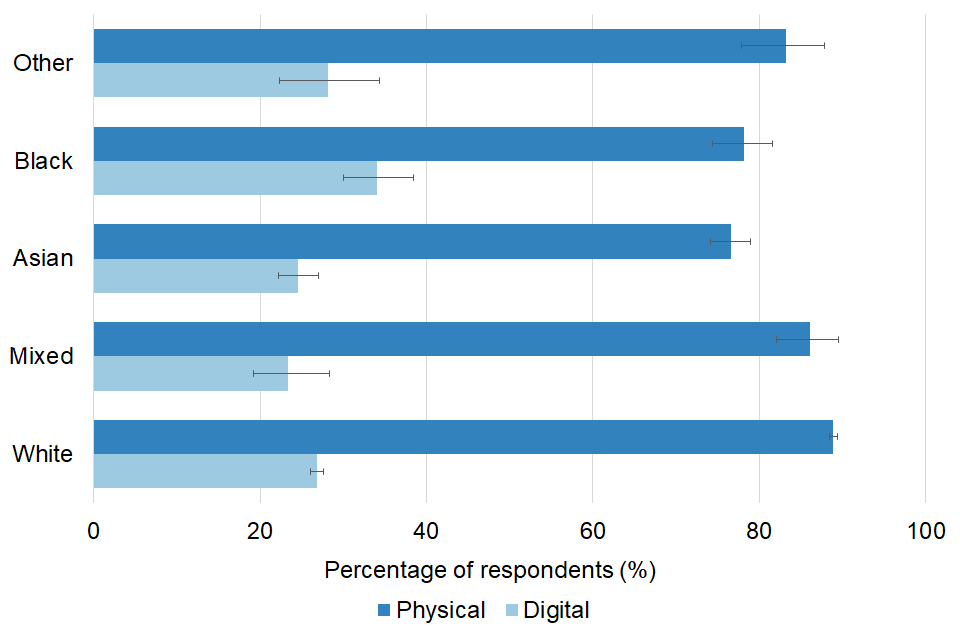
Horizontal bar chart, with error bars, showing physical and digital arts engagement, by ethnic group. The physical bars are in dark blue and the digital bars are in light blue.
Socio-economic variables
When it comes to physical engagement in the arts by respondents living in areas of deprivation, there is a negative correlation between engagement in the arts and areas of deprivation in these results; the higher the deprivation (using the index of multiple deprivation), the lower the engagement in the arts (figures ranging from 80% to 92%). This is mirrored by the following results:
- Engagement in the arts was higher for adults in the Higher Managerial, Administrative and Professional Occupations (93% versus 84% of those in Intermediate Occupations and 80% of those in Routine and Manual Occupations)
- Engagement in the arts was lower for adults living in the Social Rented Sector (78%) compared to the Private Rented Sector (85%) and Owners (89%)
For digital engagement in the arts the trends observed are similar. The most deprived area showed 20% engagement in the arts, compared to 31% in the least deprived areas. Additionally:
- 32% of those in Higher Managerial, Administrative and Professional Occupations engaged digitally in the arts, compared to 23% of respondents in Intermediate Occupations and 17% in Routine and Manual Occupations
- 17% of respondents living in the Social Rented Sector engaged digitally in the arts, compared to 25% of those in the Private Rented Sector and 29% of Owners
Further demographic data
- Physical engagement in the arts was lower for respondents identifying with a religion other than Christianity[footnote 5] (76%), compared to respondents identifying as Christian (88%) or as having no religion (90%).
- There was no significant difference in arts engagement for those reporting a long-standing illness or disability, and those without, for both physical (88%, 87%) and digital (28%, 27%).
- Adults living in a rural area were more likely to engage physically in arts than those from an urban area (90% vs 86%), but there was no difference for digital arts engagement (27-28%).
- Adults with a degree level or above (93%) were more likely to engage with the arts physically than adults with another kind of qualification (90%). This was similar for digital art engagement – 36% compared to 27% for adults with another kind of qualification.
1.3.2 Barriers to engaging
Respondents who did not attend or participate in arts events or activities were asked about the reasons why they did not.
- For physical engagement in the arts, “I’m not interested” (29%) and “Due to COVID-19 restrictions or concerns” (28%) were the most commonly reported reasons by respondents.
- For digital engagement in the arts, “No reason in particular” (45% of respondents) was the most commonly reported reason, followed by “I’m not interested” (29%). Note that a COVID-19 category was not applicable for the digital arts barriers question
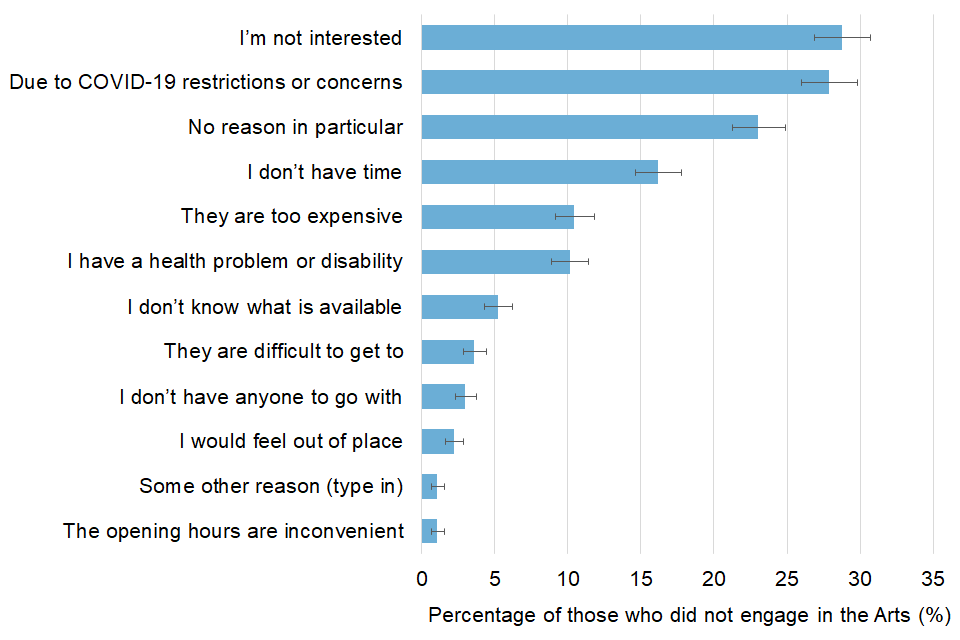
Figure 1.7: Barriers to physical arts engagement (reasons given for not engaging) in the previous 12 months, England: October to December 2021
1.4 Libraries
In October to December 2021, 19% of adults reported that they had engaged with a library service[footnote 6] in the previous 12 months, 14% of adults had engaged with library services physically (visited a public library building or mobile library in person at least once), whilst 12% had engaged digitally (using services digitally/online). There were 4% of adults who engaged with library services both physically and digitally in the previous 12 months.
The most common frequency for engagement was “less than once a month but around 3-4 times a year”. This applied to 32% of those who engaged physically in library services and 34% of those who engaged digitally in library services.
The most common activity for those who visited a library in person was borrowing, browsing or returning books, newspapers, music etc. (73%). This was followed by use of free Wi-Fi, computer or printing facilities (23%).
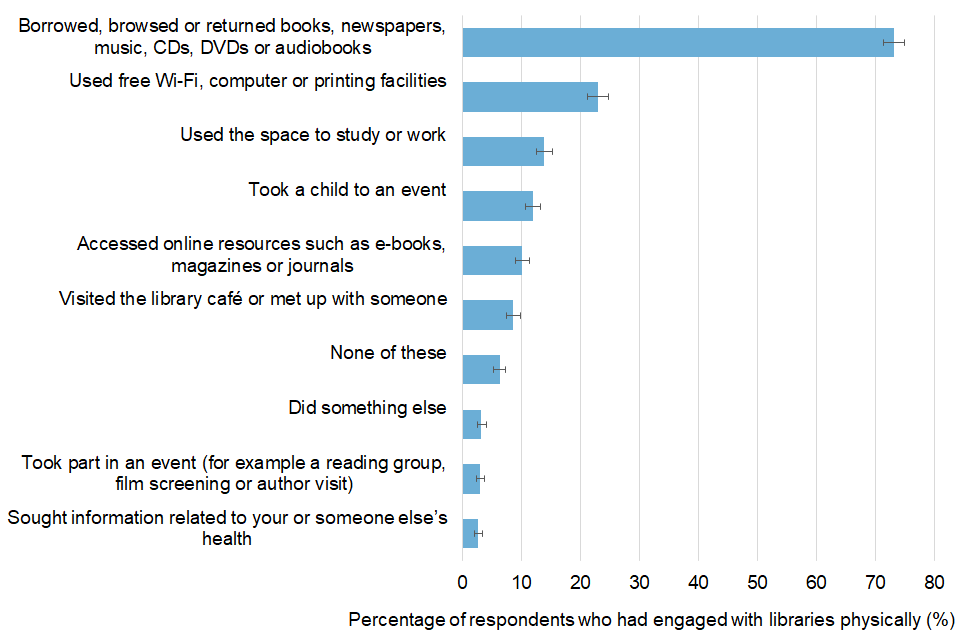
Horizontal bar chart, with error bars, showing physical library engagement, broken down by activity type, for those who had engaged physically with libraries
The most common online activities were borrowing digital or online resources; and searching online catalogues or dictionaries (both around 45%). This was followed by checking opening hours, available facilities or services offered (37%).
1.4.1 Who engages with library services?
This section looks at the demographic breakdowns in library services engagement in England.
Age, Regions, Gender and Ethnicity
Physical engagement with libraries varied by age group. In October to December 2021, adults aged 45 to 64 were the least likely to have engaged with libraries physically in the last 12 months (11%) compared to all other age groups (which ranged from 14% for the 16-24 age group to 18% for the 65-74 age group). For digital engagement in library services, adults aged 16-24 years old (17%) engaged more than adults of other age groups (9-14%).
For digital engagement, library engagement was highest for adults in London (16%). For physical engagement, there were no differences between regions [footnote 7].

Map showing physical library engagement by region. The map is shaded from light to dark blue. The lightest blue region has the lowest engagement percentage by respondents and the darkest blue has the highest.
Men[footnote 4] were less likely than women to report having engaged with the library physically at least once in the previous 12 months – 16% for women compared with 13% for men. This was similar for digital library engagement (13% for women compared to 11% for men).
Fewer respondents from a White ethnic group (14%) visited a library, compared to respondents from Black, Mixed, Asian or Other ethnic groups (ranging from 18-24%). This was similar for digital library engagement where respondents from a White ethnic group (11%) also engaged the least (Black, Mixed, Asian or Other ethnic groups ranged from 19 to 22%).
Socio-economic variables
When it comes to library visit breakdowns by socio-economic variables:
- There was no significant difference between areas of varying deprivation.
- Visits were higher from adults in the Higher Managerial, Administrative and Professional Occupations (17% versus 11% of those in Intermediate Occupations and 11% of those in Routine and Manual Occupations).
- Visits were lower from those in the Social Rented Sector (12%) compared to the those in the Private Rented Sector (14%) and those who are Owners (15%).
- 17% of respondents identifying as “Not working” visited the library in the past year, compared to 13% of respondents identifying as “Working”.
The above trends are similar for digital engagement with library services:
- There was no significant difference between areas of varying deprivation.
- Participation remained higher for adults in the Higher Managerial, Administrative and Professional Occupations (14% versus 8% for those in Intermediate Occupations or in Routine & Manual Occupations).
- Participation remained lower for adults living in the Social Rented Sector (10%) versus Owners (12%) and the Private Rented Sector (15%).
Further demographic data
- Physical engagement and digital engagement in library services were higher for those who identified as a religion other than Christianity[footnote 5], than those who identified as Christian or those who identified as having no religion.
- For physical engagement in libraries, the proportions were 18% for adults who identified as another religion, and 14% for those who identified as Christian or those who identified as having no religion.
- For online engagement in libraries, the proportions were 20% for adults who identified as another religion, 12% for those that identified as having no religion and 11% for those that identified as Christian.
- Library engagement was similar by disability status. For physical engagement in libraries, 14% of adults without a long-standing limiting illness or disability engaged compared to 15% with a disability. For digital engagement in libraries, 13% without a disability engaged compared to 12% with a disability
- Adults with a degree level or above (21%) were more likely to engage with the physical library services than adults with another kind of qualification (13%). This was similar for digital library engagement – 18% compared to 10% for adults with another kind of qualification.
1.4.2 Barriers to engaging
Respondents who did not engage with library services were asked why they did not. The most common reasons given were:
- For physical engagement in libraries, “I’m not interested” (30%) was most commonly identified, followed by both “No reason in particular” (26%) and “Due to Covid-19 restrictions or concerns” (25%).
- For online participation in libraries, “No reason in particular” (39%) was most commonly identified, followed by “I’m not interested” (34%). Note that a COVID-19 category was not applicable for the digital barriers question.
1.5 Heritage
As Figure 1.10 shows, two thirds (66%) of adults engaged with heritage sites physically (visited a heritage site in person at least once) or digitally (used heritage services digitally/online) in the previous twelve months; 64% visited in person, whilst 19% engaged online and 17% engaged both physically and digitally. There were 47% of adults who engaged with heritage physically but not digitally, whilst 2% of adults engaged with heritage digitally but not physically.

A Venn Diagram showing physical, digital and both engagement for the heritage sector. Physical engagement is in darker blue. Digital engagement in lighter blue with a white outline. The intersection is darker blue with a white outline.
The most common frequency of heritage engagement was “less than once a month but around 3-4 times a year”. This applied to 34% of adults engaging physically and 34% of adults engaging digitally.
When it comes to type of heritage site visited, the top three choices selected by respondents were:
- Park or garden open to the public with historic features (41% of those who visited a site)
- Celebrated historic city or town (39%)
- Historic landscape or habitat (36%)
When it came to digital engagement with heritage sites, which includes museums and galleries, out of all those asked:
- 10% researched their local history online
- 4% took a virtual museum or gallery tour in England
- 4% viewed documents from an archive in England online
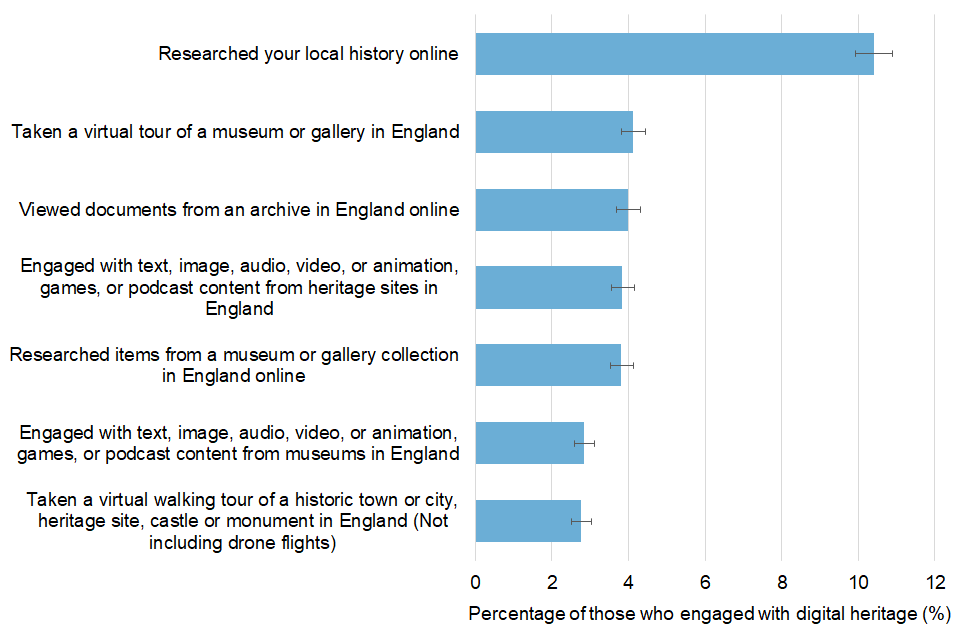
Horizontal bar chart, with error bars, showing digital heritage engagement, by activity, for those who engaged with digital heritage
1.5.1 Who engaged with heritage sites?
This section looks at the demographic breakdowns in heritage engagement in England.
Age, Regions, Gender and Ethnicity
Examining engagement with heritage sites by age group, findings showed that in October to December 2021:
- Visits to heritage sites were similar in percentage for those aged 25-44, 45-64 and 65-74 (66-67%). By contrast, adults aged 16-24 years old (56%) and those aged 75 and over (53%) were less likely to engage physically with (visit) heritage sites.
- 65-74 year olds (24%) were more likely to engage with heritage services digitally than other age groups.
Heritage engagement rates differ between regions in the results:
- Respondents from South West (71%) and South East (68%) were more likely to have visited in person in the previous 12 months than adults from other regions.
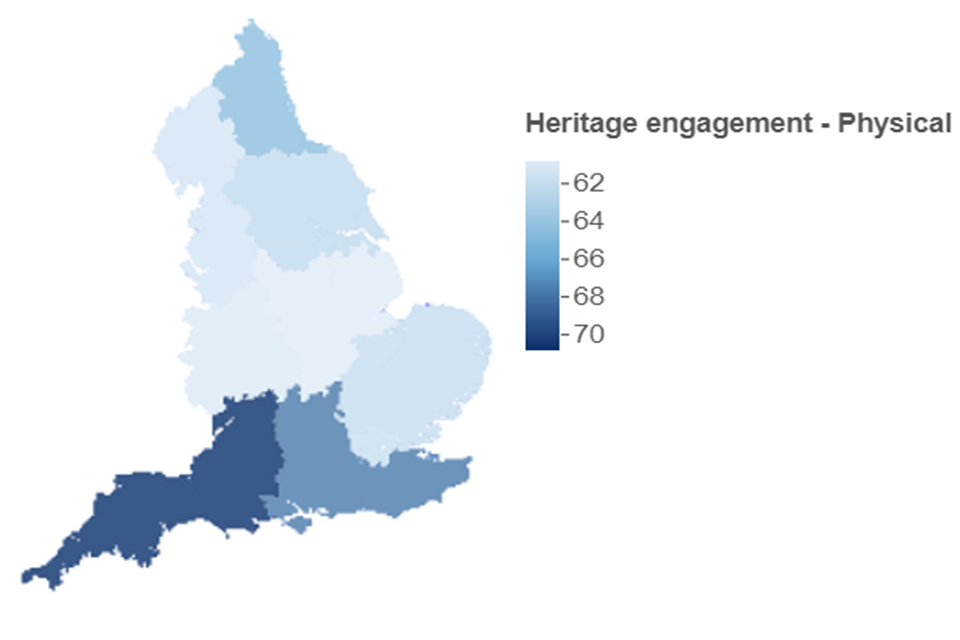
Map showing physical heritage engagement by region. The map is shaded from light to dark blue. The lightest blue region has the lowest engagement percentage by respondents and the darkest blue has the highest.
- For online engagement with heritage, respondents from London (24%) and the South East (22%) were more likely to engage digitally than adults from other regions.
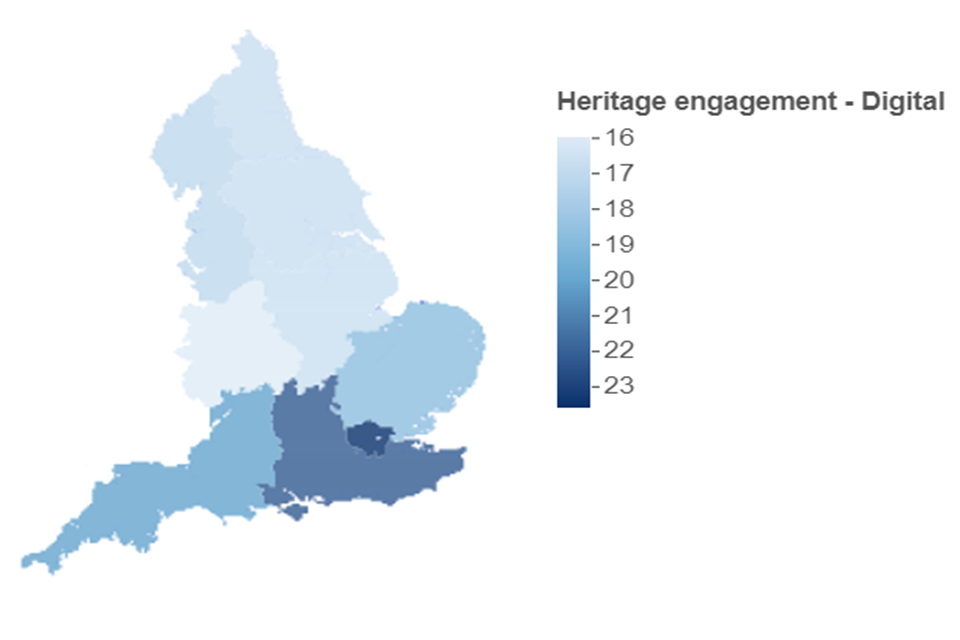
Map showing digital heritage engagement by region. The map is shaded from light to dark blue. The lightest blue region has the lowest engagement percentage by respondents and the darkest blue has the highest
There was no significant difference in physical engagement with heritage services between men[footnote 4] and women (63% and 64% respectively). However, men (21%) engaged digitally in heritage more than women (18%).
Visits by respondents from a White ethnic group (66%) was greater than those from Black, Mixed, Asian or Other ethnic groups. Respondents from a Black ethnic group (43%) had the lowest physical engagement out of these ethnic groups.
Socio-economic variables
When it comes to socio-economic variables:
- There was a negative correlation between physical engagement in heritage sites and deprivation; the higher the deprivation (the lower the index number of deprivation), the lower the engagement with heritage sites (it ranged from 49% to 74% across the spectrum). This is mirrored by the following results:
- Visits in person were higher from adults in the Higher Managerial, Administrative and Professional Occupations (74% versus 57% of those in Intermediate Occupations and 54% of those in Routine and Manual Occupations)
- Visits in person were lower from adults in the Social Rented Sector (40%) compared to those in the Private Rented Sector (59%) and Owners (70%)
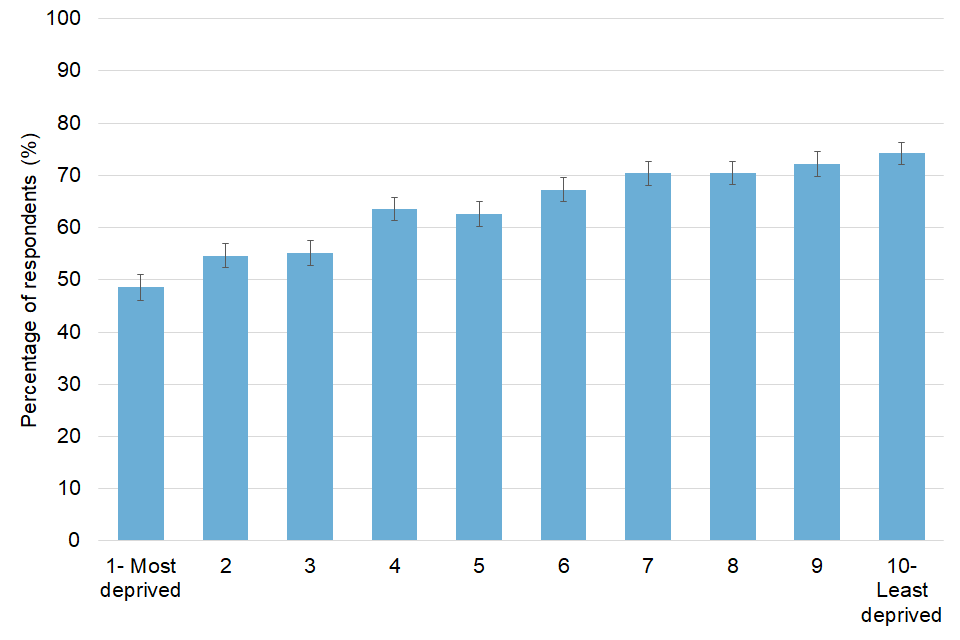
Vertical bar charts, with error bars, showing physical heritage engagement by Index of Multiple Deprivation. 1 denotes respondents from the most deprived area, 10 denotes those from the least deprived area
For digital engagement in heritage sites, there is still some evidence of this correlation but to a lesser extent, with engagement ranging from 15% in the most deprived areas to 24% in the least deprived areas.
- Similarly, 23% of those in the Higher Managerial, Administrative and Professional Occupations engaged with heritage sites digitally, versus 15% of those in Intermediate Occupations and 15% of those in Routine and Manual Occupations
- Finally, digital heritage engagement by respondents in the Social Rented Sector was only 14% compared with 19% in the Private Rented Sector and 20% for Owners
There is a disability gap with physical engagement with heritage – 67% of adults without a disability visited a heritage site, compared to 61% of adults with a disability. However, there was no significant difference between these groups for digital heritage engagement.

Vertical bar charts, with error bars, showing heritage engagement by Disability or Long-standing Illness. Bars showing physical engagement are in dark blue, digital engagement bars are in light blue
Further demographic data
- 52% of respondents who identified as having a religion other than Christianity[footnote 5] visited a heritage site in the 12 months previous to October to December 2021, compared to 66% of those who identified as Christians or who identified as having no religion.
- For digital engagement in heritage, there was no significant difference between the religious groups asked.
- 70% of respondents living in rural areas had visited a heritage site in the previous 12 months to October to December 2021, compared to 62% of urban respondents. The trend remained but is a smaller difference for digital engagement in heritage: 21% of rural versus 19% of urban.
- Adults with a degree level or above (80%) were more likely to engage with the physical heritage site than adults with another kind of qualification (65%). This was similar for digital heritage engagement – 27% compared to 18% for adults with another kind of qualification.
1.5.2 Barriers to engaging
As with the other sections in this chapter on Culture, respondents who did not engage in heritage sites were asked about the reasons why they did not, to help understand potential barriers to engaging.
When asked about physical engagement of heritage sites, “Due to Covid-19 restrictions or concerns” was the most common reason provided (33%), followed by “No reason in particular” (26%) and then “I’m not Interested” (22%).
For online engagement in heritage, “I’m not interested” was the most common reason provided (38%), followed by “No reason in particular” (35%). Note that a COVID-19 category was not applicable for the online barriers question.
1.6 Museums and Galleries
Over a quarter (26%) of adults engaged with museums and galleries physically (visited a museum or gallery in person at least once) or digitally in the last twelve months; 23% visited in person, while 5% did both. 18% of adults had engaged with museums or galleries physically but not digitally, whilst 3% of adults had engaged with museums or galleries digitally but not physically.
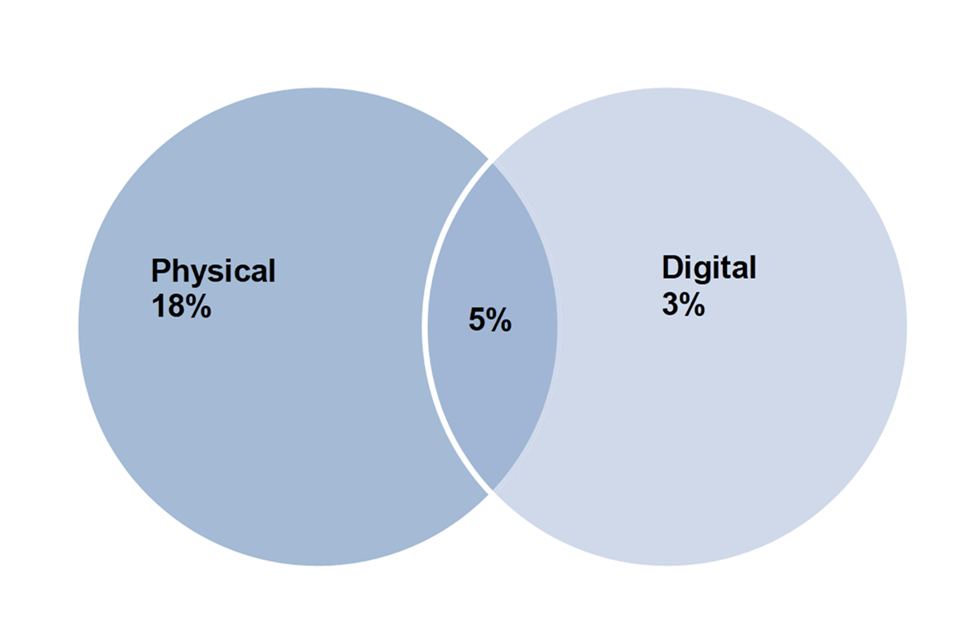
A Venn Diagram showing physical, digital and both engagement for museums and galleries. Physical engagement is in darker blue. Digital engagement in lighter blue with a white outline. The intersection is darker blue with a white outline
Of the respondents who had physically visited a museum or gallery in the last 12 months, the most common frequency was “once in the last 12 months” (38%). There are some commonalities between engagement with museum and galleries and heritage, but unlike physical heritage engagement where the most common frequency of visit is “Less often than once a month but at least 3 or 4 times a year”, physical engagement with (i.e. visits to) museums or galleries tended to be less frequent.
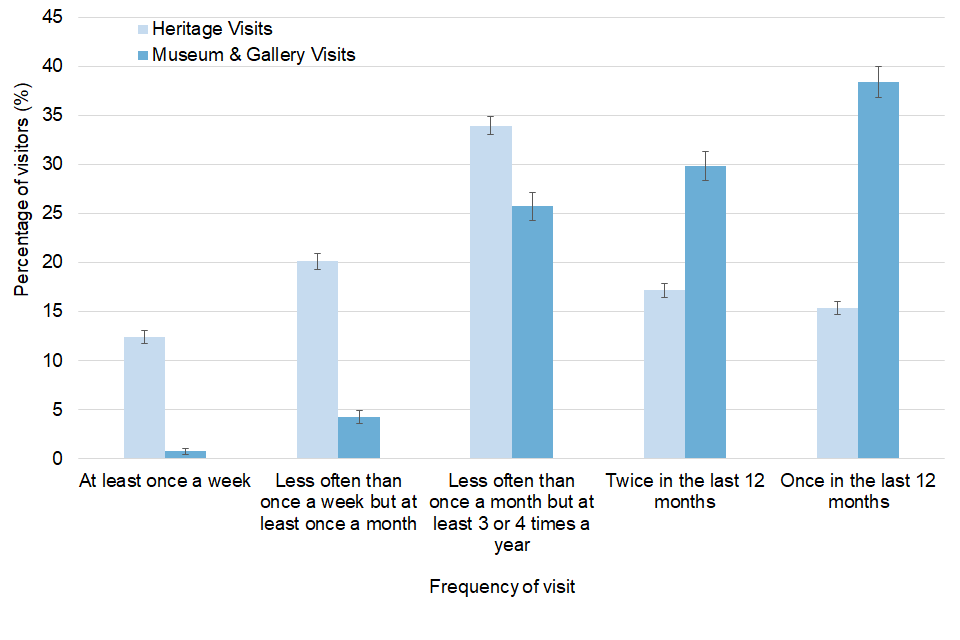
Vertical bar chart, with error bars, showing physical heritage and museums & galleries engagement by frequency of visit. Heritage estimates are in lighter blue bars and museums & galleries are in darker blue bars
When it comes to digital engagement with museums and galleries, 4% of adults reported taking a virtual tour of a museum or gallery in England, 4% researched items from a museum or gallery collection in England online, and 3% engaged with text, image, audio, video, animation, games or podcast content from museums in England online.
1.6.1 Who visits museums and galleries?
Digital engagement with museums and galleries is included in the survey questions on digital engagement with heritage, and demographic breakdowns are covered as part of that. Consequently, this section focuses only on physical museum or gallery visits.
Age, Regions, Gender and Ethnicity
Adults aged 75 years and over (14%) reported less engagement physically in museums and galleries than other age groups.
Looking at regional breakdowns, 31% of London respondents have visited a museum or gallery in the previous twelve months, greater than other regions (19%-24%).
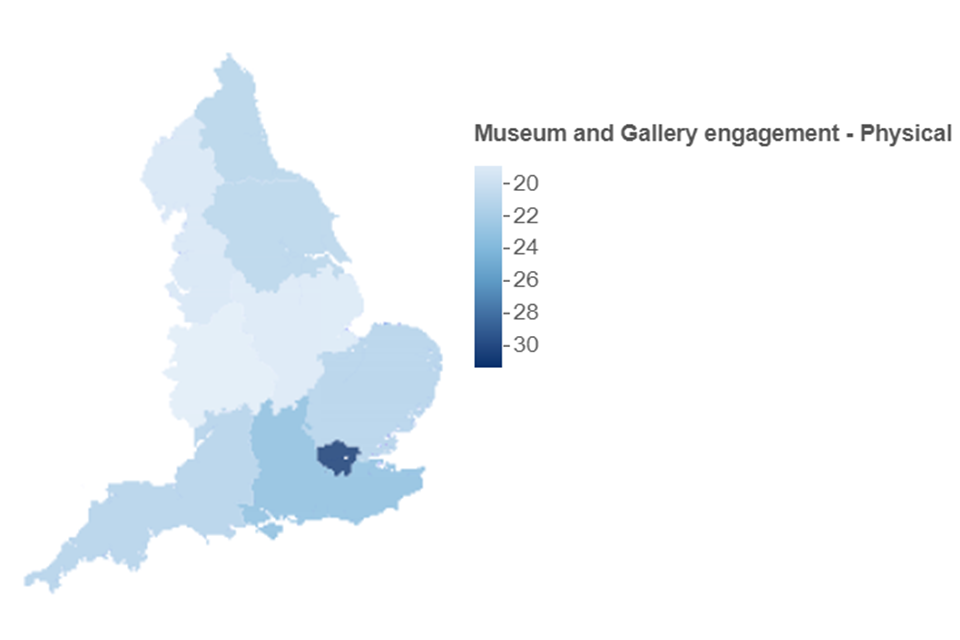
Map showing physical museums and galleries engagement by region. The map is shaded from light to dark blue. The lightest blue region has the lowest engagement percentage by respondents and the darkest blue has the highest.
Looking at gender breakdowns, there was no difference in engagement between men[footnote 4] and women, where 23% of men and women had visited a museum or gallery in the previous 12 months.
Looking at ethnic breakdowns, 13% of respondents from a Black ethnic group visited a museum or gallery in the past 12 months, less than from the White, Mixed, Asian or Other ethnic groups (21-28%).
Respondents reporting that they had a long-standing illness or disability (21%) were less likely to engage with museums or galleries, compared to those without (25%).
Socio-economic variables
Looking at socio-economic variables, there was a negative correlation between physical engagement and deprivation; the higher the deprivation (the lower the index number of deprivation), the lower the engagement with museums or galleries (it ranged from 15% to 27% across the spectrum). This is mirrored by the following results:
- Only 11% of adults in the Social Rented Sector visited a museum or gallery in the previous 12 months, compared to 25% of those who are Owners and 25% of those in the Private Rented Sector.
- 28% of adults in the Higher Managerial, Administrative and Professional Occupations visited a museum or gallery, versus 17% of those in the Intermediate Occupations and 15% of those in Routine and Manual Occupations.
- There is an employment gap: 25% of people in work visited a museum or gallery in the past 12 months, versus 20% of people not in work.
Further demographic data
Looking at other demographic variables:
- 25% of those who identified as having no religion visited a museum or gallery in the last 12 months, compared to 22% of those who identify as having a religion other than Christianity[footnote 5] and 21% of those who identify as Christian.
- There was no difference in museum or gallery visits of adults in urban or rural areas (23%).
- Adults with a degree level or above (37%) were more likely to engage with museums and galleries than adults with another kind of qualification (20%).
1.6.2 Barriers to engaging
Respondents who did not visit a museum or gallery in the previous 12 months in England were asked for the reasons why they didn’t. “Due to Covid-19 restrictions or concerns” was cited as the most common reason (36%), followed by “I’m not interested” (25%) and “No reason in particular” (23%).
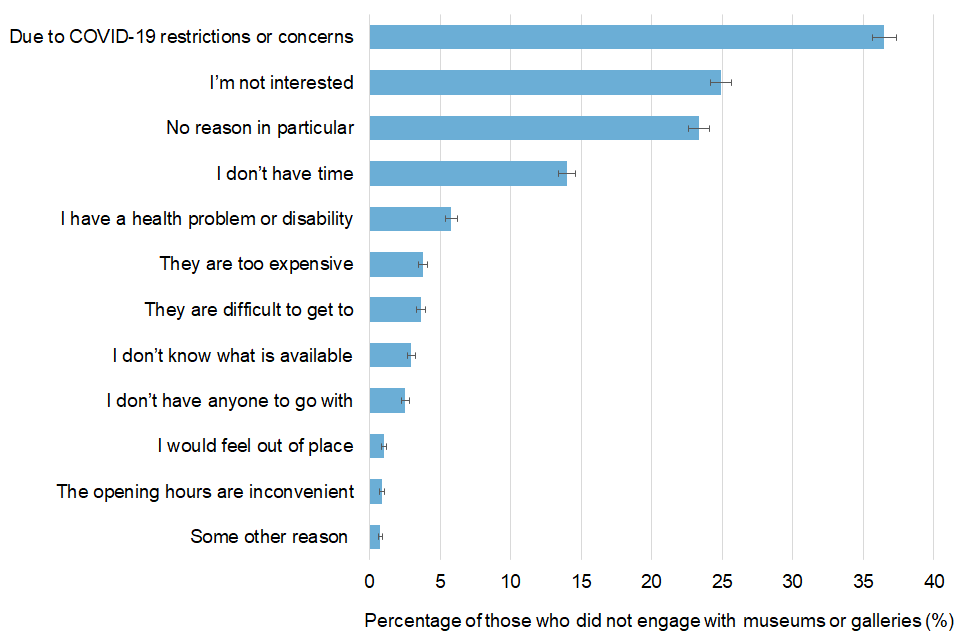
Figure 1.19: Barriers to physical museum & gallery engagement (reasons given for not engaging) in the previous 12 months, England: October to December 2021
Chapter 2 - Tourism
2.1 Background
The Participation survey collects information about the holiday patterns in England of adults (16+) within the last 12 months.
2.2 Key Findings
- Over half (55%) of adults took a holiday somewhere in England in the previous 12 months. Of these:
- 44% spent 3-6 nights away.
- 43% of adults that to said that they visited museums, galleries, heritage or cultural sites or events while they were away.
- Adults aged 75 and over, those living in London, adults with a long-standing limiting illness or disability, belonging to a non-White ethnic group, social housing dwellers, and those living in the most deprived deciles were less likely to take a holiday in England in the last 12 months.
The Participation Survey is a household self-completion survey (online survey with a paper survey for those not digitally enabled) of adults aged 16+ in England. This chapter summarises results collected from October to December 2021 related to the tourism sector and details about any holidays adults have taken in England in the last 12 months.
Differences between groups are reported on in this publication only where they are statistically significant i.e. where we can be more confident that the differences seen in our sampled respondents reflect the population[footnote 3].
2.3 Headline measures
Over half (55%) of adults took a holiday somewhere in England in the previous 12 months. Of these, 44% of adults spent 3-6 nights away, compared to 29% who stayed 1-2 nights and 20% who spent 7-10 nights away. Only 6% stayed more than 10 nights away.

Figure 2.1: Percentage of adults who took a holiday in England in the previous 12 months, by length of stay, England: October to December 2021
Of those who took a holiday, nearly a third (32%) stayed at a traditional coastal or seaside town; whilst over a quarter (26%) stayed in the countryside or village and over a fifth (21%) stayed in a city or large town. 43% of adults said that they visited museums, galleries, heritage or cultural sites or events while they were away.
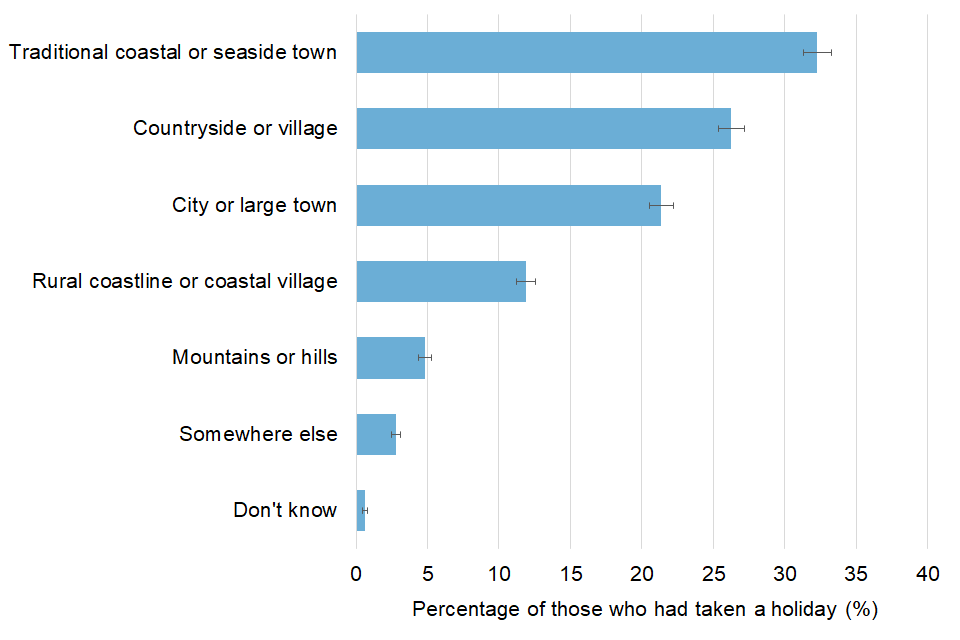
Figure 2.2: Percentage of adults who took a holiday in England in the previous 12 months, by type of place, England: October to December 2021
It is recognised that the period October to December 2021, plus the 12 months before it, were all heavily affected by COVID-19. It will be interesting to see how these findings evolve over future quarters and what is driving them. It is worth noting that “domestic” here focuses on holidays within England, rather than the wider United Kingdom of Great Britain & Northern Ireland.
2.4 Who engages with tourism?
This section looks at the demographic breakdowns in tourism (holidays taken in England).
Age, Regions, Gender and Ethnicity
Examining engagement with tourism by age group, findings showed that in October to December 2021, those aged 75+ were less likely (39%) to have taken a holiday in England in the past twelve months than other age groups; the younger age groups ranged from 52% (16-24) to 59% (45-64).
Adults from London (48%) were less likely to take a holiday in the last 12 months than other regions. Note that this refers to the region of residence, not (necessarily) the region they visited.
There was no difference between men[footnote 4] and women in terms of reporting having taken a holiday at least once in the last twelve months (55% of men and 56% of women).
Socio-economic variables
When it comes to tourism visit breakdowns by socio-economic variables:
- There is a broadly negative correlation between taking a holiday and deprivation. Only 39% on the lowest index of deprivation (the most deprived) took a holiday in England last year, compared to 66% of those on the highest index of deprivation (least deprived). In a similar vein:
- 35% of adults in the Social Rented Sector took a holiday, compared to 49% of those in the Private Rented Sector and 61% of those who are Owners.
- 64% of those in Higher managerial, Administrative and Professional Occupations took a holiday, compared to 50% of those in Intermediate Occupations and 46% of those in Routine and Manual Occupations.
- There is evidence of a tourism participation gap between respondents who were in work and respondents who were not in work: 63% of people in work took a holiday but only 46% of people not in work did.
However, there was also a clear disability gap (59% of respondents with no disability took a holiday in England in the previous 12 months; whilst 50% of respondents with a disability did likewise); and an urban/rural split (60% of rural dwellers took a holiday in England in the past 12 months versus 54% of urban dwellers).
Further demographic data
- 59% of those who identified as having no religion and 57% of those who identified as Christian reported taking a holiday in England in the past 12 months, but only 36% of those who identified as having another religion[footnote 5] did
- Adults with a degree level or above (66%) were more likely to have taken a holiday in England in the last 12 months than adults with another kind of qualification (58%).
Chapter 3 - Digital sector
3.1 Background
The Participation Survey collects information about the way adults (16+) engage with the digital sector in terms of engaging with the internet, the use of digital skills, owning smart devices and knowledge of 5G.
3.2 Key Findings
- Internet use was high across the board. 93% used it. Of these, there was a high proportion of adults who personally owned and used devices at home, including:
- 94% owned and used a WiFi router or internet hub
- 90% owned and used a Smartphone
- 61% owned and used a laptop computer
- A fifth (20%) of respondents have taken part in any digital or online skills training.
- Nearly a third (32%) of respondents said they would be interested in doing any digital or online training, although the majority said only if they did not have to pay for it.
- A fifth (20%) of respondents said that they would not be interested in doing any digital or online skills training because they prefer to upskill themselves
- Over two thirds of respondents thought it was either very or fairly important to continue to develop digital or online skills
- Awareness of 5G was strong. 71% understood what it is (37% were interested in getting it in the near future, 34% were not). Only 7% had not heard of it.
The Participation Survey is a household self-completion survey (online survey with a paper survey for those not digitally enabled) of adults aged 16+ in England. This chapter summarises results collected from October to December 2021 related to digital sector engagement, in particular the use of the internet, digital skills and 5G.
Differences between groups are reported on in this publication only where they are statistically significant i.e. where we can be more confident that the differences seen in our sampled respondents reflect the population[footnote 3].
3.3 Digital or online skills training
Nearly one in five (20%) adults reported that they had taken part in any digital or online skills training in the previous 12 months. Nearly a third (32%) of respondents said they would be interested in doing any digital or online training, although the majority said only if they did not have to pay for it. A fifth (20%) of respondents said that they would not be interested in doing any digital or online skills training because they prefer to upskill themselves, and nearly half of all respondents (49%) said that they would not be interested in doing any digital or online skills training. Despite this over two thirds of respondents thought it was either very or fairly important to continue to develop digital or online skills.

Doughnut chart showing the importance of continuing to develop digital or online skills. The colour shading ranges from light blue ("Not at all important") to dark blue ("Very important")
3.3.1 Who participated in digital or online skills training?
This section looks at the demographic breakdowns in digital or online skills training undertaken, in England.
Age, Regions, Gender and Ethnicity
Participation of digital or online skills training in the previous 12 months varied by age, with respondents from younger age groups (26% of 16-24 year-olds and 25% of 25-44 year-olds) being more likely to have participated in digital skills training than respondents from older age groups (8% of 65-74 years and 5% of those aged 75+).
Looking at breakdowns by region, 26% of London residents participated in digital skills training, greater than residents living in other regions, which ranged from 17% (North East) to 21% (West Midlands).
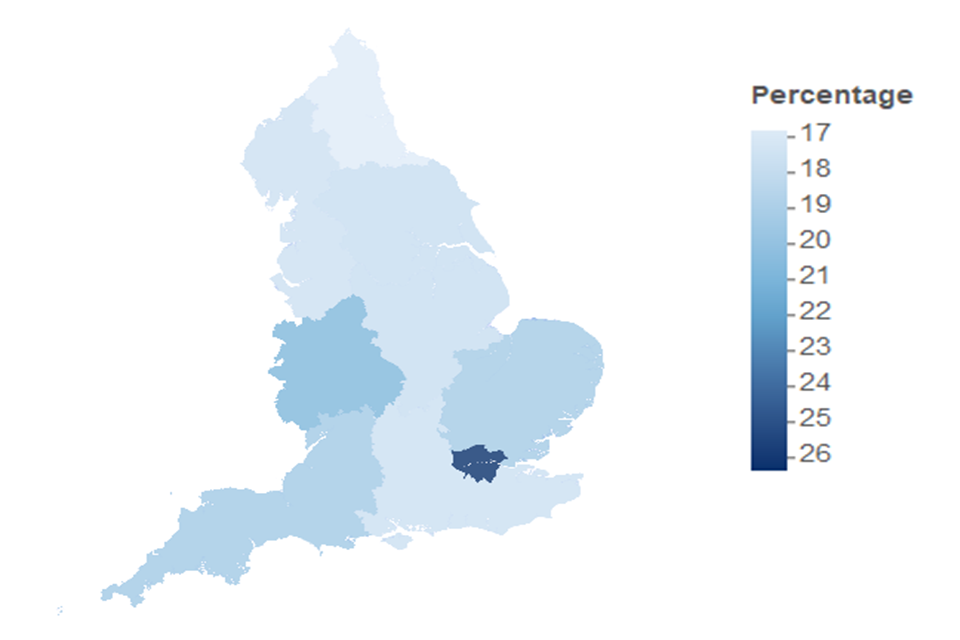
Map showing percentage of adults who had participated in digital or online training, by region. Shading is from light to dark blue. The lightest blue region has the lowest participation percentage by respondents and the darkest blue has the highest.
Looking at engagement by gender, men[footnote 4] had engaged with digital or online skills training more than women in the previous year (21% of men and 18% of women).
Looking at ethnicity breakdowns, respondents from a White ethnic group (18%) were less likely to have participated in a digital or online skills training in the previous 12 months, compared to Black, Mixed, Asian or Other ethnic groups.
There is a disability gap: 21% of those without a disability had undertaken digital skills training, versus 16% of those with a disability.
Socio-economic variables
- Over one in five adults (22%) who are in the Social Rented Sector and over a quarter (26%) of those in the Private Rented Sector reported that they had undertaken digital skills training in the previous 12 months, compared to only 17% of those who are Owners
- Over a fifth (21%) of those in Higher Managerial, Administrative and Professional Occupations had undertaken training, compared to 15% of those in Intermediate Occupations or Routine and Manual Occupations.
- Additionally, 23% of people in work had undertaken digital skills training in the past 12 months, versus just 13% of those not in work.
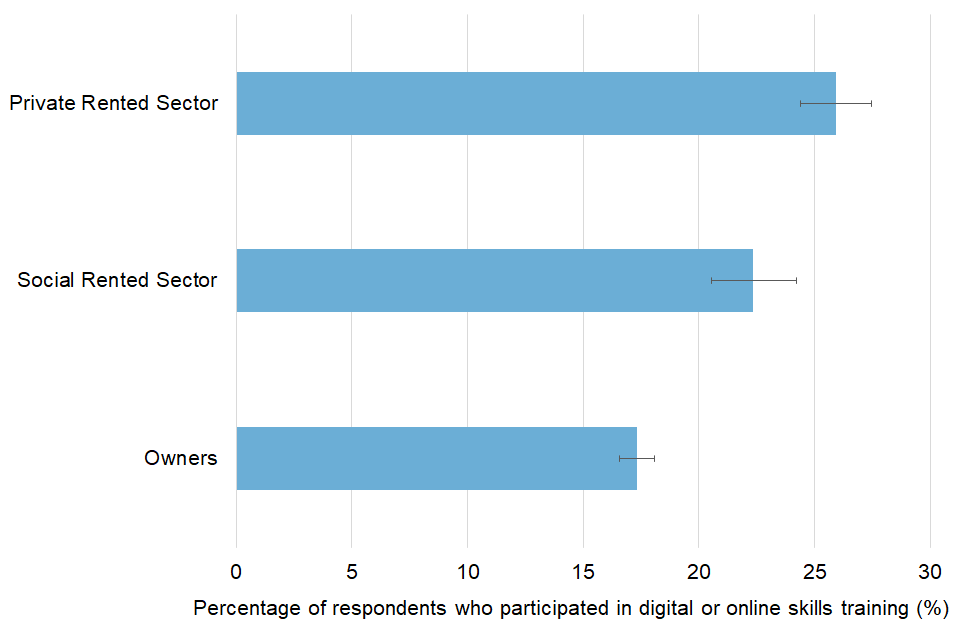
Figure 3.3: Percentage of adults who had participated in digital or online skills training in the previous 12 months, by tenure, England: October to December 2021
Further demographic data
- 28% of respondents who identified as having a religion other than Christianity[footnote 5] had participated in digital skills training in the past 12 months, compared to 19% of those who identified as Christian and 19% of those who identified as having no religion
- 21% of respondents from urban areas had participated in digital skills training, versus 16% of rural respondents
- Adults with a degree level or above (23%) were more likely to have participated in online or digital skills training than adults with another kind of qualification (18%).
3.4 Use of the Internet
In October to December 2021, 93% of adult respondents said that they use the internet, either at home or anywhere else. Over half (52%) responded that they use it almost all the time, whilst 37% said that they use it several times a day. Only 2% of adults use it less than several times a week.
Age, Regions, Gender and Ethnicity
- Two thirds of adults aged 75 and over use the internet, compared to significantly higher proportions for other age groups (91%-98%).
- Men[footnote 4] (94%) were more likely to use the internet than women (92%).
- There were no significant differences in internet use between regions
- There were no significant differences in internet use between ethnic groups.
- However adults without a long-standing illness or disability (96%) were more likely to use the internet than adults with (89%).
Socio-economic variables
- Adults from the most deprived areas were less likely to use the internet than adults from less deprived areas.
- Adults in the Social Rented Sector (87%) were less likely to use the internet than those in the Private Rented Sector (94%) or those who are Owners (94%).
- 97% of those in Higher Managerial, Administrative and Professional Occupations had undertaken training, a significant increase compared to those in Intermediate Occupations (92%) and those in Routine and Manual Occupations (89%).
- Additionally, 98% of people in work use the internet compared to 87% of adults who were not working.
Further demographic data
- Adults who identified as having no religion were more likely to use the internet than either those who identified as Christian or those who identified as another religion[footnote 5].
- There was no significant difference in the proportion of adults who use the internet in urban and rural areas.
- Adults with a degree level or above (99%) were more likely to use the internet than adults with another kind of qualification (97%).
3.5 Use of smart devices
Among the 93% of respondents who used the internet:
- 94% owned and used a WiFi router or internet hub
- 90% owned and used a Smartphone
- 61% owned and used a laptop computer
94% of adults said that they owned and used at home a Wi-Fi router or internet hub, whilst 39% of adults owned and used at home a Voice-activated personal assistant or smart speaker device. A further 31% of adults owned and used a smart energy device.
Respondents were asked on average, how long do they keep a smartphone before replacing it. The most common answer was “At least 2 years but less than 3 years” (37%) with a further 23% stating “At least 3 years but less than 4 years”.
The most common place to get a smart device from was a mobile phone network provider (49%), an online shop (39%) or in person from a high street or retail park (32%).
38% of adults responded that they pass their smart device onto family or friends once they no longer need them, whilst 35% kept them as spare. Over a quarter of respondents (27%) said that they traded the device in for another product.
3.6 5G
5G (which stands for fifth generation) is the next step in mobile technology. It offers faster mobile internet speeds. The questionnaire asked a series of questions about the respondents’ awareness and likelihood to use 5G. In October to December 2021, awareness of 5G was strong. 71% of adults understood what it is (37% were interested in getting it in the near future, 34% were not). Only 7% had not heard of it.
Further analysis of the 5G questions will be available in the annual release.
Chapter 4 - Major events
4.1 Background
The Participation Survey collects information about respondent’s knowledge and intended and actual participation in 4 major events: Her Majesty the Queen’s Platinum Jubilee, UNBOXED: Creativity in the UK, Birmingham Commonwealth Games 2022 and Coventry City of Culture.
4.2 Key Findings
-
Generally, awareness of these events is low, with the exception of Her Majesty the Queen’s Platinum Jubilee (61% of respondents were aware). 4% of respondents were aware of UNBOXED: Creativity in the UK, 39% of respondents were aware of Birmingham Commonwealth Games 2022 and 22% of respondents were aware of (the ongoing) Coventry City of Culture.
-
Of those that were aware of the events, interest in participation ranged from 50% for Coventry City of Culture to 81% for Her Majesty the Queen’s Platinum Jubilee. These respondents predominantly expressed interest in following events on radio and TV (including watching the event or news about the event), following events on social media, and/or participating in local events
-
Demographic breakdowns were variable. However, there was higher awareness of the events in Birmingham and Coventry within the relevant region where those events are taking place (the West Midlands – 69% and 45% of respondents respectively).
-
In a separate question, over three quarters of adults in England (76%) felt that they very or fairly strongly belonged to the United Kingdom.
The Participation Survey is a household self-completion survey (online survey with a paper survey for those not digitally enabled) of adults aged 16+ in England. This chapter summarises results collected from October to December 2021 related to major events in DCMS sectors.
Differences between groups are reported on in this publication only where they are statistically significant i.e. where we can be more confident that the differences seen in our sampled respondents reflect the population[footnote 3].
4.3 Her Majesty the Queen’s Platinum Jubilee
Over three in five (61%) respondents had heard of Her Majesty the Queen’s Platinum Jubilee. Of these:
- 54% intended to “follow coverage on TV or radio (including watching the event or news about the event)”
- 32% planned on “attending a local event”
- 19% planned to “follow on social media”
- 19% said “I am not interested in participating in this event”
4.3.1 Who is aware of Her Majesty the Queen’s Platinum Jubilee?
This section looks at the demographic breakdowns in awareness for the major event: Her Majesty the Queen’s Platinum Jubilee.
Age, Regions, Gender and Ethnicity
When looking at age breakdowns, awareness was lower in younger age groups, ranging from 47% for 16-24 year olds to 74% for those aged 75 and above.
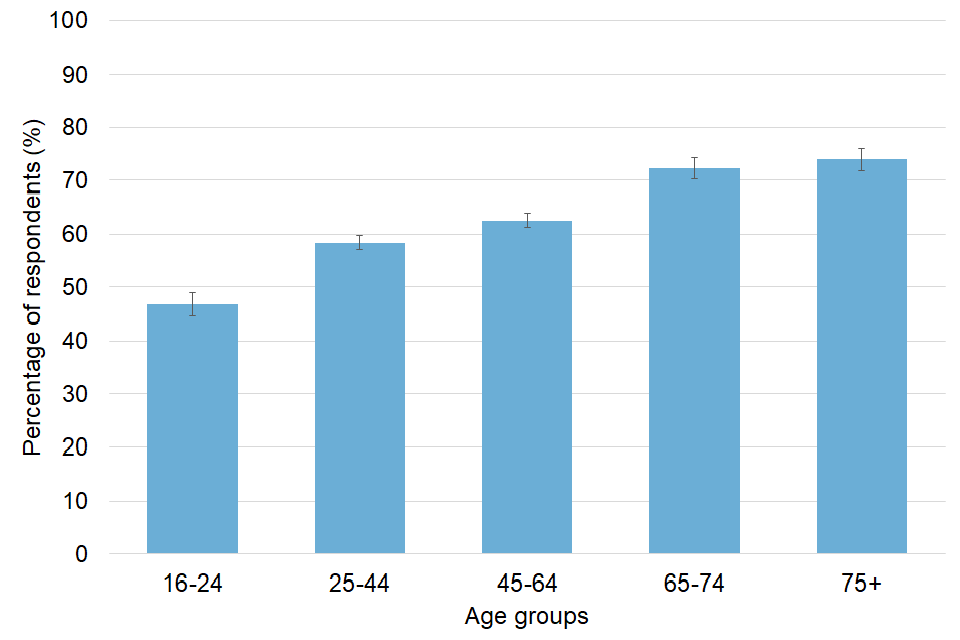
Vertical bar chart, with error bars, showing percentage of adults aware of Her Majesty the Queen’s Platinum Jubilee, broken down by age
Looking at individual regions, awareness was higher in the South East, South West and East of England than other regions.
Whilst nearly two thirds of women[footnote 4] were aware of this event (65%), less awareness was observed for men (59%).
Nearly two thirds (65%) of respondents from a White ethnic group showed awareness, a greater proportion than from Black, Mixed, Asian or Other ethnic groups.
Socio-economic variables
There was some variation between socio-economic variables:
- There is a broad correlation between awareness and deprivation. Nearly half (49%) of respondents in the most deprived areas showed interest, compared to 67-70% for the four least deprived areas.
- 68% of adults in Higher Managerial, Administrative and Professional Occupations were aware of the event, compared to 61% of those in Intermediate Occupations and 56% of those in Routine and Manual Occupations.
- 67% of adults who are Owners were aware, compared to 52% both for those in the Social Rented Sector and those in the Private Rented Sector.
- There was no significant difference between adults who worked and did not work.
Further demographic data
- 45% of respondents who identified as having a religion other than Christianity[footnote 5] had an awareness, compared to a significantly higher proportion for the other religious groups (58% for respondents who identified as having no religion and 69% of respondents who identified as Christian).
- 65% of respondents who had a disability were aware, compared to 61% of respondents who did not have a disability.
- 69% of rural respondents were aware compared to 60% of urban respondents.
- There was no significant difference in awareness between adults with a degree level or above, and those with another kind of qualification.
4.4 UNBOXED: Creativity in the UK
4% of respondents had heard of UNBOXED: Creativity in the UK. Of these:
- 32% planned to “follow coverage on TV or radio (including watching the event or news about the event)”
- 31% planned on “attending a local event”
- 25% said ”I am not interested in participating in this event”
4.4.1 Who is aware of UNBOXED: Creativity in the UK?
This section looks at the demographic breakdowns in awareness for the major event: UNBOXED: Creativity in the UK.
When looking at age breakdowns, awareness was lower in older age groups, ranging from 3% for 75 year olds and older, to 7% for those aged 16-24.
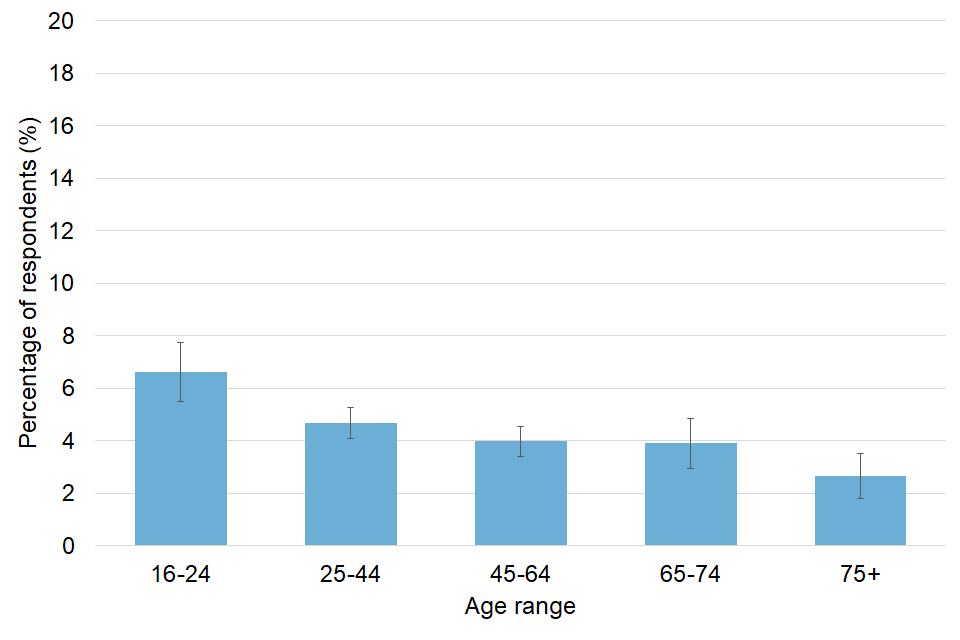
Vertical bar chart, with error bars, showing percentage of adults aware of UNBOXED: Creativity in the UK, broken down by age
Looking at ethnicity breakdowns, 8% of respondents from a Mixed ethnic group were aware of UNBOXED: Creativity in the UK, significantly higher than those of either White, Black, Asian or Other ethnic groups.
Overall, beyond these examples, there was no significant difference in awareness between different demographic groups in a range of demographic breakdowns. For example, there was no significant difference in awareness between respondents in different regions, between men[footnote 4] and women, between respondents with a long-standing illness or disability or those without, or between different socio-economic groups (e.g. respondents from areas of varying deprivation, respondents of different housing tenure, respondents in different occupation groups etc.).
4.5 Birmingham Commonwealth Games 2022
Nearly two in five (39%) respondents had heard of Birmingham Commonwealth Games 2022. Of these:
- 56% planned on “following coverage on TV or radio (including watching the event or news about the event)”
- 18% said they will be “attending a national event”
- 17% said they will be “following on social media”
- 24% said “I am not interested in participating in this event”
4.5.1 Who is aware of Birmingham Commonwealth Games 2022?
This section looks at the demographic breakdowns in awareness for the major event: Birmingham Commonwealth Games 2022.
Age, Regions, Gender and Ethnicity
When looking at age breakdowns, awareness was lower in younger age groups:
- 28% of 16-24 year olds and 33% of 25-44 year olds were aware, compared to 50% of 65-74 year olds and 47% of respondents aged 75 and above.

Vertical bar chart, with error bars, showing percentage of adults aware of Birmingham Commonwealth Games 2022, broken down by age
Looking at individual regions, awareness was not surprisingly highest in the West Midlands, where Birmingham is situated, and where 69% of respondents were aware of the event. Other regions ranged from 28% (London) to 42% (East Midlands).
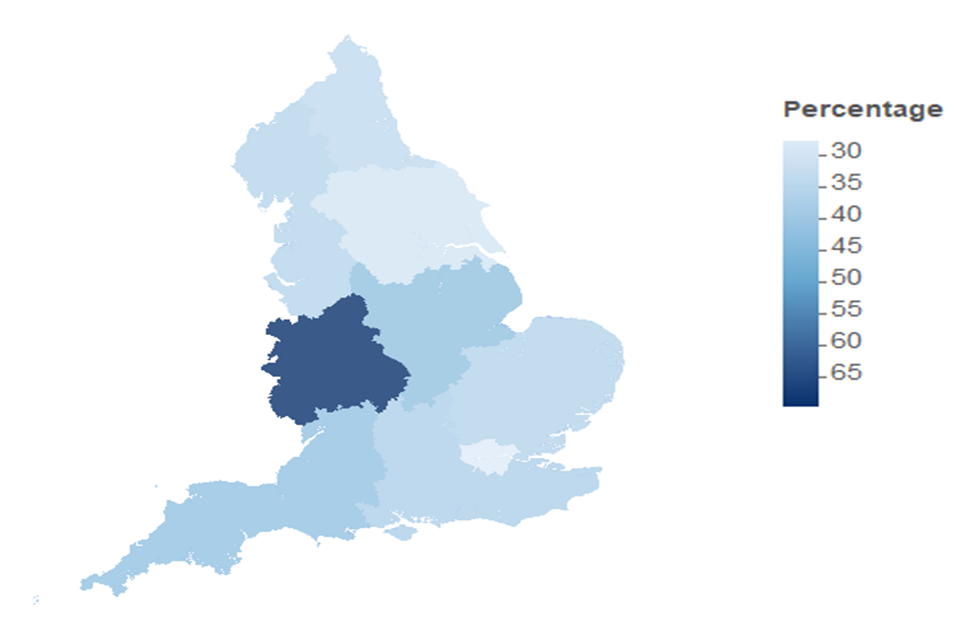
Map showing percentage of adults aware of Birmingham Commonwealth Games 2022, broken down by region. Shading is from light to dark blue. The lightest blue region has the lowest awareness percentage by respondents and the darkest blue has the highest.
More men[footnote 4] (42%) were aware of the Birmingham Commonwealth Games 2022 than women (36%).
Looking at ethnicity breakdowns, 41% of respondents from a White ethnic group were aware, higher than those in the Black, Mixed, Asian or Other ethnic groups.
Socio-economic variables
Looking at the socio-economic variables:
- There is a broad correlation between awareness and deprivation. Respondents in the most deprived areas only showed 30% awareness, compared to 45-48% for the four least deprived deciles.
- 45% of adults in the Higher Managerial, Administrative and Professional Occupations were aware, compared to 38% of those in Intermediate Occupations and 31% of those in Routine and Manual Occupations.
- 45% of those who are Owners were aware, compared to 29% of those in the Private Rented Sector and 26% of those in the Social Rented Sector.
Further demographic data
- Awareness among religious groups was highest for those who identified as Christian (44%), followed by those who identified as having no religion (37%) and those who identified as another religion[footnote 5] (28%)
- There was no significant difference in awareness between adults with a long-standing illness or disability, and those without.
- There was no significant difference in awareness between adults with a degree level or above, and those with another kind of qualification.
4.6 Coventry City of Culture
Over a fifth (22%) of respondents had heard of Coventry City of Culture, which runs from May 2021 to May 2022. Of these:
- 50% said ”I am not interested in participating in this event”
- 29% planned on “following coverage on TV or radio (including watching the event or news about the event)”
4.6.1 Who is aware of Coventry City of Culture?
This section looks at the demographic breakdowns in awareness for the major event: Coventry City of Culture.
Age, Regions, Gender and Ethnicity
When looking at age breakdowns, awareness was lower in younger age groups:
- 8% of 16-24 year olds and 14% of 25-44 year olds were aware, whilst
- 37% of both 65-74 year olds and respondents aged 75 and above were aware
Looking at individual regions, it was not surprising that the highest awareness was in the West Midlands, where Coventry is situated, and where 45% of respondents were aware of the event. Other regions ranged from 16% (London) to 26% (East Midlands).
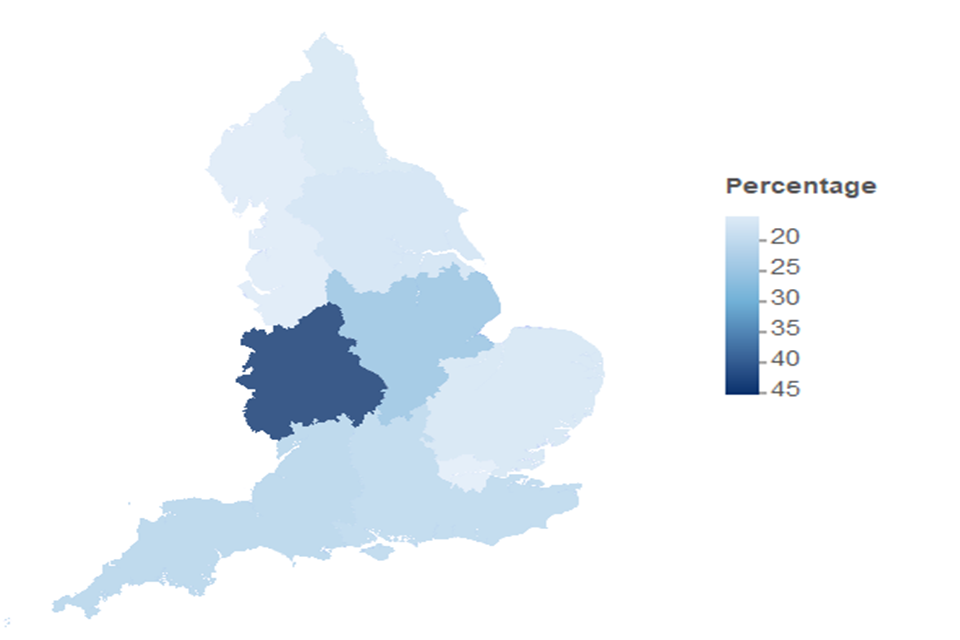
Map showing percentage of adults aware of Coventry City of Culture, broken down by region. Shading is from light to dark blue. The lightest blue region has the lowest awareness percentage by respondents and the darkest blue has the highest.
Men[footnote 4] were more likely to be aware (24%) of Coventry City of Culture, compared to women (21%). Over a quarter (26%) of those with a disability were aware, compared to just over a fifth (21%) of those who do not.
Looking at ethnicity breakdowns, 24% of respondents from a White ethnic group are aware of Coventry City of Culture, an increase on Black, Mixed, Asian or Other ethnic groups. Respondents from a Black ethnic group were more likely to be aware than respondents from a Mixed or Asian ethnic group.
Vertical bar chart, with error bars, showing percentage of adults aware of Coventry City of Culture, broken down by ethnic group
Socio-economic variables
Looking at socio-economic variables:
- There is a broad correlation between awareness and deprivation. Respondents in most deprived areas only showed 15% awareness, compared to 27-28% for the four least deprived areas.
- 28% of adults in Higher Managerial, Administrative and Professional Occupations were aware of the event, compared to 20% of those in Intermediate Occupations and 14% of those in Routine and Manual Occupations.
- 27% of adults who are Owners were aware, compared to 14% of those in the Private Rented Sector and 11% of those in the Social Rented Sector.
- Adults not working were more likely to be aware of Coventry City of Culture than adults who were in work (27% vs 20%).
Further demographic data
- Awareness among religious groups was highest for those who identified as Christian (26%), compared to those who identified as another religion[footnote 5] and those who identified as having no religion.
- Awareness was higher among rural respondents than urban (28% versus 21%).
- Awareness was higher for adults with a degree level or above (31%) compared to adults with another kind of qualification (22%).
Chapter 5 - Live Sports
5.1 Background
The Participation Survey collects information about respondent’s attendance at live sports within the past 6 months.
5.2 Key Findings
- 17% watched live sport in person in the previous six months.
- Of those sports, football was the most watched (63%), followed by other (19%) and rugby (14%).
- Attendance at live sports in person was highest for men and adults without a long-standing illness or disability.
5.3 DCMS Participation Survey
The Participation Survey is a household self-completion survey (online survey with a paper survey for those not digitally enabled) of adults aged 16+ in England. This chapter summarises results collected from October to December 2021 related to live sport attendance.
Differences between groups are reported on in this publication only where they are statistically significant i.e. where we can be more confident that the differences seen in our sampled respondents reflect the population[footnote 3].
5.4 Headline measures
Just over one in six adults had watched a live sporting event in person in the previous 6 months. Of these adults, football was the most commonly watched (63%), followed by other (19%) and rugby (14%). Two thirds (67%) of respondents said all of these events were professional sports where the participants were being paid whilst a further 7% said most of them were. Only 15% of respondents said none of the events were professional sports where the participants were being paid.
5.5 Who attends live sporting events?
This section looks at the demographic breakdowns in attendance at live sporting events.
Age, Regions, Gender and Ethnicity
Over a fifth (21%) of 16-24 year olds went to a live sporting event, an increase on older age groups. Adults aged 65-74 and 75 and over were less likely to watch a live sport in person than all other age groups.
There were no differences in the proportion of adults within each region who attended a live event.
Looking at the split by gender, there is a pronounced gap. 24% of men[footnote 4] but only 10% of women attended a live sporting event in the past 6 months. There is also a disability gap: 19% of adults without a long-standing illness or disability attended a live sporting event compared to 13% of those with a long-standing illness or disability.
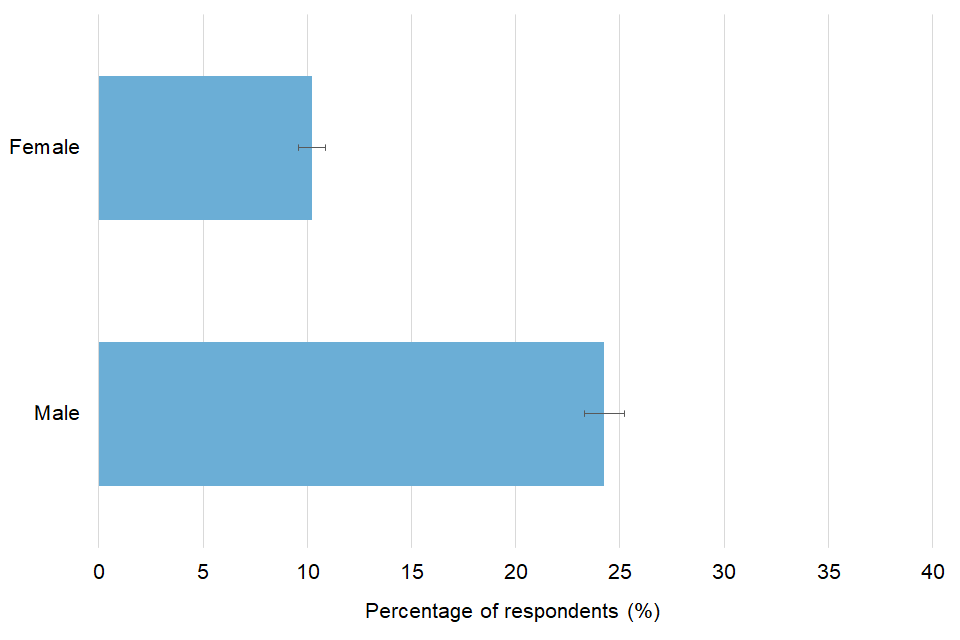
Horizontal bar chart, with error bars, showing percentage of adults who have watched a live sport in person, broken down by gender (male or female only, see footnote)
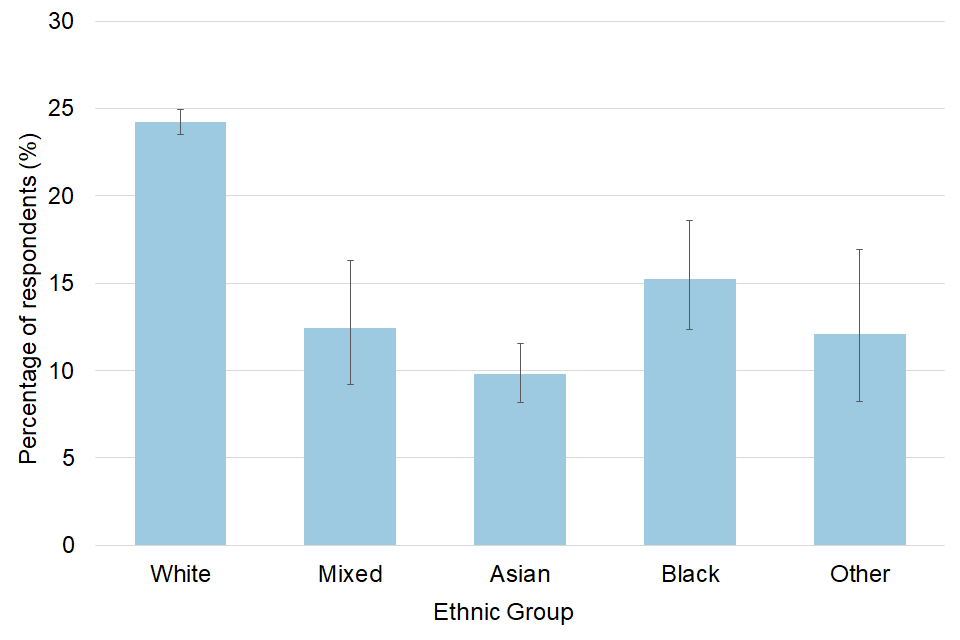
Adults from a White ethnic group (18%) were more likely to have watched a live sport in person in the last 6 months than adults from Black, Asian or Other ethnic groups. Adults from a Mixed ethnic group (16%) were more likely to have watched a live sport in person than adults from a Black (9%) ethnic group.
Socio-economic group
Looking at socio-economic variables:
- There is some correlation with deprivation. Around 12-15% of people in most deprived areas went to an event, compared to 19-21% for the least deprived.
- Attendance was lower for adults in the Social Rented Sector (11%), compared to those in the Private Rented Sector (17%) and those who are Owners (18%).
- Those not working (12%) were less likely to attend a live sport in person than those working (20%).
Further demographic data
- 13% of those who identify as a religion other than Christian[footnote 5] attended a game, lower than either those who identify as Christian (16%) or those who identify as having no religion (19%).
- There was no significant difference in awareness between adults with a degree level or above, and those with another kind of qualification.
Annex A - Supporting information
- The Participation survey is commissioned by the Department for Digital, Culture, Media and Sport.
- The fieldwork for the Participation survey has been conducted by Kantar Public, since October 2021.
- This release is based on self-completed questionnaires conducted either online or using paper questionnaires. The survey was completed between October and December 2021. The total sample size for this quarter was 16,227. Sample sizes for each breakdown can be found in the accompanying tables. All households sampled were invited to complete the survey online with the option to request a paper version. A targeted sample was also sent two paper questionnaires in their second reminder letter to encourage responses from those at risk of digital exclusion. In October to December 2021, 13,536 people (83%) completed the survey online and 2,691 (17%) completed the paper version of the questionnaire. Due to space limitations in the paper questionnaire, not all questions from the online survey are included in the paper version and the source of each survey measure is referenced in the accompanying charts and tables.
- Participation Survey is an Official Statistic and as such has been produced to the professional standards set out in the Code of Practice for Statistics. Official Statistics undergo regular quality assurance reviews to ensure they meet customer needs and are produced free from any political interference. See the UK Statistics Authority’s Code of Practice for more information.
- Stringent quality assurance procedures have been adopted for this statistical release. All data and analysis has been checked and verified by at least two different members of the DCMS team and Kantar Public to ensure the highest level of quality.
- Guidance on the quality that is expected of Participation Survey statistical releases is provided in a quality indicators document. These quality indicators outline how statistics from the Participation survey match up to the six dimensions of quality defined by the European Statistical System (ESS). These are: relevance, accuracy, timeliness, accessibility, comparability and coherence.
- The Participation survey measures participation by adults (aged 16 and over) living in private households in England. No geographical restriction is placed on where the activity or event occurred.
- Unless stated, participation in activities must be for the purpose of recreation or leisure, including voluntary work. It excludes involvement in activities where the prime motivation is paid work or academic studies.
- All estimates have been rounded to one decimal place within the data tables.
- Changes over time and differences between groups are only reported on where they are statistically significant at the 95% level. Statistically significant differences have been determined in this report on the basis of non-overlapping confidence intervals. This means that we can be confident that the differences seen in our sampled respondents are reflective of the population. Specifically, the statistical tests used mean we can be confident that if we carried out the same survey on different random samples of the population, 95 times out of 100 we would get similar findings. When sample sizes are smaller we can be less confident in our estimates so differences need to be greater to be considered statistically significant.
- The upper and lower bounds presented in this report have been calculated using a 95% confidence interval. This means that had the sample been conducted 100 times, creating 100 confidence intervals, then 95 of these intervals would contain the true value. When the sample size is smaller, as is the case for certain groups and in certain years, the confidence intervals are wider as we can be less certain that the individuals in the sample are representative of the population. This means that it is more difficult to draw inferences from the results.
- The data are weighted to ensure representativeness of the Participation Survey sample. Weighting is based on August-October 2021 Labour Force Survey data from the Office for National Statistics. There are two types of weighting: (i) to compensate for unequal probabilities of selection, (ii) to adjust for non-response
- The GSS has a policy of monitoring and reducing statistical survey burden to participants where possible, and the burden imposed should be proportionate to the benefits arising from the use of the statistics. As a producer of statistics, DCMS is transparent in its approach to monitoring and reducing the burden on those providing their information, and on those involved in collecting, recording and supplying data. The compliance cost of a survey is calculated by [Number of responses to the survey Median time spent completing the survey (minutes)]. The Participation Survey had 16,227 respondents in October to December 2021, and the median survey completion time was 29 minutes, therefore the compliance cost for this survey this quarter was 130 hours and 43 minutes.
- For more information about the Participation survey and to access other guidance documents and the questionnaire, see the Participation Survey web pages.
- The responsible statistician for this release is Rishi Vaidya. For enquiries on this release, please contact ParticipationSurvey@dcms.gov.uk.
Annex B - Terms and definitions
| Term | Definition |
|---|---|
| Arts | A list of activities that are classified as engagement with the arts is given in Annex C |
| Asian ethnic group | Respondents who described their ethnic group or background as Indian, Pakistani, Bangladeshi, Chinese or Any other Asian background. |
| Birmingham 2022 Commonwealth Games | The Commonwealth Games is an international multi-sport event involving athletes from 72 nations and territories across the Commonwealth of Nations. The 2022 Commonwealth Games is being held in Birmingham. |
| Black ethnic group | Respondents who described their ethnic group or background as African, Caribbean or Any other Black / African / Caribbean background. |
| Confidence interval | A confidence interval provides a range in which there is a specific probability that the true value for the population will fall. For the Taking Part survey, 95% confidence intervals are used which means, had the sampling been conducted 100 times, creating 100 confidence intervals, then 95 of these intervals would contain the true value for adults in England. |
| Coventry City of Culture | UK City of Culture is a competition run by the Department of Digital, Culture, Media and Sport (DCMS) every four years. The current UK City of Culture started in May 2021 in Coventry and ends in May 2022. |
| Data | Information about people, things and systems. Information about people could include things like their names and addresses or it could be about the population, like the proportion of adults who own a property. Information about systems includes how companies perform, like hospital waiting times or company sales figures. Information about things might include the stock of food at a supermarket or the number of ventilators at a hospital. |
| DCMS Sectors | The DCMS sectors referred to in this report are the arts, heritage, museums and galleries, libraries, digital, tourism, internet and 5G, major events and live sport. |
| Digital engagement/participation | Digital engagement in each sector is defined as visiting a website or using an app related to that sector. |
| Disability | The harmonised question “Do you have any physical or mental health conditions or illnesses lasting or expected to last for 12 months or more?” is asked to identify those respondents with a long lasting health conditions and illness and those without. |
| Engagement | This refers to either attending and/or participating in one of DCMS’ sectors, either in person or online, for example, going to the theatre (attendance) or playing a musical instrument (participation). |
| Gambling | The Participation Survey captures information on respondents placing bets during sporting events. |
| Gender | The Participation Survey respondents were asked if they would describe themselves as Male, Female, Prefer to self-describe or Prefer not to say, following the harmonised question for gender. The categories for Male and Female are only provided due to the sample size being too small for other categories. |
| Heritage | A list of activities that are classified as engagement with heritage is given in Annex C. |
| Her Majesty the Queen’s Platinum Jubilee | A series of celebrations that will take place throughout 2022 to celebrate Her Majesty The Queen’s 70 year reign as Sovereign. |
| Index of Multiple Deprivation (IMD) | IMD is a geographical measure which classifies the relative deprivation of an area. It combines 7 indices to produce one overall measure for the area (rather than the individual). It takes into account Income, Employment, Education, Skills and Training, Health and Disability, Crime, Barriers to Housing and Services and Living Environment. |
| Live sports | Watching sport as it is being played |
| Mixed / Multiple ethnic groups | Respondents who described their ethnic group or background as White and Black Caribbean, White and Black African, White and Asian or Any other Mixed / Multiple ethnic background. |
| Other ethnic group | Respondents who described their ethnic group or background as Arab or Any other ethnic group. |
| Physical engagement | Engaging with DCMS sectors in person, ie not using digital means |
| Public library use | The list of activities that are classified as public library use is given in Annex C. |
| Router / internet hub | A router is a device that communicates between the internet and the devices in your home that connect to the internet |
| Significant increase/decrease | A significant increase/decrease at the 95% level means that if we carried out the same survey on different random samples of the population, 95 times out of 100 we would observe the increase/decrease. |
| Smart device | Smart products are devices or appliances controlled via an internet connection. |
| Socio-economic group | This is a form of socio-economic classification based on the employment status and occupation of the household reference person. The household reference person is the person responsible for owning or renting, or who is otherwise responsible for the accommodation. In the case of joint householders, the person with the highest income is the household reference person. In the case of joint incomes, the oldest person is taken as the household reference person. From this an individual is placed within one of the three socio-economic groups: 1. Managerial and professional occupations; 2. Intermediate occupations; 3. Routine and manual occupations |
| UNBOXED: Creativity in the UK | UNBOXED: Creativity in the UK is a celebration of creativity and innovation, taking place across England, Northern Ireland, Scotland, Wales and digitally from March to October 2022. |
| Wellbeing | Estimates of life satisfaction, feeling that the things done in life are worthwhile, happiness and anxiety. |
| White ethnic group | The White ethnic group includes adults who have identified as being in the following ethnic groups: English / Welsh / Scottish / Northern Irish / British, Irish, Gypsy or Irish Traveller, Any other White background |
| 5G | 5G (which stands for fifth generation) is the next step in mobile technology. It offers faster mobile internet speeds. |
Annex C - List of questions asked for each activity (culture)
Arts
The respondent was asked whether they had participated in a given list of arts activities, or attended a given list of arts events (not including paid work, school or college or structured academic activities). Eligible activities and events were as follows.
Physical Participation
- written stories, plays, or poetry
- read books or magazines
- written or performed music
- painting, drawing, printmaking, calligraphy
- crafts (textile, ceramic, sculpting, carving, woodwork)
- choreographed or performed a drama or dance routine
- designed or programmed video games including on a smartphone or tablet
- played video games including on a smartphone or tablet
- made films or videos as a hobby including original animations
- photography as a hobby
- other arts, crafts, or creative activities at home
Physical Attendance
- an exhibition of art, photography or sculptures
- a play, drama, musical, Pantomime, Ballet, Opera
- an event connected with books, reading, or writing
- a cinema screening of a film or movie
- a craft exhibition (not a crafts market; crafts include for example textiles, woodworking)
- a live music event
- a festival and or carnival (music, food, culture)
- a street art event
- a live dance event
- a fashion show
- a comedy event
- some other cultural event in England
Digital Engagement
- a live arts event including theatre, visual arts or literature
- a pre-recorded arts event including theatre, visual arts or literature
- a live music or dance event, watched as it was happening
- a pre-recorded music or dance event
Libraries
Physical engagement
The respondent was asked whether they had done any of the following things when they visited a public or mobile library (not including paid work, school or college or structured academic activities).
- borrowed, browsed or returned books, newspapers, music, CDs, DVDs or audiobooks
- accessed online resources such as e-books, magazines or journals
- used free Wi-Fi, computer or printing facilities
- sought information related to your or someone else’s health
- used the space to study or work
- took part in an event (for example a reading group, film screening or author visit)
- took a child to an event
- visited the library café or met up with someone
- did something else
Digital engagement:
The respondent was asked whether they had done any of the following things when accessing library services online (not including paid work, school or college or structured academic activities).
- reserved or renewed books or paid a fine
- searched online catalogues or dictionaries or made an enquiry
- borrowed digital or online resources such as e-books, e-audio or e-magazines but without visiting the library
- viewed or participated in an online event or activity organised by the library
- checked information online about the library such as opening hours, available facilities or services offered
- accessed online services via library membership such as journals or family history sites
- accessed some other library service online
Heritage
Physical engagement
The respondent was asked whether they had visited any of the following places in person (not including paid work, school or college or structured academic activities):
- a city or town with celebrated historic nature
- a historic building open to the public (non-religious)
- a historic place of worship attended as a visitor (not to worship)
- a park or garden open to the public with historic or artistic features
- a place connected with industrial history (such as an old factory, mine or railway)
- an ancient monument or archaeological site (such as a castle, fort, burial site)
- a site connected with sports heritage NOT visited for the purposes of watching sport (such as Wimbledon or Wembley stadium)
- a site connected with maritime or underwater heritage (such as shipwrecks)
- a historic landscape or habitat (such as coastline, countryside)
- some other heritage site or historic place
Digital engagement
The respondent was asked which of these virtual or online activities they had done (not including paid work, school or college or structured academic activities):
- taken a virtual tour of a museum or gallery in England
- taken a virtual walking tour of a historic town or city, heritage site, castle or monument in England (Not including drone flights)
- researched your local history online
- researched items from a museum or gallery collection in England online
- viewed documents from an archive in England online
- engaged with text, image, audio, video, or animation, games, or podcast content from heritage sites in England
- engaged with text, image, audio, video, or animation, games, or podcast content from museums in England
Museum or gallery
The respondent was asked if they had visited a museum or gallery in person in England in the last 12 months. There was not a specific online engagement question for a museum or gallery activity. Some questions about museum online engagement were included in the heritage online engagement question above.
Annex D - Questionnaire 2021/22
The questionnaire has been produced as a result of a series of engagements with key stakeholders and the social survey needs of DCMS sectors. We have worked closely with Kantar Public to devise a clear and effective questionnaire to acquire data for DCMS policy teams. There is some overlap with questions observed in the Taking Part Survey, however we advise not to compare findings from these two different surveys. For more information on the distinction between the Taking Part Survey and the Participation Survey please look in the methodology documents on the website.
-
Provisional quarterly figures are provided in this report. Additional quality assurance will be carried out when we receive the annual dataset. As a result, it is possible that some minor changes may be made to the previous year’s quarterly results. We would expect these to be minimal. ↩
-
The annual report, due to be published in July, will cover the whole questionnaire. Estimates are not provided in the quarterly report for the non-core questions due to smaller sample size and hence less robust data. ↩
-
The 95% confidence intervals are indicated by error bars on the charts. They show the range that we are 95% confident the true value for the population falls between. When there is no overlap between the error bars for two or more groups, we can be more confident that the differences between groups represent true differences between these groups in the population. ↩ ↩2 ↩3 ↩4 ↩5 ↩6
-
Respondents are asked their gender. The categories for Male and Female are only provided here due to the sample size for other categories (Prefer to self-describe and Prefer not to say). ↩ ↩2 ↩3 ↩4 ↩5 ↩6 ↩7 ↩8 ↩9 ↩10 ↩11 ↩12
-
Religions other than Christianity (and other than reporting “No Religion”) have been grouped together to form an “Other Religion” category in the data tables, due to sample size. This is commonly reported in the report as “adults who identify with a religion other than Christianity”. ↩ ↩2 ↩3 ↩4 ↩5 ↩6 ↩7 ↩8 ↩9 ↩10 ↩11
-
This category covers respondents who stated they had visited a library (physical), engaged online (digital), or used libraries in some other way. ↩
-
Correction 19/5/2022 – The phrase “Respondents from the North West (10%) were less likely to engage with the physical library services than respondents from other regions (12-18%).” was incorrectly included. This has now been removed. ↩