Non-domestic rating: Reval 2023 compiled list statistical commentary and background information
Updated 18 May 2023

© Crown copyright 2023
This publication is licensed under the terms of the Open Government Licence v3.0 except where otherwise stated. To view this licence, visit nationalarchives.gov.uk/doc/open-government-licence/version/3 or write to the Information Policy Team, The National Archives, Kew, London TW9 4DU, or email: psi@nationalarchives.gov.uk.
Where we have identified any third party copyright information you will need to obtain permission from the copyright holders concerned.
This publication is available at https://www.gov.uk/government/statistics/non-domestic-rating-change-in-rateable-value-of-rating-lists-england-and-wales-2023-revaluation-compiled-list/non-domestic-rating-reval-2023-compiled-list-statistical-commentary-and-background-information
About this release
This statistical release shows the change in the rateable value of non-domestic properties as a result of the 2023 revaluation, to reflect changes in the property market since the previous revaluation in 2017. Rateable value determined by the Valuation Office Agency (VOA) provides the basis for national non-domestic (business) rates bills.
This release compares changes between the 2017 rating lists and 2023 compiled rating lists by sector and geography as well as the distribution of rateable value of properties. The final stock of properties figures for the 2017 rating list will be published in May 2023.
The statistics presented in this release are consistent with the compiled list published on 1 April 2023, the data for which were generated on 25 March 2023. This provides an update on the draft list published on 17 November 2022. The VOA publishes the draft list in advance of the date the new rating lists take effect to allow ratepayers to check the details the VOA holds about their property are correct before business rates bills are issued. In the period from draft list publication and the final compiled list going live, changes have been made to the compiled list as part of “dual list maintenance” largely reflecting changes to the previous 2017 list, as reported in the quarterly NDR Challenges and Changes official statistics.
Maps which show the change in rateable value between the 2017 and 2023 local rating lists across regions have been added to the statistical commentary for this release. More detailed maps which show changes across billing authorities within each English region and Wales have also been published as part of this release.
Responsible Statistician
Anna McReady
Statistical enquiries
1. Headline figures
The 2023 revaluation has shown an increase in the total rateable value for England and Wales.
1.1. Local list
There were 2.15 million properties on the 2023 compiled list in England and Wales at 1 April 2023.
The total rateable value of these properties was £70.4 billion compared with £65.7 billion on the 2017 rating list.
-
total rateable value on the local lists for England and Wales increased by 7.2%, up from 7.1% reported for the draft list
-
total rateable value for England increased by 7.4%, up from 7.3% reported for the draft list
-
total rateable value for Wales increased by 1.6%, up from 1.3% reported for the draft list
In addition:
-
rateable value in the East region saw the largest increase of any region in England, with an increase of 14.8%
-
rateable value in the North East region saw the smallest increase of any region in England, with an increase of 2.6%
-
the retail sector was the only sector where rateable value decreased across England and Wales at revaluation, with a decrease of 10.0%
-
the industry sector saw the largest increase of any sector across England and Wales, with an increase of 27.2%
1.2. Central list
The central rating list contains the rating assessments of the network property of major transport, utility and telecommunications undertakings and cross-country pipelines.
The total rateable value on the 2023 compiled central rating list as at 1 April 2023 was £4.0 billion. This breaks down into £3.8 billion for England and £0.2 billion for Wales.
-
rateable value across England and Wales has decreased by 0.6% between the 2017 and 2023 central rating lists
-
rateable value for England decreased by 0.7%
-
rateable value for Wales increased by 1.0%
This statistical release aims to compare rateable values of properties which were valued on both the 2017 and 2023 rating lists. Some properties have moved from the local rating lists to the central lists between revaluations.
To calculate the change in rateable value within the central list, VOA statisticians have worked with operational staff to identify the 2017 local rating assessments of properties which have moved to the 2023 central rating list at revaluation. The rateable value of these properties has been added to the total rateable value on the 2017 central list to provide a comparison for the new 2023 central list.
This means the total rateable value on the 2017 central list reported in this publication will not match the statistics reported on the 2017 non-domestic rating list in the NDR stock of properties release which will be published in May 2023.
The properties which have moved from the local rating lists have a total rateable value on the 2023 central rating list of approximately £303 million.
The remainder of this statistical commentary refers to the local rating list.
2. Contribution of each sector to the total change in rateable value in England and Wales
Figure 1: Percentage change that each sector contributes to the total percentage change in rateable value across all sectors from the 2017 to the 2023 rating list, England and Wales
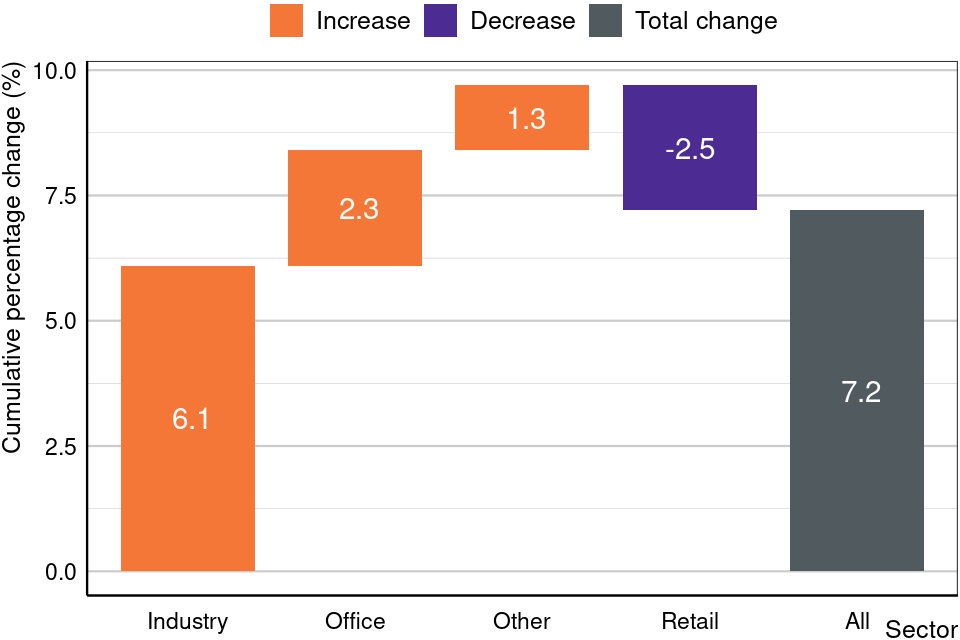
Source: NDR Revaluation 2023 compiled list (Tables 2.0-2.4)
Figure 1 shows the contribution that each sector has made towards the total change in rateable value of 7.2% across England and Wales. The graph shows the percentage increase or decrease each individual sector has made to total rateable value from the 2017 list to the 2023 compiled list. This graph does not show the total percentage change to rateable value within each sector, which is provided in Figure 4. Each sector is made up of a similar number of rateable properties, ranging from 435,820 in the office sector to 636,490 in the ‘other’ sector. Despite this, the industry sector makes the greatest contribution to the overall change in rateable value.
3. Total rateable value by sector
This section compares the total rateable value on the 2017 local rating list and the compiled 2023 local rating list for each sector in England and Wales.
Figure 2: Total rateable value on the 2017 and 2023 rating lists by sector, England
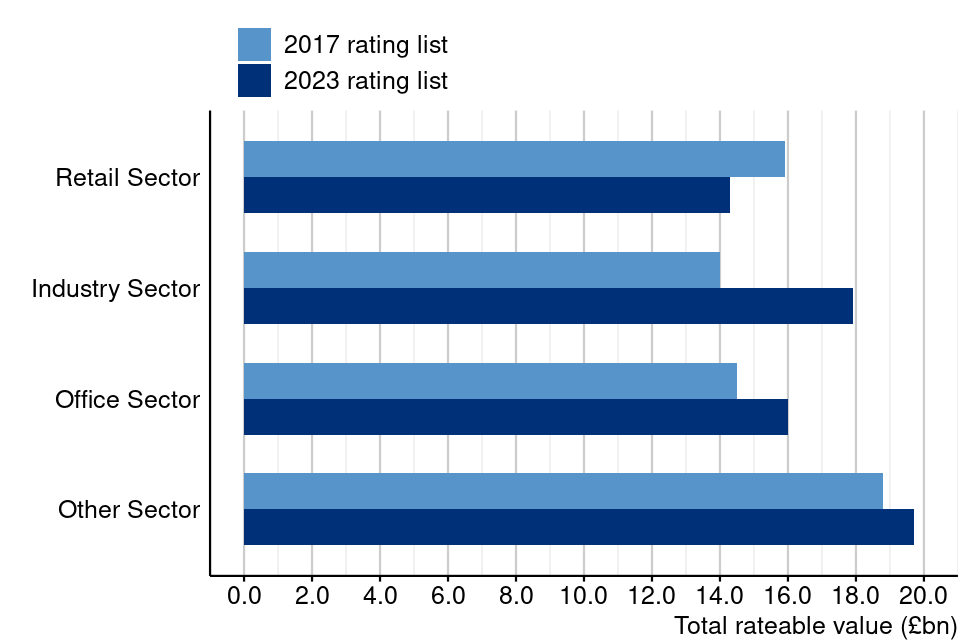
Source: NDR Revaluation 2023 compiled list (Table 4.1)
Figure 2 shows the total rateable value (£billions) in England on the 2017 local rating list and the 2023 compiled list for each sector.
Figure 3: Total rateable value on the 2017 and 2023 rating lists by sector, Wales
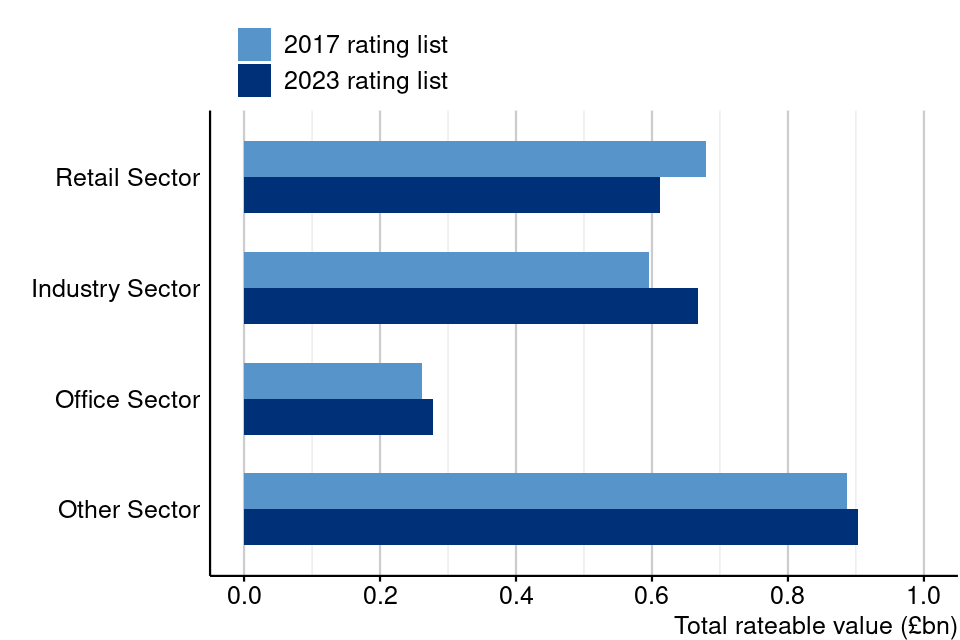
Source: NDR Revaluation 2023 compiled list (Table 4.2)
Figure 3 shows the total rateable value (£billions) in Wales on the 2017 local rating list and the 2023 compiled list for each sector.
4. Percentage change in rateable value by sector
Figure 4: Percentage change in rateable value between 2017 and 2023 rating lists by sector, England and Wales
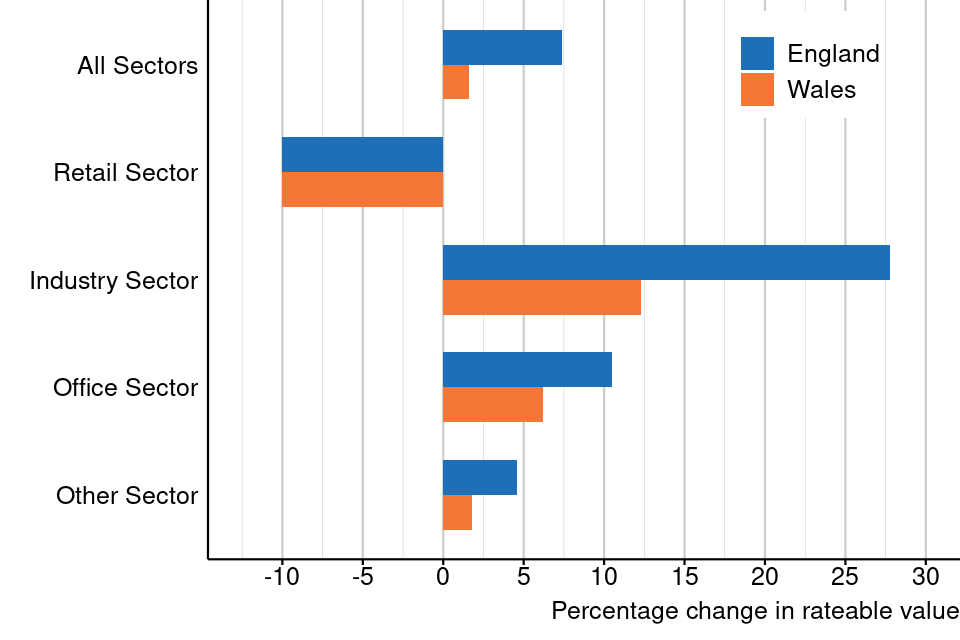
Source: NDR Revaluation 2023 compiled list (Table 1.0)
Figure 4 shows the percentage change in rateable value between the 2017 rating list and the compiled 2023 rating list for each sector as well as for all sectors in England and Wales.
5. Contribution of each region and nation to the total change in rateable value in England and Wales
Figure 5: Percentage change that each region and nation contributes to the total percentage change in rateable value from the 2017 list to the 2023 rating list, England and Wales, all sectors
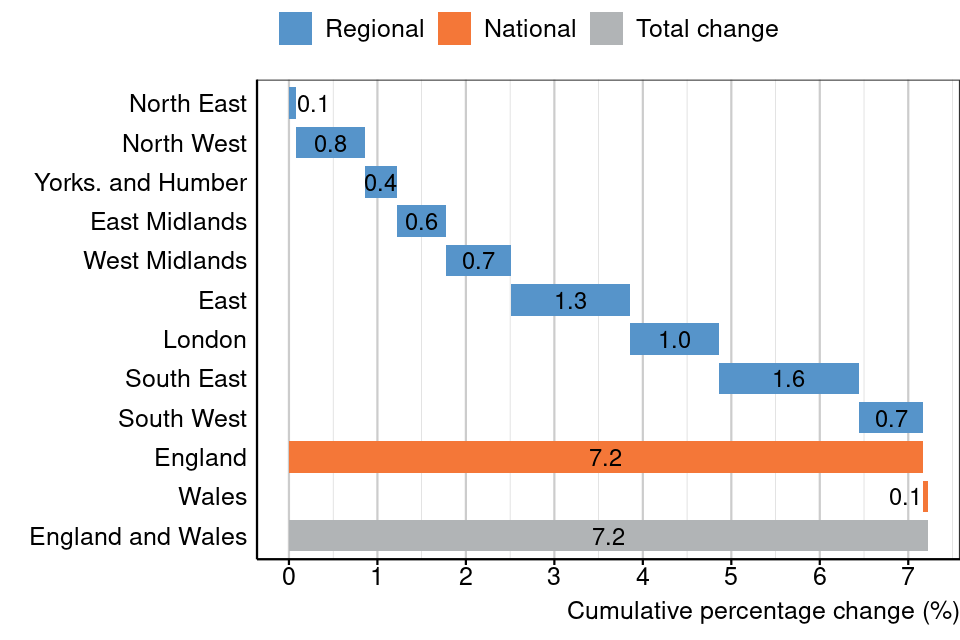
Source: NDR Revaluation 2023 compiled list (Table 2.0)
Figure 5 shows the contribution that each region has made towards the total change in rateable value of 7.2% across England and Wales. The graph shows the percentage increase or decrease each individual region has made to total rateable value from the 2017 list to the 2023 compiled list. This graph does not show the total percentage change to rateable value within each region, which is provided in Figure 7.
6. Total rateable value by region
This section compares the total rateable value on the 2017 local rating list and the compiled 2023 local rating list for each region in England and Wales.
Figure 6: Total rateable value on the 2017 and 2023 rating lists for English regions and Wales, all sectors
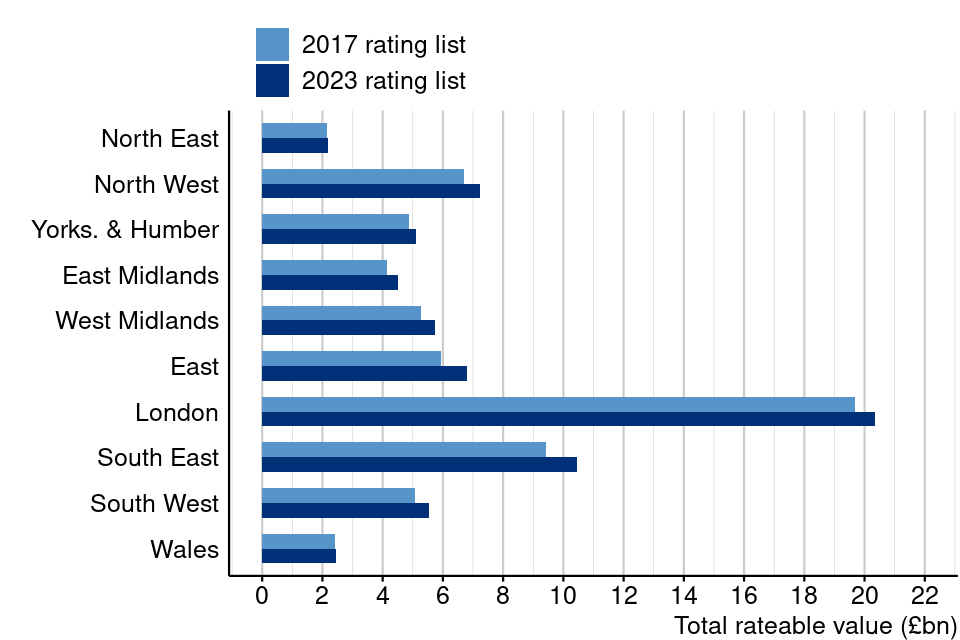
Source: NDR Revaluation 2023 compiled list (Table 2.0)
Figure 6 shows the total rateable value (£billions) from the 2017 local rating list to the 2023 compiled local rating list for each region in England and Wales.
7. Percentage change in rateable value by region
The percentage change in rateable value also varies by region.
Figure 7: Percentage change in rateable value between 2017 and 2023 rating lists by region and nation, England and Wales, all sectors
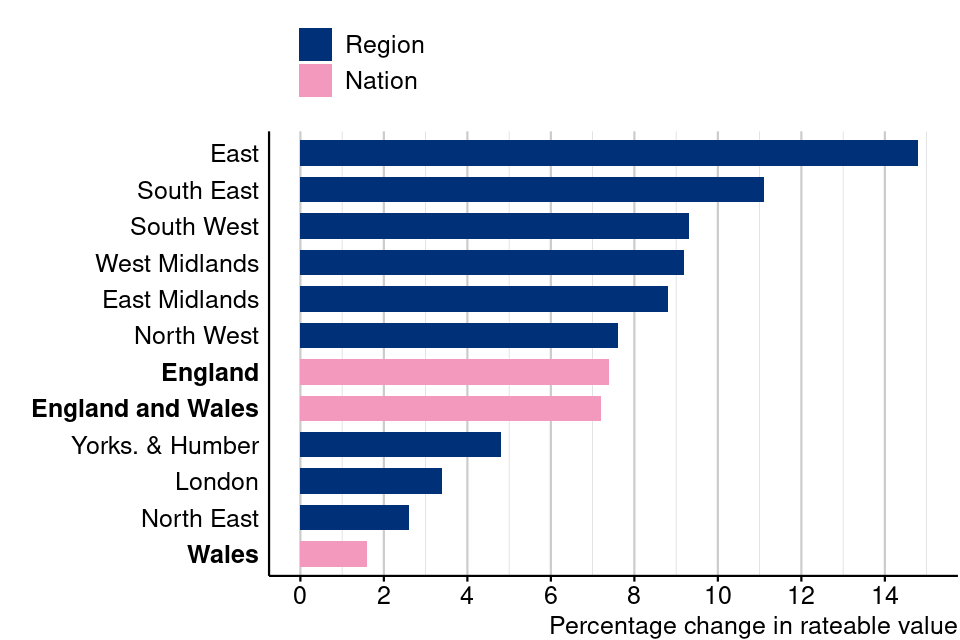
Source: NDR Revaluation 2023 compiled list (Table 1.0)
Figure 7 shows the percentage change in rateable value between the 2017 rating list and the compiled 2023 rating list for each region in England and Wales.
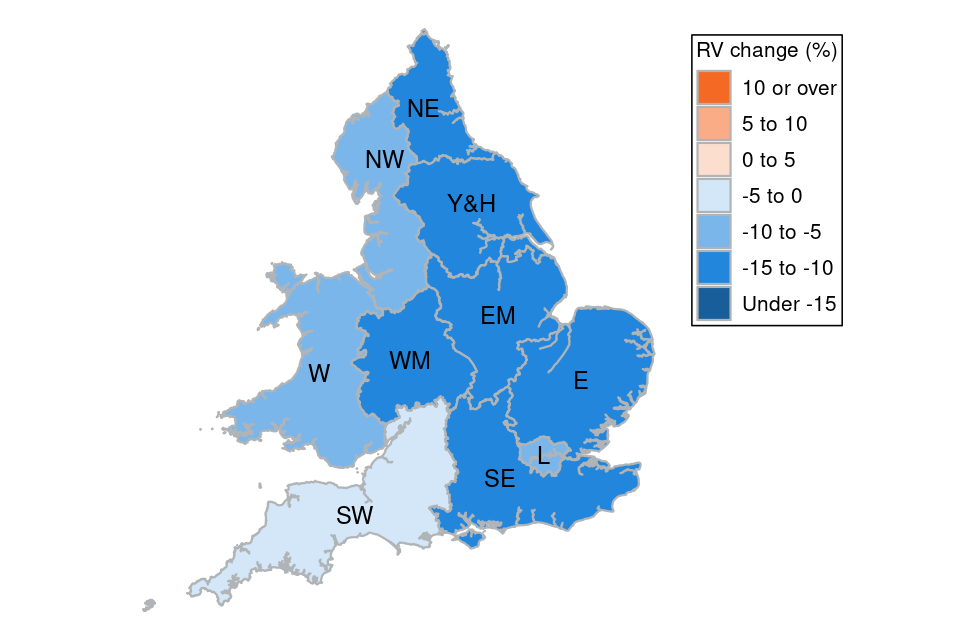
Figure 8: Map showing percentage change in rateable value (RV) between 2017 and 2023 rating lists for English regions and Wales, all sectors
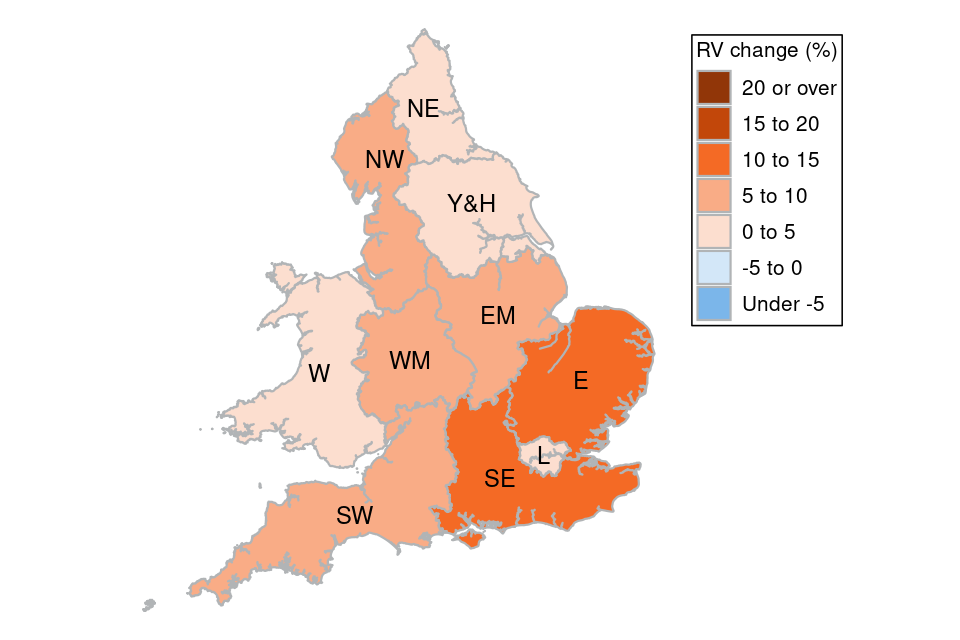
Source: NDR Revaluation 2023 compiled list (Table 1.0)
Figure 8 is a choropleth map which shows the regional differences in percentage change in rateable value in all sectors at revaluation. More detailed maps which show changes across billing authorities within each English region and Wales have also been published as part of this release.
8. Change by rateable value interval
This section breaks down how rateable properties and rateable value are distributed across different rateable value intervals.
Figure 9: Distribution of properties across rateable value intervals on the 2017 and 2023 rating lists, England and Wales, all sectors
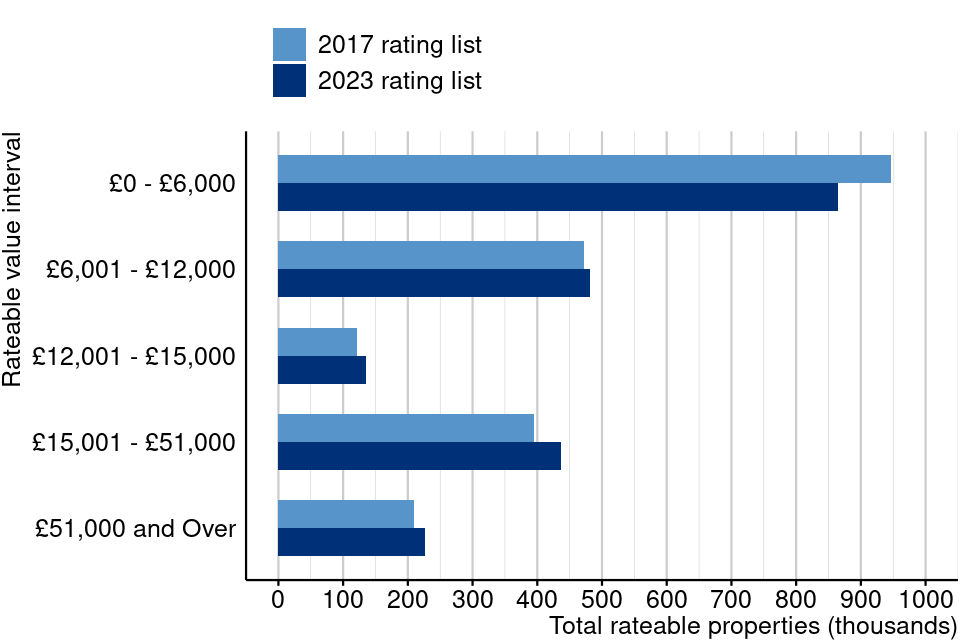
Source: NDR Revaluation 2023 compiled list (Table 3.0)
Figure 9 shows the number of properties in each rateable value interval for the 2017 rating list compared with the compiled 2023 rating list for England and Wales. This shows that the distribution of rateable value is highly skewed, where over 40% of properties have a rateable value in the £0 to £6,000 range, and over 60% of properties have a rateable value of £12,000 or less. While the number of properties in the £0 to £6,000 interval have decreased between the 2017 rating list and the compiled 2023 rating list, the number of properties in every other band has increased.
Figure 10.1: Rateable property distribution on the 2023 rating list by rateable value interval, England, all sectors
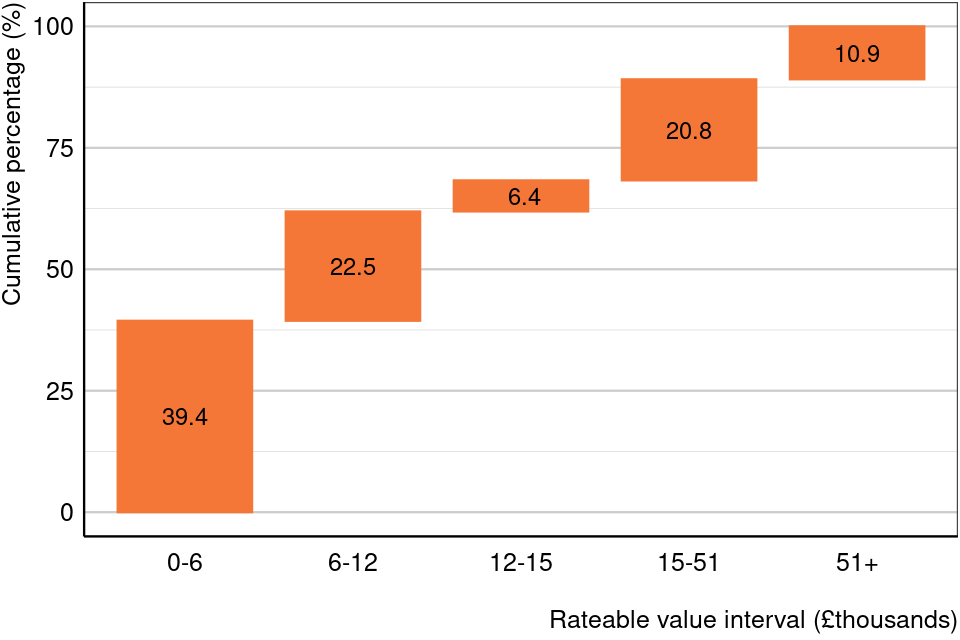
Source: NDR Revaluation 2023 compiled list (Table 3.0)
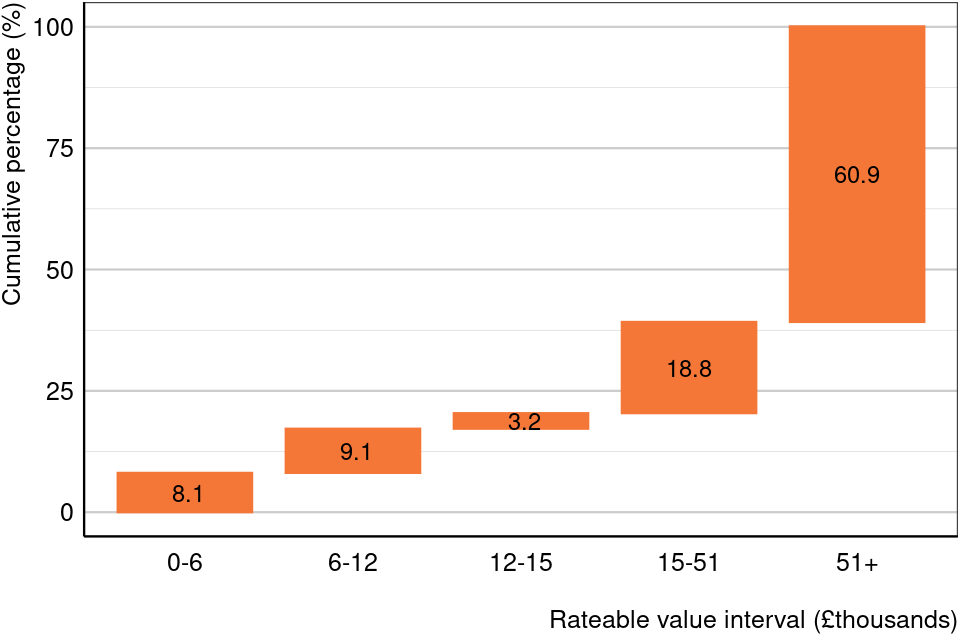
Figure 10.2: Rateable value distribution on the 2023 rating list by rateable value interval, England, all sectors
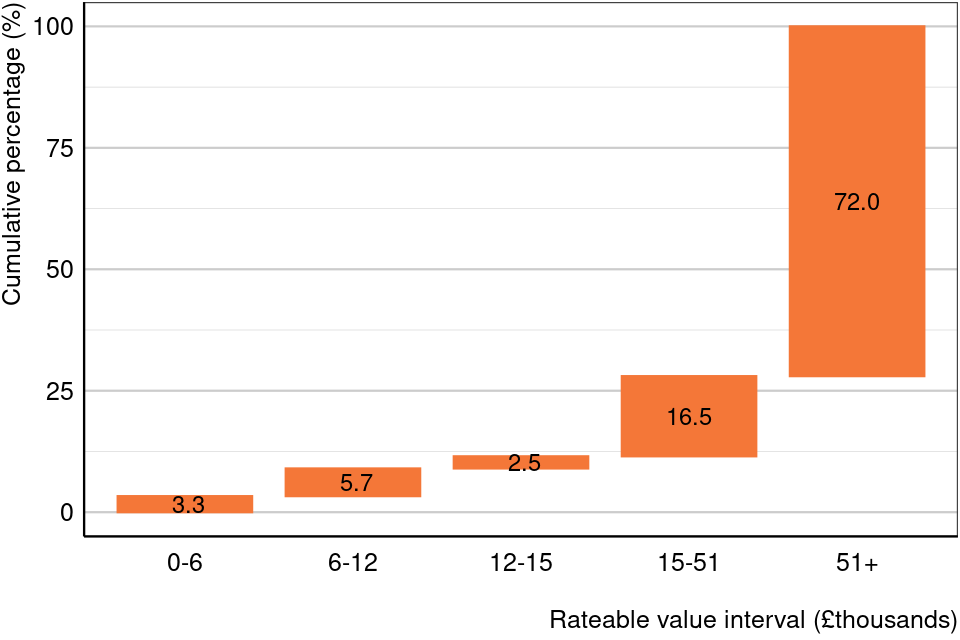
Source: NDR Revaluation 2023 compiled list (Table 3.0)
Figure 10.1 shows the distribution of rateable properties and Figure 10.2 shows the distribution of rateable value across different rateable value intervals in England on the compiled 2023 rating list. Together, these figures show that most rateable properties are in the lower rateable value intervals, but the majority of total rateable value comes from the smaller number of properties in the highest rateable value interval (£51,000 and over).
Figure 11.1: Rateable property distribution on the 2023 rating list by rateable value interval, Wales, all sectors
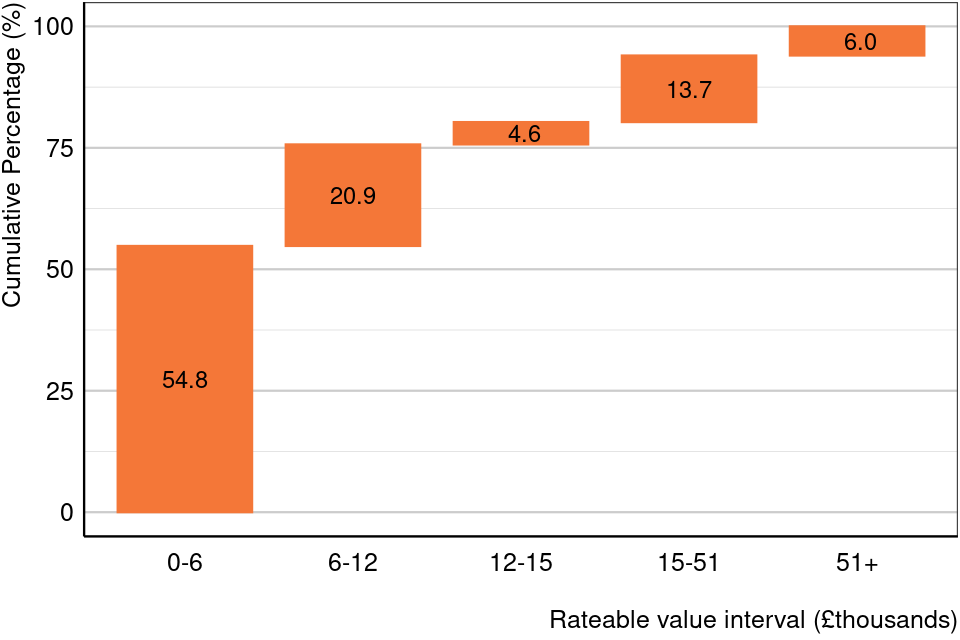
Source: NDR Revaluation 2023 compiled list (Table 3.0)
Figure 11.2: Rateable value distribution on the 2023 rating list by rateable value interval, Wales, all sectors
Source: NDR Revaluation 2023 compiled list (Table 3.0)
Figure 11.1 shows the distribution of rateable properties and Figure 11.2 shows the distribution of rateable value across different rateable value intervals in Wales on the compiled 2023 rating list. Similar to the England figures, these figures show that while most rateable properties are in the lower rateable value intervals, the majority of total rateable value comes from the smaller number of properties in the highest rateable value interval (£51,000 and over).
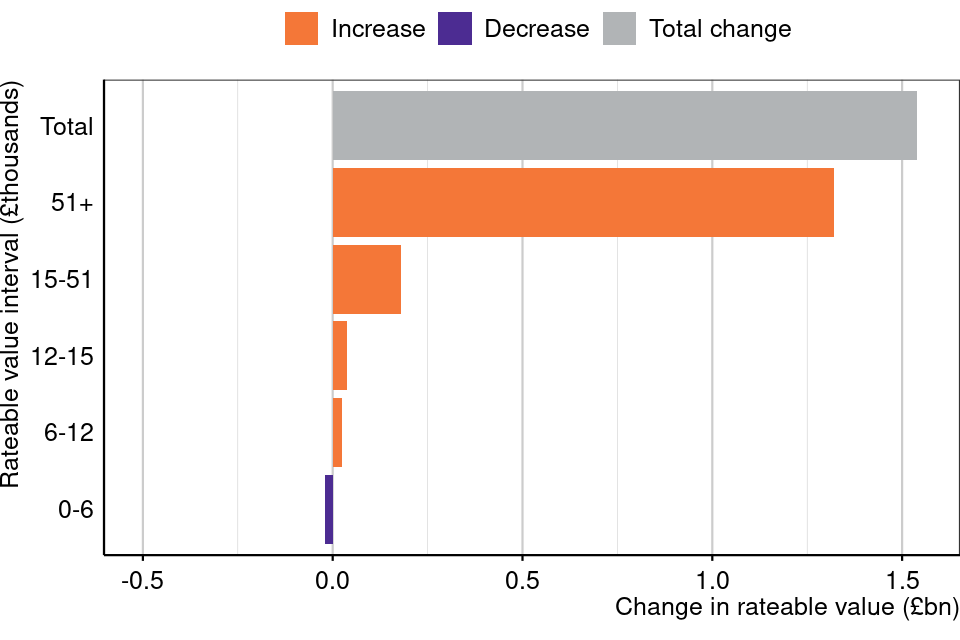
Figure 12: Change in rateable value (£billions) between 2017 and 2023 rating lists by rateable value interval, England and Wales, all sectors
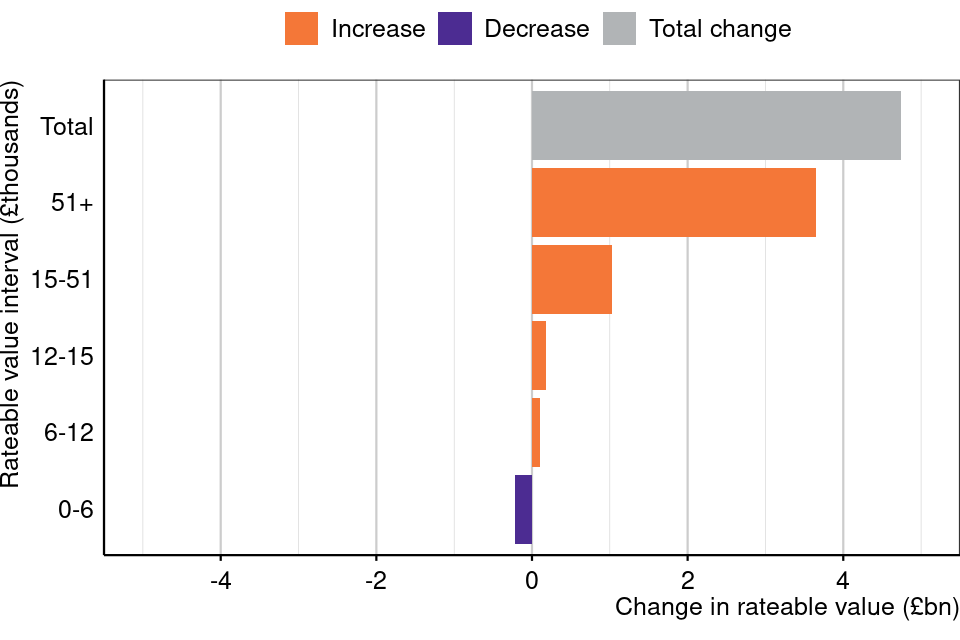
Source: NDR Revaluation 2023 compiled list (Table 3.0)
Figure 12 shows the change in total rateable value (£billions) for each rateable value interval for all sectors in England and Wales.
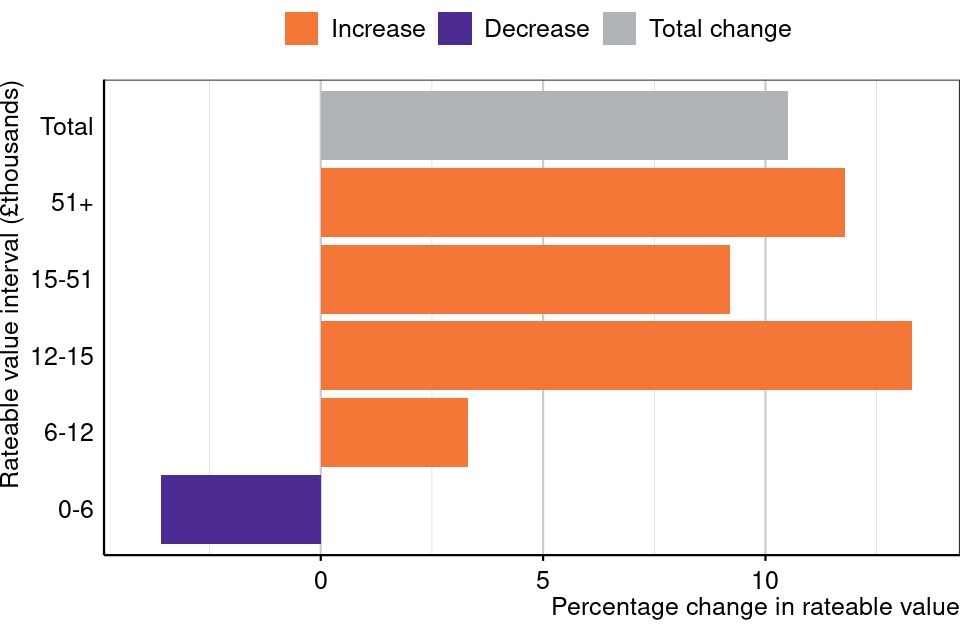
Figure 13: Percentage change in rateable value between 2017 and 2023 rating lists by rateable value interval, England and Wales, all sectors
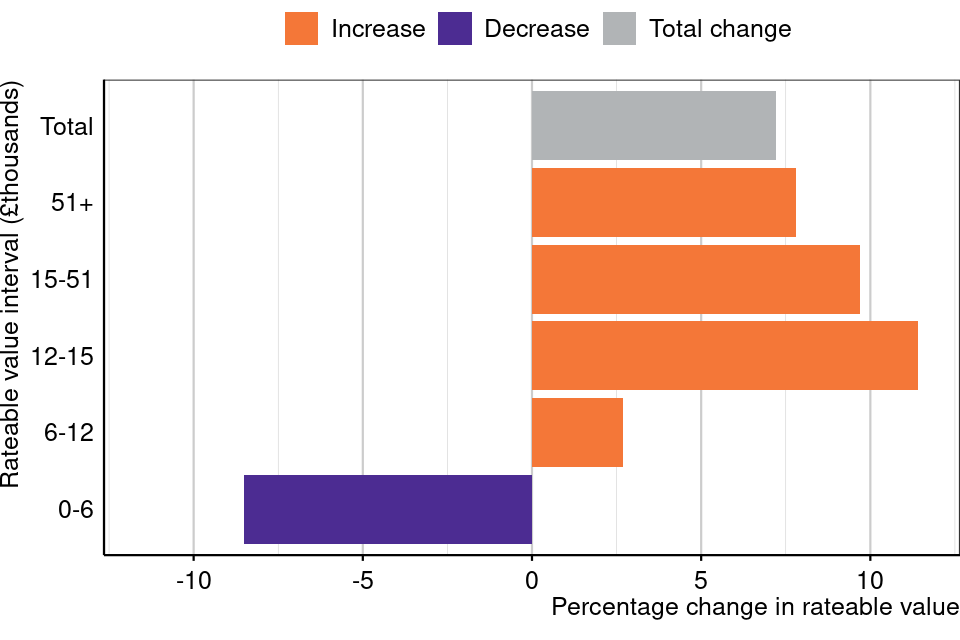
Source: NDR Revaluation 2023 compiled list (Table 3.0)
Figure 13 shows the percentage change in total rateable value for each rateable value interval for all sectors in England and Wales.
9. Change within the retail sector
This section presents statistics on the change in rateable value at revaluation within the retail sector. Each sector has Special Category (SCat) codes assigned to it, which are operational codes used by the VOA to classify a property’s use. Change in rateable value within the retail sector is broken down by region (Figure 14), SCat code (Figure 15), and by intervals of rateable value (Figure 16).
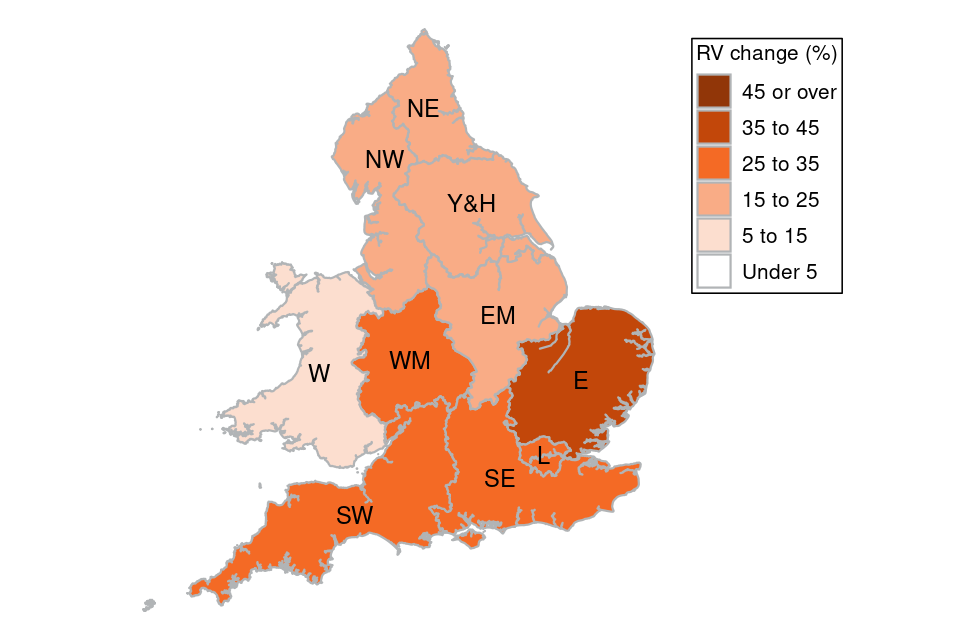
Figure 14: Map showing percentage change in rateable value (RV) between 2017 and 2023 rating lists for English regions and Wales, retail sector
Source: NDR Revaluation 2023 compiled list (Table 1.0)
Figure 14 is a choropleth map which shows the regional differences in percentage change in rateable value in the retail sector at revaluation. More detailed maps which show changes across billing authorities within each English region and Wales have also been published as part of this release.
Figure 15: Total rateable value for 2017 and 2023 rating lists by Special Category (SCat) code description, England and Wales, retail sector
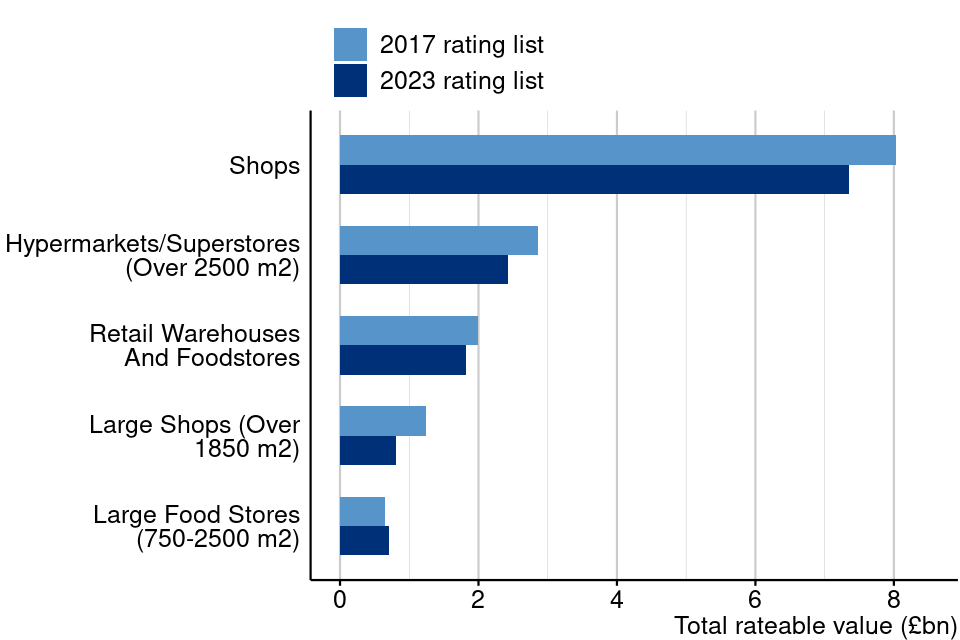
Source: NDR Revaluation 2023 compiled list (Table 4.0)
Figure 15 compares total rateable value on the 2017 rating list and the compiled 2023 rating list for the five Special Category (SCat) codes with the greatest total rateable value within the retail sector. These highest value SCat codes have all decreased in rateable value, except for large food stores.
Figure 16: Change in rateable value (£billions) between 2017 and 2023 rating lists by rateable value interval, England and Wales, retail sector
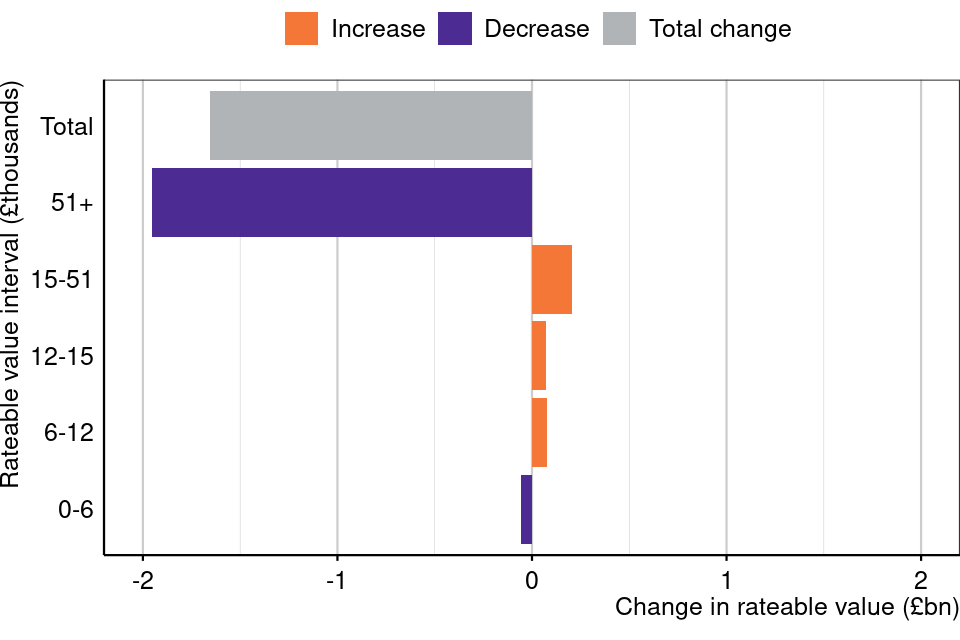
Source: NDR Revaluation 2023 compiled list (Table 3.1)
Figure 16 shows the change in total rateable value (£billions) for each rateable value interval for the retail sector in England and Wales.
Figure 17: Percentage change in rateable value between 2017 and 2023 rating lists by rateable value interval, England and Wales, retail sector
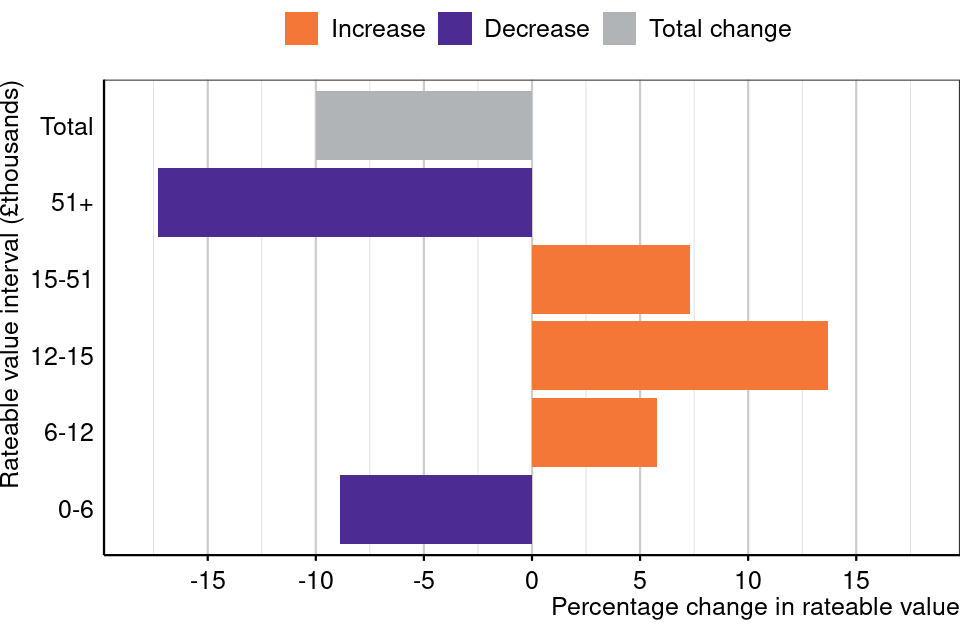
Source: NDR Revaluation 2023 compiled list (Table 3.1)
Figure 17 shows the percentage change in total rateable value for each rateable value interval for the retail sector in England and Wales.
10. Change within the industry sector
This section presents statistics on the change in rateable value at revaluation within the industry sector. Change in rateable value within the industry sector is broken down by region (Figure 18), SCat code (Figure 19), and by intervals of rateable value (Figure 20).
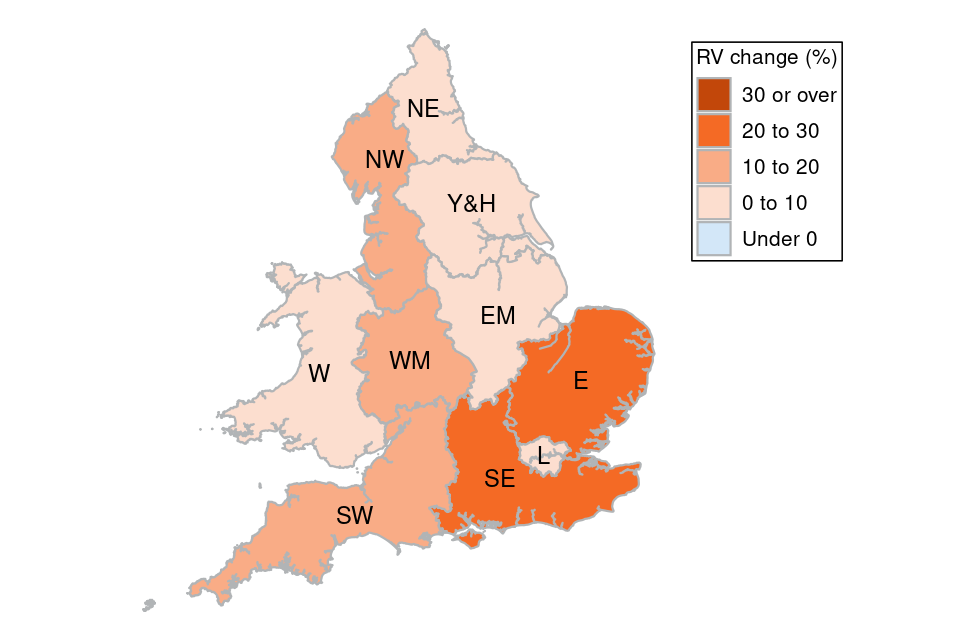
Figure 18: Map showing percentage change in rateable value (RV) between 2017 and 2023 rating lists for English regions and Wales, industry sector
Source: NDR Revaluation 2023 compiled list (Table 1.0)
Figure 18 is a choropleth map which shows the regional differences in percentage change in rateable value in the industry sector at revaluation. More detailed maps which show changes across billing authorities within each English region and Wales have also been published as part of this release.
Figure 19: Total rateable value for 2017 and 2023 rating lists by Special Category (SCat) code description, England and Wales, industry sector
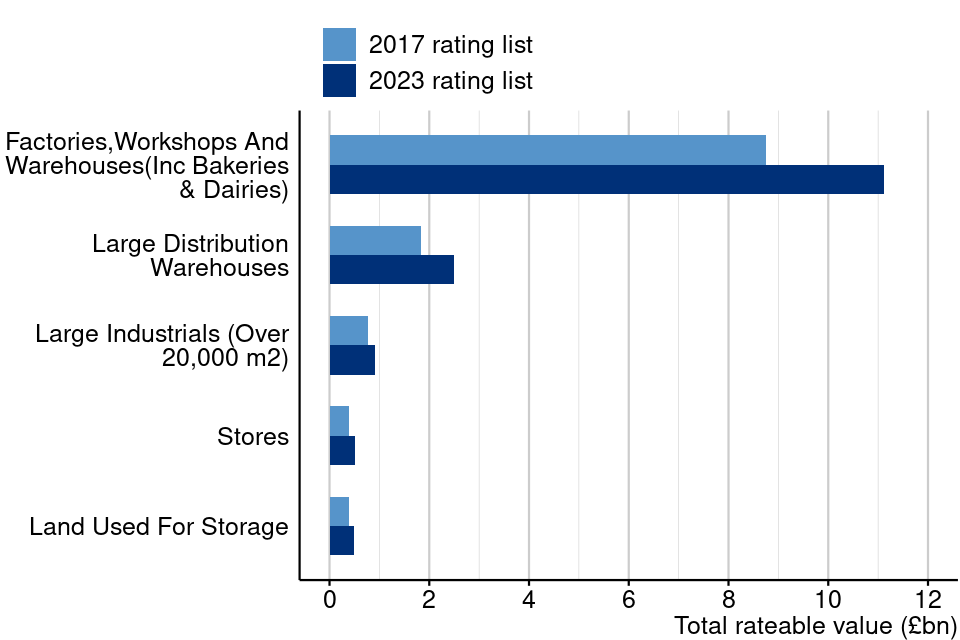
Source: NDR Revaluation 2023 compiled list (Table 4.0)
Figure 19 compares total rateable value on the 2017 rating list and the compiled 2023 rating list for the five Special Category (SCat) codes with the greatest total rateable value within the industry sector.
Figure 20: Change in rateable value (£billions) between 2017 and 2023 rating lists by rateable value interval, England and Wales, industry sector
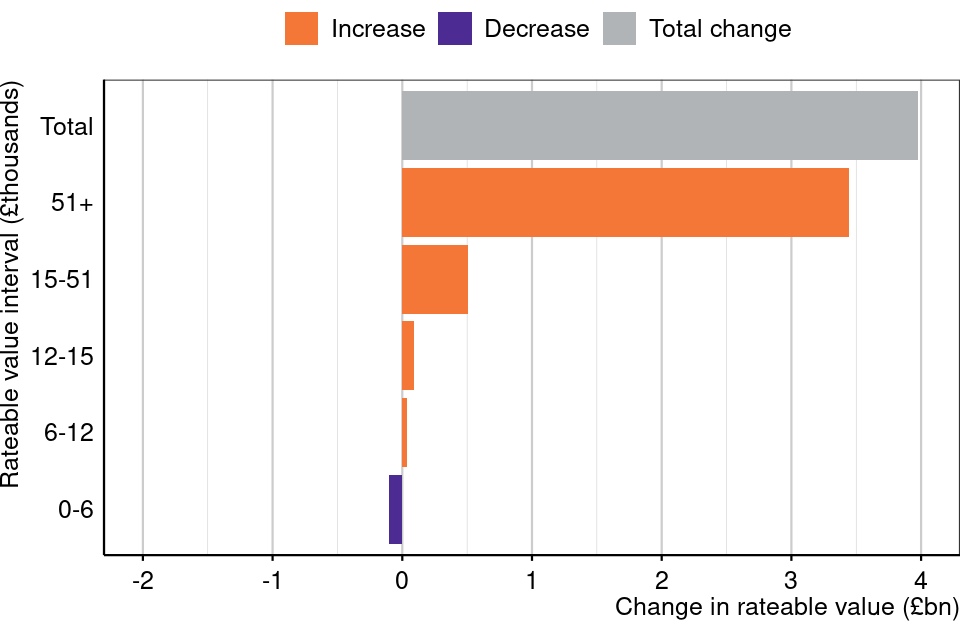
Source: NDR Revaluation 2023 compiled list (Table 3.2)
Figure 20 shows the change in total rateable value (£billions) for each rateable value interval for the industry sector in England and Wales.
Figure 21: Percentage change in rateable value between 2017 and 2023 rating lists by rateable value interval, England and Wales, industry sector
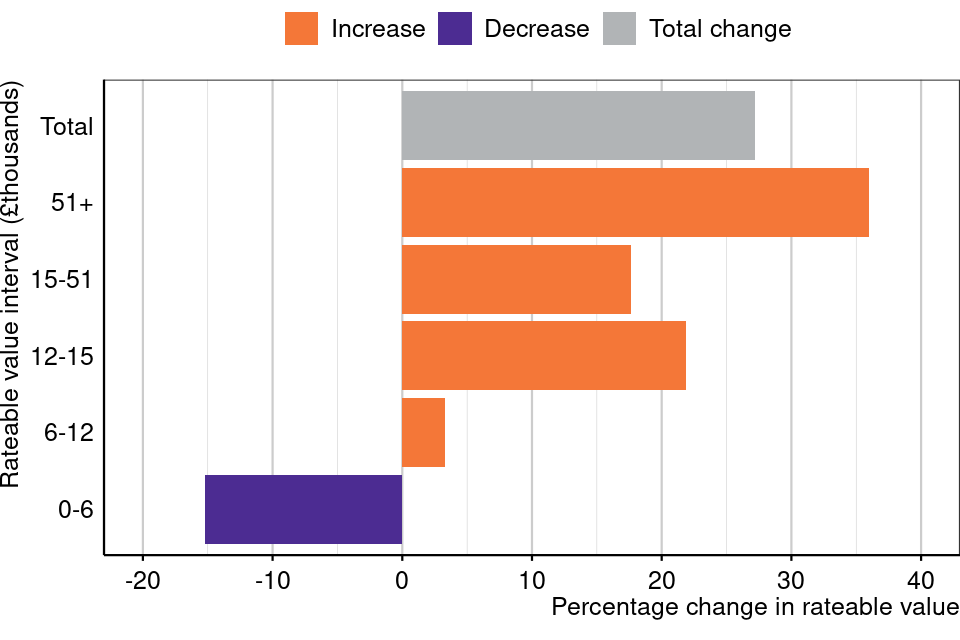
Source: NDR Revaluation 2023 compiled list (Table 3.2)
Figure 21 shows the percentage change in total rateable value for each rateable value interval for the industry sector in England and Wales.
11. Change within the office sector
This section presents statistics on the change in rateable value at revaluation within the office sector. Change in rateable value within the office sector is broken down by region (Figure 22), SCat code (Figure 23), and by intervals of rateable value (Figure 24).
Figure 22: Map showing percentage change in rateable value (RV) between 2017 and 2023 rating lists for English regions and Wales, office sector
Source: NDR Revaluation 2023 compiled list (Table 1.0)
Figure 22 is a choropleth map which shows the regional differences in percentage change in rateable value in the office sector at revaluation. More detailed maps which show changes across billing authorities within each English region and Wales have also been published as part of this release.
There are only two Special Category (SCat) codes within the office sector: offices (including computer centres) and offices headquarters/institutional. Offices (including computer centres) make up the vast majority of both properties and rateable value in the office sector. There are no notable differences between the percentage increase in rateable value for the two SCat codes so this is not shown graphically.
This section breaks down the office sector by intervals of rateable value.
Figure 23: Change in rateable value (£billions) between 2017 and 2023 rating lists by rateable value interval, England and Wales, office sector
Source: NDR Revaluation 2023 compiled list (Table 3.3)
Figure 23 shows the change in total rateable value (£billions) for each rateable value interval for the office sector in England and Wales.
Figure 24: Percentage change in rateable value between 2017 and 2023 rating lists by rateable value interval, England and Wales, office sector
Source: NDR Revaluation 2023 compiled list (Table 3.3)
Figure 24 shows the percentage change in total rateable value for each rateable value interval for the office sector in England and Wales.
12. Change within the other sector
The ‘other’ category was created to cover Special Category (SCat) codes which could not be readily assigned to ‘retail’, ‘office’ or ‘industry’. This includes hereditaments which fall under:
-
education
-
health
-
transport
-
leisure
-
accommodation
-
utilities
This sector also includes some SCat codes which are associated with retail, industry or offices, but do not directly fall into these sectors for valuation purposes and are therefore grouped into the ‘other’ categories.
These SCat codes are grouped in sub-sectors:
-
‘other – retail’
-
‘other – storage and distribution’ (an industry sub-sector)
-
‘other – offices’
There is also an ‘other – other’ sub-sector, which contains all remaining SCat codes that do not fit into a specific sector or sub-sector. For more information on these sub-sectors, please see Tables 4.0 to 4.2 of this release. This section breaks down the ‘other’ sector by sub-sector.
Figure 25: Total rateable value for 2017 and 2023 rating lists by sub-sector, England and Wales, ‘other’ sector
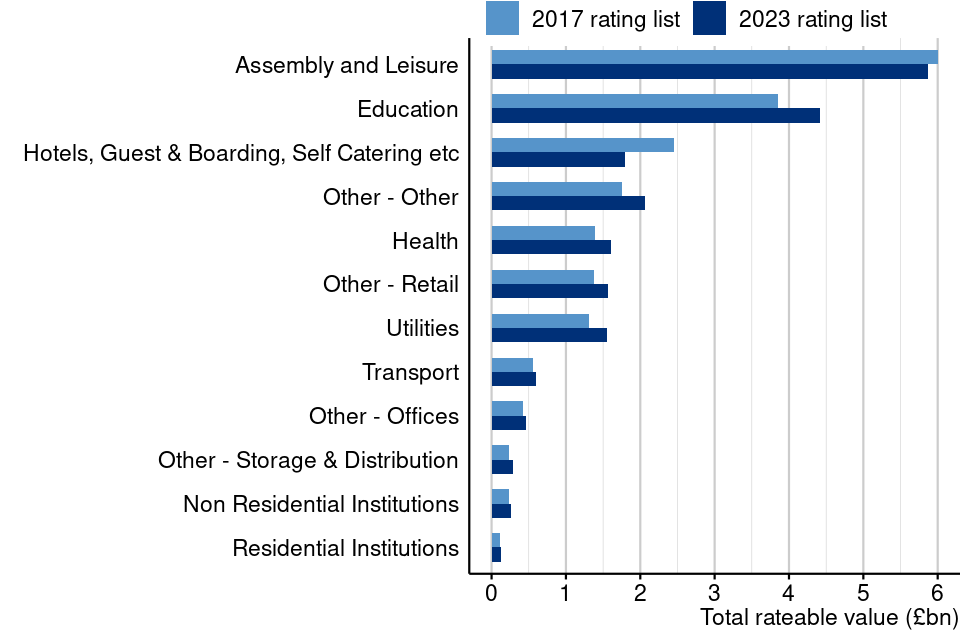
Source: NDR Revaluation 2023 compiled list (Table 4.0)
Figure 25 compares total rateable value on the 2017 rating list and the compiled 2023 rating list for each sub-sector in the ‘other’ sector. The assembly and leisure sub-sector is the largest in the ‘other’ sector in terms of rateable value. This sub-sector includes:
-
hospitality (such as pubs, cafes and restaurants)
-
sports and leisure facilities
-
museums
-
entertainment venues (such as cinemas and theatres).
Figure 26: Change in rateable value (£billions) between 2017 and 2023 rating lists by rateable value interval, England and Wales, ‘other’ sector

Source: NDR Revaluation 2023 compiled list (Table 3.4)
Figure 26 shows the change in total rateable value (£billions) for each rateable value interval for the ‘other’ sector in England and Wales.
Figure 27: Percentage change in rateable value between 2017 and 2023 rating lists by rateable value interval, England and Wales, ‘other’ sector
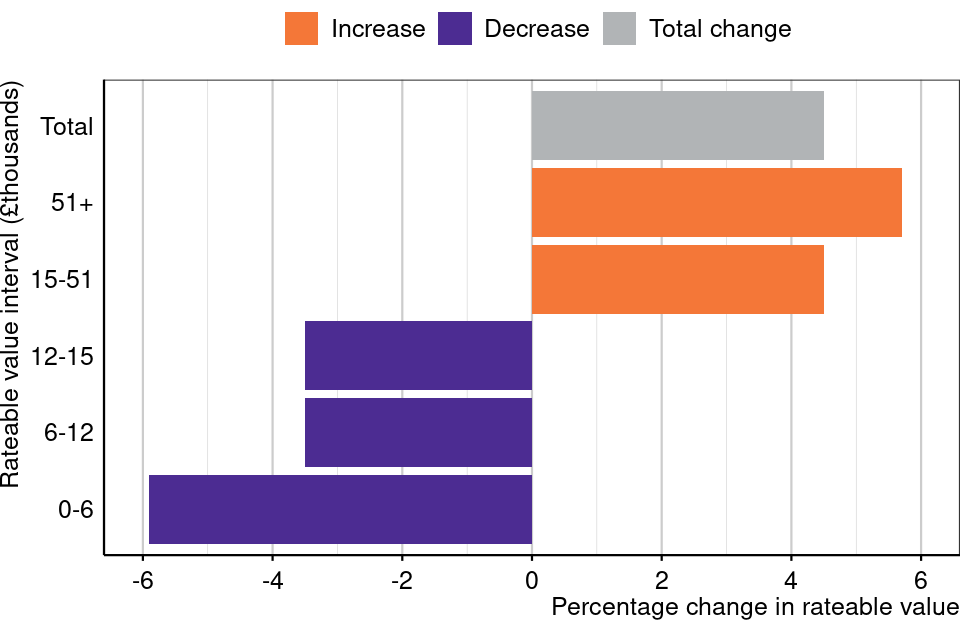
Source: NDR Revaluation 2023 compiled list (Table 3.4)
Figure 27 shows the percentage change in total rateable value for each rateable value interval for the ‘other’ sector in England and Wales.
13. Background on business rates and revaluation
Business rates are a tax on non-domestic property. If a property is used as a business or for purposes which are not domestic, it is likely to be rateable.
The Valuation Office Agency (VOA) is required, by the Local Government Finance Act 1988, to compile and maintain rating lists specifying a rateable value (RV) for each relevant non-domestic rateable property (also known as a hereditament) in England and Wales. These rateable values provide the basis for national non-domestic (business) rates bills, which are calculated and issued by local billing authorities.
The RV of a property is broadly based on the annual rent for which a rateable property could have been let on the open market at a set date. It is based on a range of factors including use, location, and age; a major determinant of rental value is the size of the property.
Non-domestic rateable properties fall into either a local rating list or a central rating list. There is a single local rating list for each billing authority in England and Wales, and there are two central rating lists, one each for England and for Wales.
The central rating lists contain the rating assessments for the network property of major transport, utility and telecommunications undertakings and cross-country pipelines. There is a single entry in one of the rating lists (either for England or Wales) for each company named in the Central Rating List Regulations 2005. There are separate regulations and lists for England and Wales.
Business rates on central rating list rateable properties are paid directly to the Department for Levelling up, Housing and Communities in England, and to the Welsh Government in Wales.
13.1 Revaluation
A revaluation is an update of the rateable values of all business, and other non-domestic property, in England and Wales at a particular point in time. Rateable values are used to calculate business rates bills.
Valuations are based on the open market rental value at a point in time, 1 April 2021, known as the Antecedent Valuation Date (AVD). They will be used by billing authorities, along with the respective multiplier in England and Wales and any reliefs a ratepayer qualifies for, to calculate and issue business rates bills from 1 April 2023.
The VOA is required to regularly undertake a revaluation to make sure that rateable values reflect changes in the property market. Rateable values reflect open market rental values at a fixed date – if market values have changed, then rateable values will change with them.
Revaluations are necessary because the relative value of properties changes over time. Rents will increase in some locations, and for some types of properties, over time, and they will fall or stay the same for others. Rateable values will reflect this.
14. Data information, methodology and quality
These statistics are released as part of the VOA’s commitment to make data more accessible, as well as continuing to improve and make more consistent the presentation of information to assist users conducting their own analysis of VOA data. The data are used to inform government policy and conduct analyses to support the operations of the VOA.
This release includes the following tables in excel and csv format:
- Percentage change in rateable value from 2017 to 2023 local rating list by region and sector (Table 1.0)
- Change in rateable value from 2017 to 2023 central rating list (Table 1.1)
- Change in rateable value from 2017 to 2023 local rating list by administrative area and sector (Tables 2.0 to 2.4)
- Distribution of rateable properties and value across rateable value interval by country and region and sector (Tables 3.0 to 3.4)
- Change in rateable value from 2017 to 2023 local rating list by Special Category (SCat) for England and Wales (Tables 4.0 to 4.2)
- Change in rateable value from 2017 to 2023 local rating list by property type for England and Wales (Tables 5.0 to 5.2)
- Revisions to the percentage change in rateable value between 2017 and 2023 local rating lists since draft list publication (Table 6.0)
A metadata lookup table is available on the release page in csv format.
The information supplied in the tables is based upon linking properties between the 2017 rating lists and compiled 2023 rating lists. The current assessment (rateable value) of a property according to the 2017 rating list is compared with the proposed assessment according to the compiled 2023 rating list.
This information is produced using administrative data held within the VOA’s operational database. All administrative data are subject to processing and process errors and as such, while the VOA has made every effort to ensure accuracy of the data underpinning this publication, it is possible that some errors remain.
The sources and definitions used are consistent with VOA’s existing statistical publications regarding non-domestic rates.
Our quality assurance follows the approach set out in the VOA Quality Policy.
15. Confidentiality
Access to the data and release prior to the day of its publication is limited to the statistics production team and named valuation experts to assist with quality assurance.
16. Glossary
Area code – a unique identifier for administrative geographies as specified by the Office for National Statistics (ONS).
Assessment – an entry in the rating list is often referred to as an assessment.
Antecedent Valuation Date (AVD) – valuations are based on the open market value on a single date, known as the Antecedent Valuation Date (AVD). The AVD for the 2023 revaluation is 1 April 2021.
Billing authority (BA) – a local authority empowered to collect non-domestic rates on behalf of itself and other local authorities in its area. In England, shires, metropolitan districts, the Council of the Isles of Scilly, unitary authorities, London boroughs and the City of London are BAs.
Billing authority code – a unique identifier for BAs.
Central rating list – the VOA’s list of rateable values for companies named in the Central Rating List Regulations, primarily for the network property of major transport, utility and telecommunications undertakings and cross-country pipelines. There are separate lists for England and Wales.
Compiled list – the rating list as it comes into effect following revaluation. For the 2017 rating list it is the list as at 1 April 2017. For the 2023 rating list, this is 1 April 2023.
Draft list – a draft rating list is made available in the months ahead of a revaluation.
Local rating list(s) – the VOA’s lists of all the non-domestic rateable properties in England and Wales. There is a separate local list for each BA.
Property type – each property on the non-domestic rating list is assigned a ‘primary description’. A primary description code is more generic than a SCat code (see below) and shows the nature of the use of the rateable property. Common primary descriptions are grouped together to form ‘property type’. There are six broad property types and 35 more detailed property types as shown in Tables 5.0 to 5.2.
Rateable property (also known as hereditament) – a unit of non-domestic property that is, or may become, liable to non-domestic rating and thus appears in the local rating list. The area of a property included in a rateable value calculation can cover all of one property, only part of a property or be several separate units in one building or site.
Rateable value (RV) – a monetary value assigned to every rateable property within a rating list, broadly based on the annual rent for which a rateable property could have been let on the open market at a set date.
Rating lists – each BA has their own local rating list. There are also two central rating lists, one for England and one for Wales.
Region – a geographical unit formerly referred to as Government Office Region (GOR). The GOR framework was the primary classification for regional statistics and comprised nine regions of England, which, combined with the devolved administrations, collectively spanned the United Kingdom. From 1 April 2011 the term GOR was dropped in favour of region. This release comprises English regions and Wales.
Revaluation – a revaluation is an update of the rateable values of all business, and other non-domestic, property in England and Wales at a particular point in time. Previous revaluations took place in 2010 and 2017. This revaluation takes effect on 1 April 2023.
Sector – a sector consists of the following categories: retail, industrial and office (RIO), which is a categorisation commonly used by those in the surveying profession. VOA statisticians have, in conjunction with operational colleagues, mapped each SCat code to one of the three categories. The ‘other’ category was created to cover SCat codes which could not be readily assigned to retail, office or industry.
Sub-sector – in addition to the four sectors, the SCat codes have also been mapped to 18 sub-sectors, within the overall retail/office/industrial/other categories.
Special category (SCat) code – each property on the non-domestic rating list is assigned a SCat code, which is an operational code used by the VOA to classify a property’s use for administrative purposes. A SCat code details the basis on which the property was rated.
Over 350 SCat codes are in use. Common property types are grouped together into sectors or sub-sectors as shown in Tables 4.0 to 4.2.
17. Further Information
The 2023 rating lists will take effect from 1 April 2023.
We welcome feedback from users on the usefulness of the information provided in this summary. Please forward any comments to the Statistics Inbox.