Statistical Commentary
Published 28 October 2021

© Crown copyright 2021
This publication is licensed under the terms of the Open Government Licence v3.0 except where otherwise stated. To view this licence, visit nationalarchives.gov.uk/doc/open-government-licence/version/3 or write to the Information Policy Team, The National Archives, Kew, London TW9 4DU, or email: psi@nationalarchives.gov.uk.
Where we have identified any third party copyright information you will need to obtain permission from the copyright holders concerned.
This publication is available at https://www.gov.uk/government/statistics/non-domestic-rating-challenges-and-changes-2017-and-2010-rating-lists-september-2021/statistical-commentary
About this release:
This release includes statistics on challenges made by taxpayers (or their representatives) against the 2010 and 2017 local rating lists up to 30 September 2021. It also includes statistics on reviews of rating assessments (known as “reports”) that have either been initiated by the VOA or a billing authority, when new information becomes available.
Responsible Statistician:
Jim Nixon
Statistical enquiries:
Date of next publication:
January 2022
1. Key findings
For England, as at 30 September 2021, the Valuation Office Agency (VOA) had:
-
registered 605,530 checks under the Check, Challenge, Appeal (CCA) system. 17,750 of these were registered in the last quarter (1 July 2021 to 30 September 2021)
-
registered 112,260 challenges under the CCA system. 7,440 of these were in the last quarter
In addition:
-
598,330 checks and 37,620 challenges have been resolved. 10,870 challenges have also been marked as incomplete
-
in the last quarter, 17,790 checks and 4,080 challenges have been resolved
-
200,270 Interested Persons (IPs) and 16,010 agents had registered to use the check and challenge service
-
the VOA have approved 593,930 property claims by businesses
While the statistics do not include the number of appeals made under CCA, as these are the responsibility of the independent Valuation Tribunal Service (VTS), the VTS publish their latest statistics here.
For Wales, as at 30 September 2021 the VOA had:
- received 520 challenges in the last quarter, with 1,080 challenges being resolved in the same period. 22,630 remain outstanding
For the 2010 list, covering both England and Wales, the quarterly statistics also show that, as at 30 September 2021, there were around 12,560 challenges outstanding, down from 23,220 Challenges for the previous three months. These include those awaiting listing, relisting or decisions from the Valuation Tribunal, which the VOA do not control, and some highly complex cases relating to specialist properties where a longer timeframe is necessary to settle the appeals.
2. Checks, Challenges and Changes against the England 2017 rating list
There has been an increase during the COVID-19 pandemic of interested persons using VOA services which is reflected in the statistics shown in this release.
On 25 March 2021, the government announced that measures brought in as a result of coronavirus, which affect the occupation of property, will not be considered an MCC for the purposes of business rates valuations in the 2017 rating list in England. More information is available here. A further business rates relief scheme was also announced, to be administered by billing authorities. The Government introduced The Rating (Coronavirus) and Directors Disqualification (Dissolved Companies) Bill to the House of Commons on 12 May 2021. This sets out, with retrospective effect, that direct and indirect matters attributable to Coronavirus are not to be considered in respect of determinations to alter 2017 rating lists in England. The Bill is currently progressing through the Parliament.
Before anyone can access more detailed valuation data about a property, they must prove that they have a legal interest in the property under the non-domestic rating legislation, for example as an owner or occupier or both. To do this, they are required to register to use the system and then can ‘claim their property’ through the VOA’s online service by providing proof of their relationship to the property, such as a copy of a business rates or utility bill. Once the VOA confirm the interested person’s relationship to the property, the claim is approved and the interested person is able to view or request the detailed valuation for that property. The interested party can then start the CCA process. More information is available here.
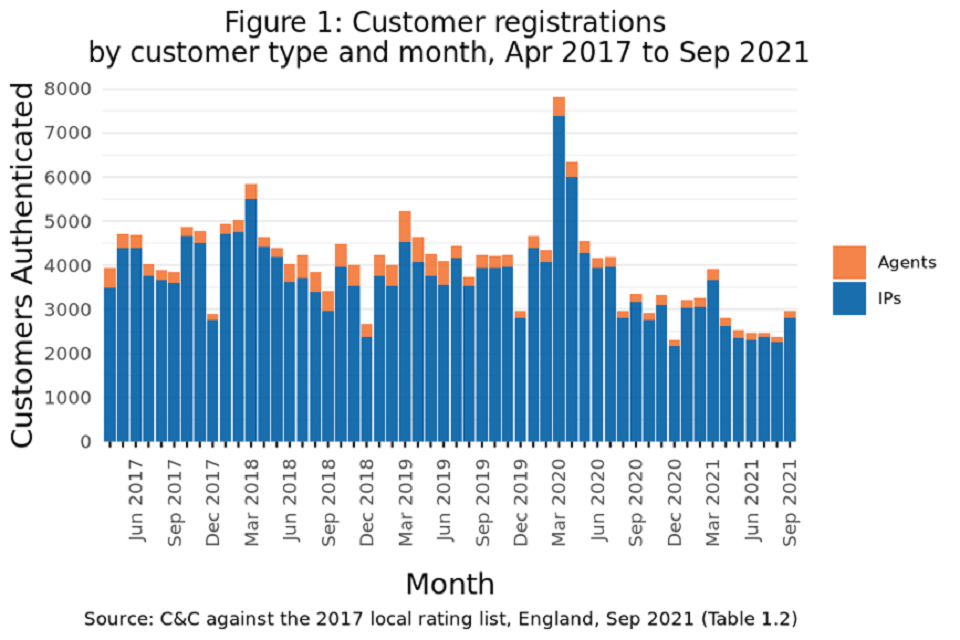
Figure 1: Customer registrations by customer type and month, Apr 2017 to Sep 2021
The number of interested persons (IPs) and agents registering for CCA each month is shown in Figure 1. More than 90% of registrations are from interested persons rather than agents. Increases seen in March and April 2020 is a spike attributable to the COVID-19 pandemic.
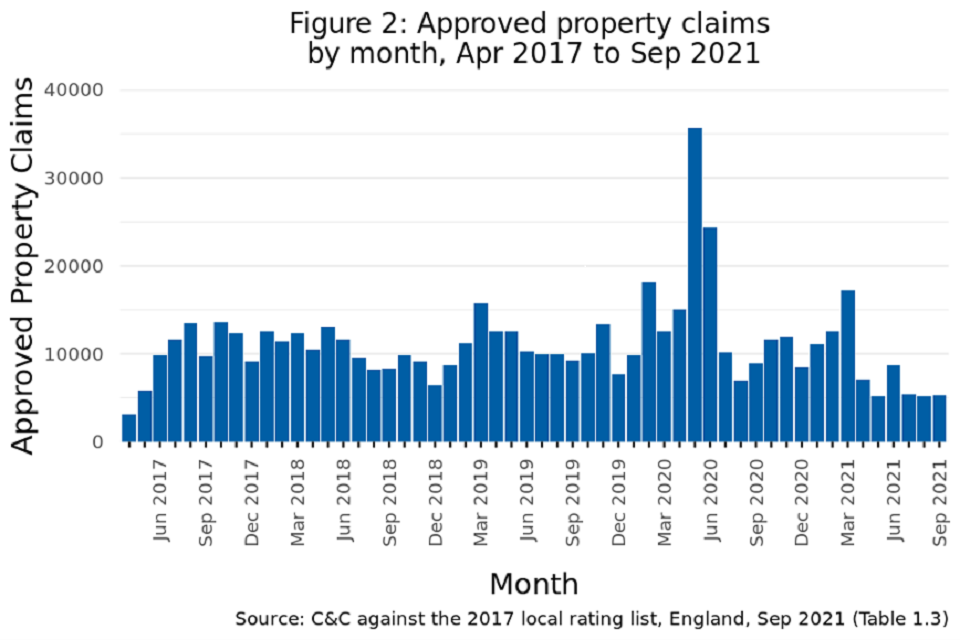
Figure 2: Approved property claims by month, Apr 2017 to Sep 2021
The number of approved property claims by month is shown in Figure 2. May and June 2020 are the months with the highest number of approved claims. The lag from the peak shown in Figure 1 reflects the time taken from a customer registering for CCA to then claiming a property and having their claim approved by a Valuation Officer.
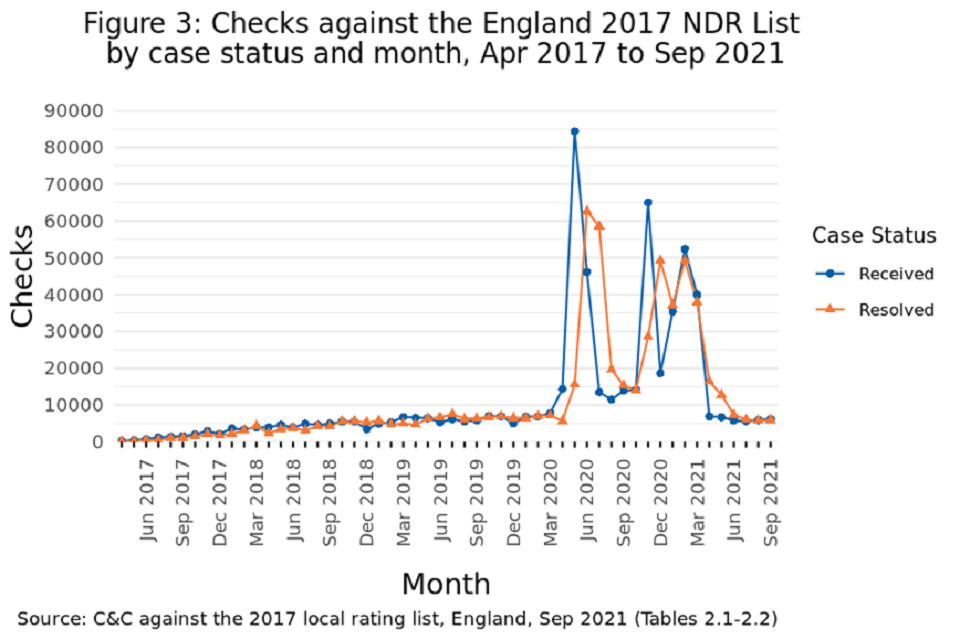
Figure 3: Checks against the England 2017 NDR List by case status and month, Apr 2017 to Sep 2021
Figure 3 shows the number of CCA checks received by month and case status. The 17,750 checks received in the quarter to 30 September 2021 is 3% of the total received since the start of the list in April 2017. The three spikes are attributable to the COVID-19 pandemic and were coincident with restrictions on businesses brought by government to curb the pandemic.
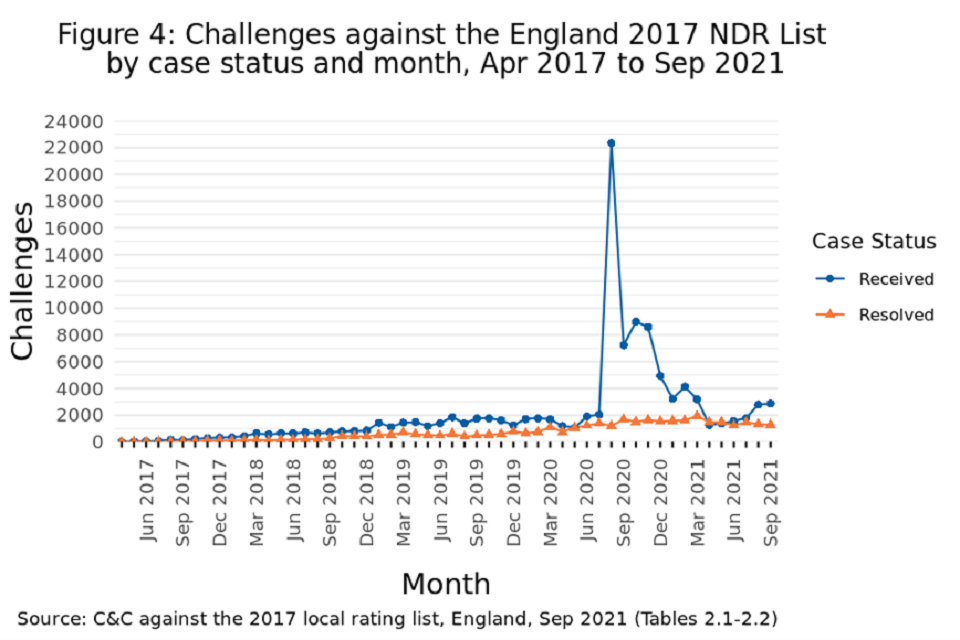
Figure 4: Challenges against the England 2017 NDR List by case status and month, Apr 2017 to Sep 2021
Figure 4 shows the number of CCA Challenges received by month and case status. August 2020 saw the highest amount of Challenges received in a single month by the VOA. The spike is a consequence of the previous rise seen in Checks (figure 3) attributable to the COVID-19 pandemic.
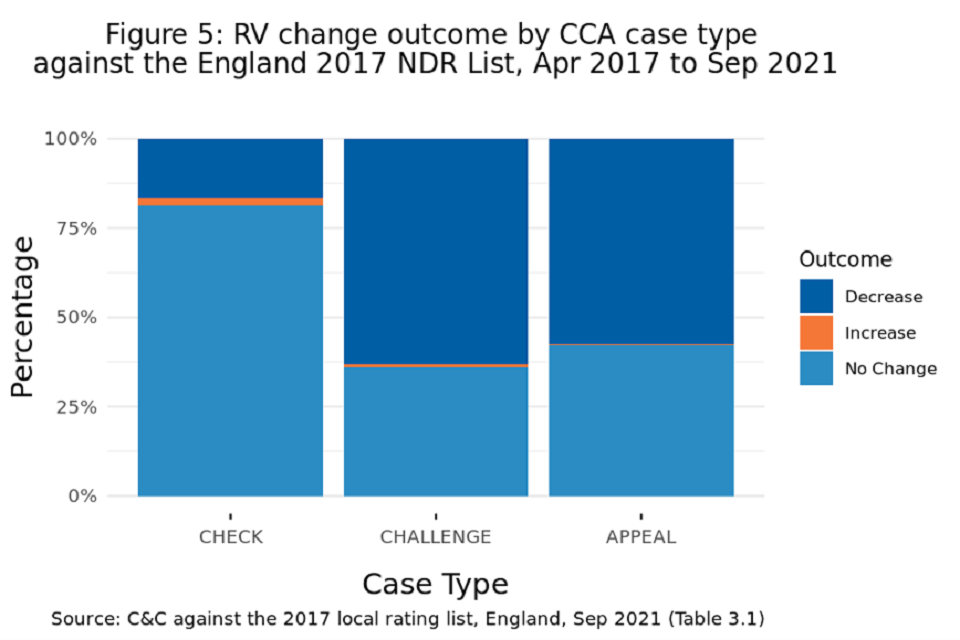
Figure 5: RV change outcome by CCA case type against the England 2017 NDR List, Apr 2017 to Sep 2021
Figure 5 shows a percentage breakdown for RV change outcome by CCA case type. Over 75% of Check cases result in no change to rateable value whereas over 50% of Challenge and Appeal cases result in a reduction.
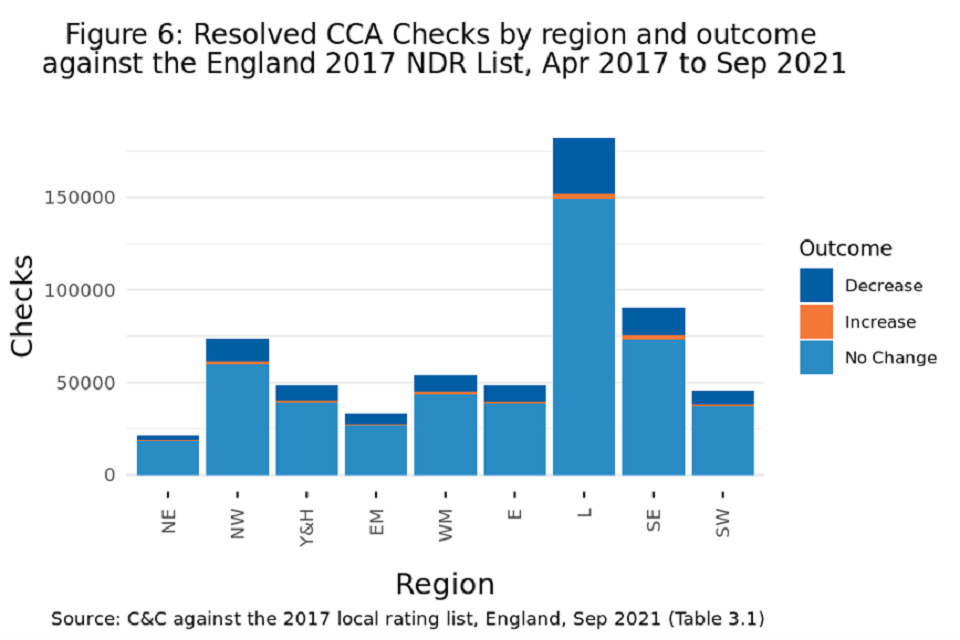
Figure 6: Resolved CCA Checks by region and outcome against the England 2017 NDR List, Apr 2017 to Sep 2021
Figure 6 shows the resolved CCA Check cases by geographical region and their RV change outcome. London has the highest amount cases (182,260) however around 82% of these result in no change to rateable value.
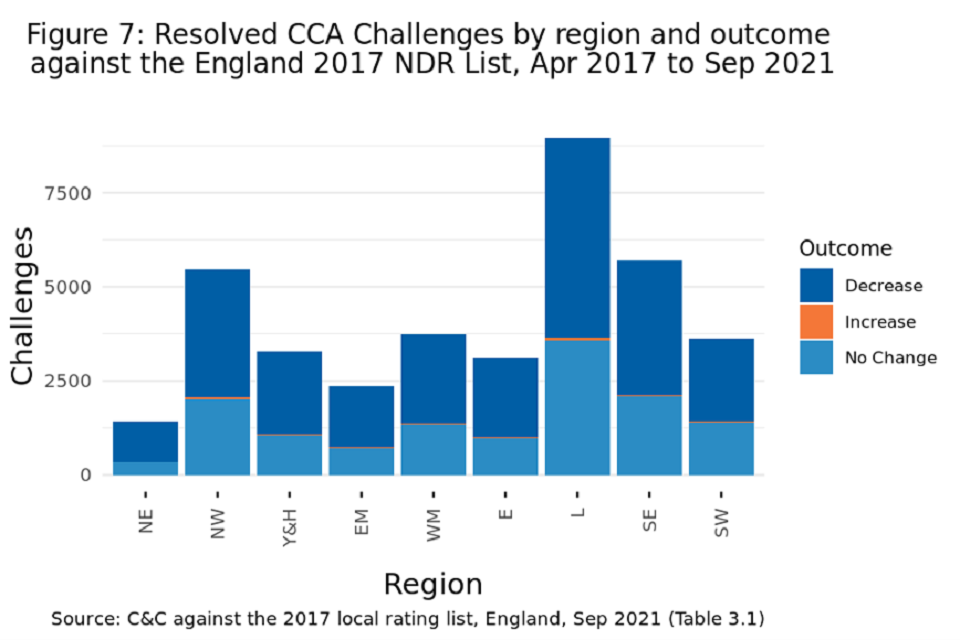
Figure 7: Resolved CCA Challenges by region and outcome against the England 2017 NDR List, Apr 2017 to Sep 2021
Figure 7 shows the resolved CCA Challenge cases by geographical region and their RV change outcome. London has the highest amount cases (8,960) with around 60% resulting in a reduction in rateable value.
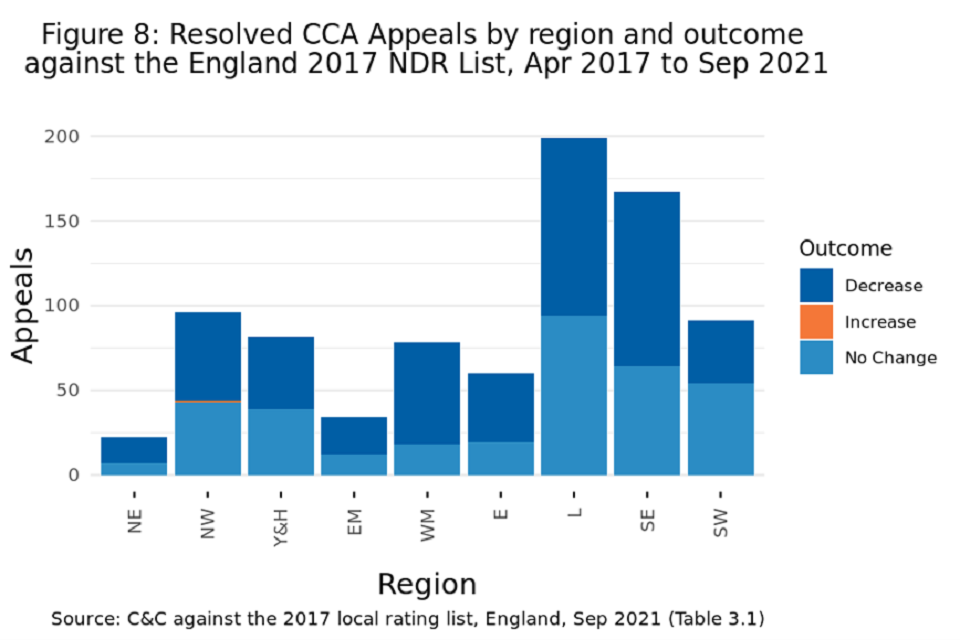
Figure 8: Resolved CCA Appeals by region and outcome against the England 2017 NDR List, Apr 2017 to Sep 2021
Figure 8 shows the resolved CCA Appeal cases by geographical region and their RV change outcome. London has the highest amount cases (200) with around 55% resulting in a reduction in rateable value.
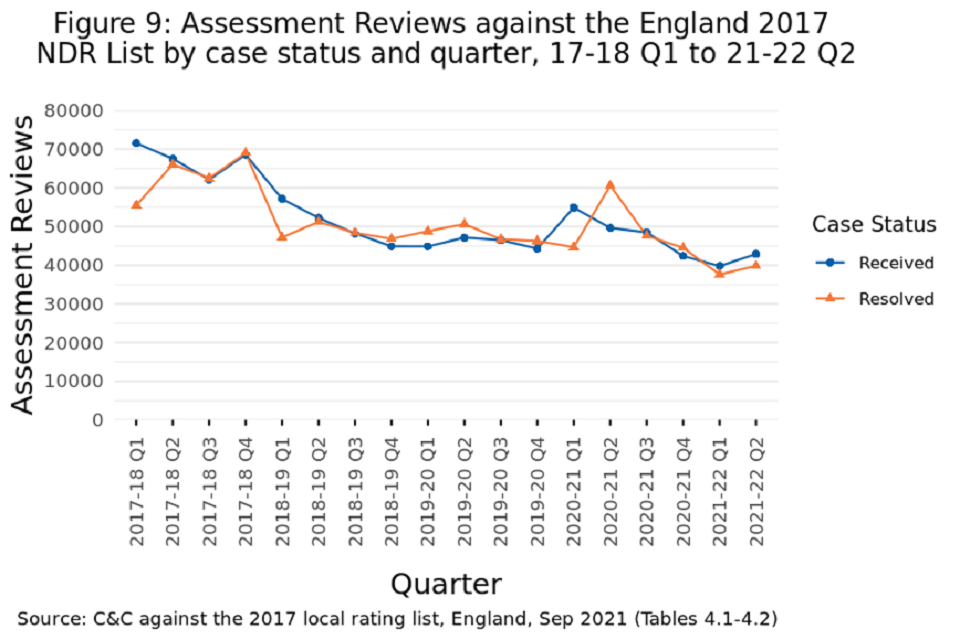
Figure 9: Assessment Reviews against the England 2017 NDR List by case status and quarter, 17-18 Q1 to 21-22 Q2
Figure 9 shows that the number of assessment reviews received and resolved against the England 2017 list have remained largely static in the quarter to 30 September 2021.
3. Challenges and Changes against the Wales 2017 rating list
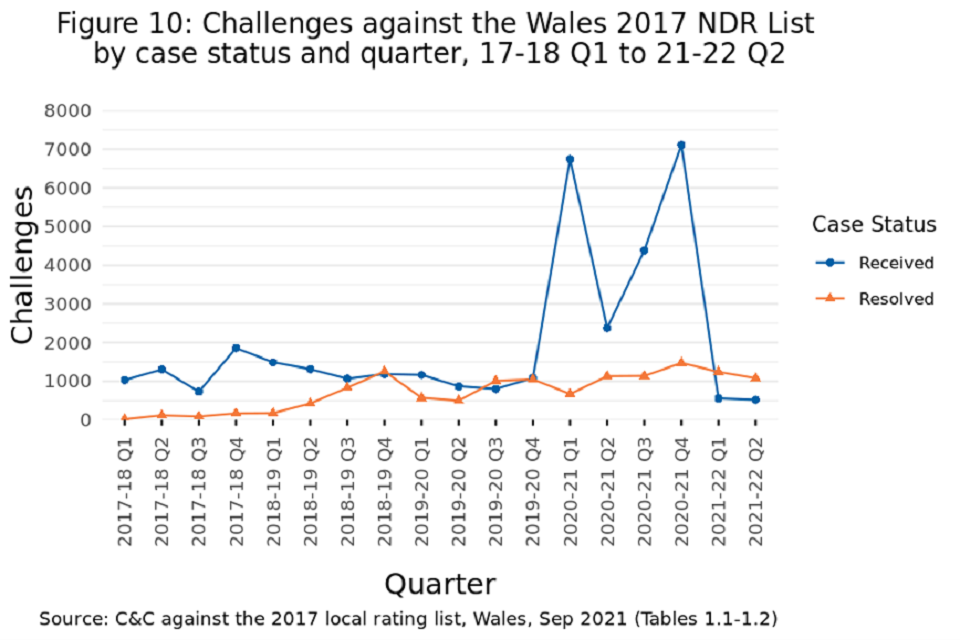
Figure 10: Challenges against the Wales 2017 NDR List by case status and quarter, 17-18 Q1 to 21-22 Q2
Figure 10 shows that the number of challenges received against the Wales 2017 list was the lowest on record in the quarter to 30 September 2021. Challenges resolved remained largely static in the same period.
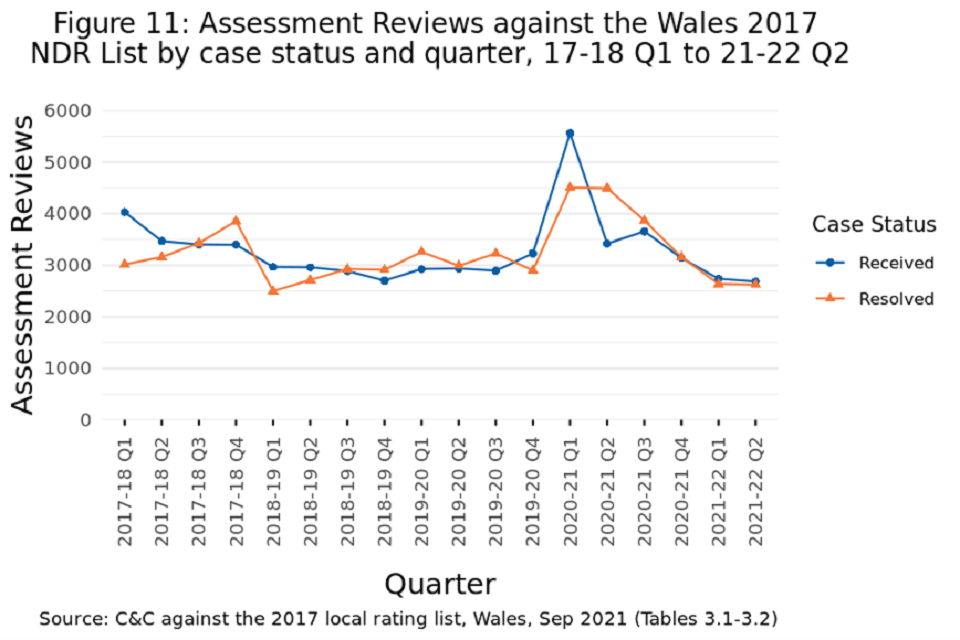
Figure 11: Assessment Reviews against the Wales 2017 NDR List by case status and quarter, 17-18 Q1 to 21-22 Q2
Figure 11 shows that the number of assessment reviews received against the Wales 2017 list was the lowest on record in the quarter to 30 September 2021. Assessment reviews resolved remained largely static in the same period.
4. Background notes
This release includes statistics on challenges made by taxpayers (or their representatives) against the 2010 and 2017 local rating lists. It also includes statistics on reviews of rating assessments (known as reports) that have either been initiated by the VOA or a billing authority, when new information becomes available.
Previous quarters’ figures include retrospective changes so will not necessarily be the same as those from previous publications.
Figures in the release note may be rounded to a different level of precision from the figures in the MS Excel tables and should therefore be considered more definitive.
The statistics are derived from VOA’s administrative database and are published at national, regional and billing authority level.
The VOA is required, by the Local Government Finance Act 1988, to compile and maintain accurate rating lists specifying a rateable value for all non-domestic rateable properties in England and Wales. These rateable values provide the basis for national non-domestic rates bills, which are issued by billing authorities. There is a local rating list for each billing authority. However, for simplicity, we have referred to these throughout this publication as one combined ‘rating list’ for those local lists effective from 1 April 2010, and, likewise, one combined ‘rating list’ for those local rating lists effective from 1 April 2017.
Ratepayers, owners, and in limited circumstances, relevant authorities and other persons (known formally as Interested Persons) can make a challenge to alter the rating list if they think an entry is incorrect. Challenges can also be made on behalf of interested persons by their professional representatives.
The process for challenging the rating list currently differs between England and Wales. In Wales a challenge, known as a proposal, is made to the Valuation Officer asking them to change the entry in the rating list. After a period of discussion if the Valuation Officer cannot reach agreement with the ratepayer the matter will then be referred to the Valuation Tribunal Service, at which stage it becomes an appeal. In England a new three stage appeals system was introduced in 2017, called Check, Challenge, Appeal (CCA).
More information about CCA can be found in the Background Information document.
5. Further information
More detailed information on the 2017 local rating list is available on the Agency’s website at the following location: https://www.gov.uk/correct-your-business-rates
Further information on the area codes used in this release please refer to the ONS’s website at the following location: https://www.ons.gov.uk/methodology/geography/geographicalproducts/namescodesandlookups/ namesandcodeslistings
Timings of future releases are regularly placed on the VOA research and statistics calendar.
We will keep under review the format of this summary document to improve the presentation of our statistics and welcome feedback from users on the usefulness of the information provided in this summary. As part of our improvement programme, if you’re interested in participating in user research about this statistical release please contact us via statistics@voa.gov.uk