National Insurance numbers allocated to adult overseas nationals to March 2026
Published 21 May 2026

© Crown copyright 2026
This publication is licensed under the terms of the Open Government Licence v3.0 except where otherwise stated. To view this licence, visit nationalarchives.gov.uk/doc/open-government-licence/version/3 or write to the Information Policy Team, The National Archives, Kew, London TW9 4DU, or email: psi@nationalarchives.gov.uk.
Where we have identified any third party copyright information you will need to obtain permission from the copyright holders concerned.
This publication is available at https://www.gov.uk/government/statistics/national-insurance-numbers-allocated-to-adult-overseas-nationals-to-march-2026/national-insurance-numbers-allocated-to-adult-overseas-nationals-to-march-2026
This publication contains statistics on National Insurance Numbers (NINos) allocated to adult non-UK overseas nationals to March 2026.
These Department for Work and Pensions (DWP) statistics show a count, by individual nationality, of the number of NINos registered to adult non-UK nationals, irrespective of the length of stay in the UK. The statistics are not a count of quarterly or annual migration or the number of adult nationals currently residing in the UK. The statistics only show the nationality of the individual at the point of registration.
The narrative in this publication focuses on the number of registrations for 12 month ending totals, at quarterly intervals, rather than the numbers of registrations each quarter. The benefit of this is that it allows us to focus on trends over longer periods of time.
Also, quarterly numbers can often be influenced by seasonal effects and various changes to policy. Both quarterly and annual numbers are available via Stat-Xplore.
Statistical Trends
When observing statistical trends in this release, it is helpful to understand the context of world events during the period covered by the statistics. Changing make-up of constituent nation states within the EU, with nations joining the EU, and the UK’s EU exit, as well as global conflicts such as the ongoing conflict in Ukraine, impacts of the pandemic and subsequent changes to the travel rules because of government migration policies and COVID-19 have all had an impact on the trends seen in the time series. For more information on world events that may have influenced statistical trends, see the background information and methodology note.
Figures within this release have been rounded in line with our rounding policy. Figures in the text, charts and tables within this bulletin may not sum due to rounding. Figures in the graphs are plotted using unrounded numbers.
1. Main stories
The main stories are:
-
for the year ending (YE) March 2026 there were 560,000 NINo registrations from non-UK adult overseas nationals. This compares to 640,000 registrations for the YE March 2025
-
the majority of registrations for the YE March 2026 were from non-EU nationals with 500,000, compared to 55,000 registrations from EU nationals and 7,700 registrations from unknown nationalities
-
numbers of non-EU registrations fell from 570,000 at YE March 2025 to 500,000 at YE March 2026, while EU registrations fell from 60,000 at YE March 2025 to 55,000 at YE March 2026
-
for the YE March 2026, the nationality with the highest number of registrations from non-EU nationals was India with 120,000, followed by Pakistan with 44,000 registrations
-
for the YE March 2026 the nationality with the highest number of registrations from EU nationals was Ireland with 12,000, followed by Romania with 6,700 registrations
2. What you need to know
The two main methods of applying for a NINo are:
-
Directly to DWP at GOV.UK via Apply for a NINo (AfN)
-
Via the Home Office when an application for a visa is made
Apply for a Nino (AfN) is a digital NINo application service where users can apply for a NINo on-line, the service is open 24 hours a day, 7 days a week. For more information on how these processes work see background information and methodology note.
EU groupings used within migration statistics
The following EU groupings are used in the statistics:
-
EU14 (these are the EU members: Austria, Belgium, Denmark, Finland, France, Germany, Greece, Ireland, Italy, Luxembourg, Netherlands, Portugal, Spain, and Sweden)
-
EU8 (these joined the EU in 2004: Czech Republic, Estonia, Hungary, Latvia, Lithuania, Poland, Slovakia, and Slovenia)
-
EU2 (these joined the EU in 2007: Romania & Bulgaria)
-
EU Other (Croatia, Cyprus, and Malta)
For reporting purposes, other European nationalities not in the EU are labelled ‘other Europe’ and are classified as non-EU. This includes countries such as Ukraine. For a full list of world areas and their sub-groups and nationalities, see background information and methodology note.
3. How many people are registering?
Year-end (YE) NINo registration totals for EU and non-EU nationals: to YE March 2026

Source: Stat-Xplore
Note: Figures in the graph show 12 month ending totals, plotted at quarterly intervals. The values on the right of each plotted line show the total number of NINo registrations for the latest year end.
For more information on time point descriptions, please see background information and methodology note.
From the beginning of this statistical series, the total number of non-UK overseas NINo registrations fluctuated but gradually increased to 920,000 registrations for YE June 2015. Following this peak, numbers fluctuated, falling to 620,000 in YE September 2018 then rising to 760,000 in YE March 2020, before falling to a record low for YE March 2021 with 230,000 registrations.
Total registrations then continued to rise until YE June 2023, where it reached 1.1 million and remained at 1.1 million until YE December 2023. Since then, YE total registrations for each quarter continued to fall steeply to 630,000 at YE June 2025, coinciding with recent immigration policies. Since then, registrations have fluctuated but have overall fallen to 560,000 at YE March 2026.
The majority of registrations for YE March 2026 were from non-EU nationals at 500,000 (89%) compared to 55,000 (10%) from EU nationals. The remaining 7,700 (1%) were from unknown nationalities. These are similar proportions to the previous YE March 2025 when majority of registrations were from non-EU nationals at 570,000 (89%) compared with 60,000 (9%) from EU nationals, and 10,000 (2%) from unknown nationalities.
Since YE June 2005, NINo registrations from EU nationalities were always in the majority, apart from a short period between YE March 2010 and YE December 2010, when non-EU nationalities had slightly more registrations than EU. However, since YE September 2020, there have consistently been more NINo registrations from non-EU nationals than EU nationals.
4. Where in the world are people registering from?
Percentage of NINo registrations by EU/non-EU nationality group: Year End (YE) March 2022 to YE March 2026

Source: Stat-Xplore
Note: Percentages are calculated using unrounded data and then rounded to the nearest whole number. Therefore, percentages in charts may not add up to 100 and percentages quoted in text may not reflect the sum of percentages shown in the charts.
The percentage of NINo registrations from non-EU nationals increased from 72% for YE March 2022 to 91% for YE March 2024. Since then, proportions have slightly decreased and stand at 89% for YE March 2026.
The percentage of NINo registrations from EU nationals (not including EU other) has fallen from 23% in YE March 2022 to 10% for YE March 2026.
The decrease in percentages of EU NINo registrations is evident in all EU groups when compared with YE March 2022. EU14 decreasing from 13% to 7%, EU2 from 7% to 2% and EU8 decreasing from 3% to 1%.
5. EU NINo Registrations
Year-end (YE) NINo registration totals by EU nationality group: to YE March 2026

Source: Stat-Xplore
Note: Figures in the graph show 12 month ending totals, plotted at quarterly intervals.
For more information on time point descriptions, please see background information and methodology note.
Registrations from EU14 nationalities gradually increased from 2002 until they peaked at 260,000 in YE June 2015, before declining to 160,000 at YE December 2018, following the EU Exit referendum in June 2016. Numbers then began to increase slightly until YE December 2019, then declined rapidly until YE March 2021 (35,000). Registrations from EU14 nationalities increased to 100,000 at YE March 2022, before continuously falling to 44,000 at YE September 2024, and have since remained relatively stable, with 40,000 registrations at YE March 2026. The EU14 group has had the largest number of registrations of all the EU groups since YE March 2019.
Registrations from EU8 nationalities drove the sharp rise in EU NINo registrations in 2004, when countries from the EU8 joined the EU. EU8 nationalities registrations peaked for the YE September 2007 at 340,000 registrations, after which numbers declined until YE March 2010 to 150,000. After a period of volatility, EU8 registrations again generally declined since the EU Exit referendum in 2016 to 8,500 registrations at YE March 2021. Registrations then increased sharply to YE March 2022 reaching 23,000 but have since decreased gradually to 4,600 registrations at YE March 2026.
Registrations from EU2 nationals were relatively low until the removal of restrictions on work for EU2 nationals drove the sharp increase in EU registrations in 2014. Some of these reflected individuals who were residing in the UK prior to 2014 and would only have been able to register for a NINo after that date. EU2 nationals registrations peaked in the YE December 2016, with 230,000 registrations, then declined gradually until YE March 2020 (160,000). Following this, registrations declined steeply until YE March 2021 when they had fallen to 28,000. Registrations then increased to 59,000 by YE December 2021 but have since declined to 8,800 at YE March 2026.
NINo registrations from EU ‘other’ have remained consistently low throughout the timeseries and there were only 1,100 registrations for YE March 2026.
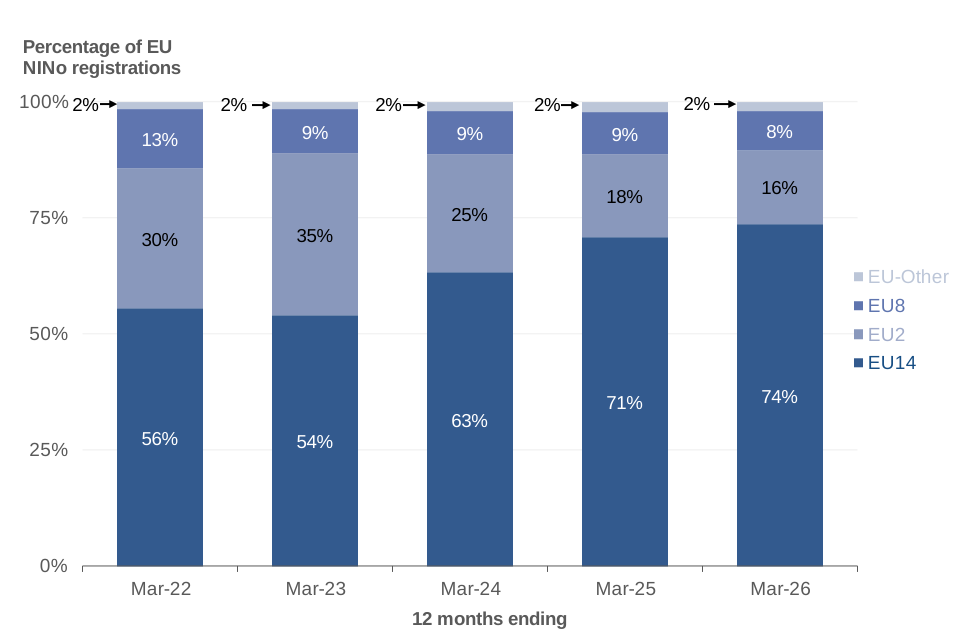
Percentage of EU Registrations by EU nationality group: Year-end (YE) March 2022 to YE March 2026
Source: Stat-Xplore
Note: Percentages are calculated using unrounded data and then rounded to the nearest whole number. Therefore, percentages in charts may not add up to 100 and percentages quoted in text may not reflect the sum of percentages shown in the charts.
The majority of registrations from EU nationals over the last 5 years have been from those in the EU14 subgroup. The percentage as a proportion of registrations has increased for the EU14 group, 74% at YE March 2026 when compared to 56% at YE March 2022. EU-other has remained stable while EU8 and EU2 have fallen when compared to YE March 2022.
Registrations from nationalities in the EU2 group have the second highest proportion of registrations of all the EU groups with 16% at YE March 2026. The percentage at YE March 2022 was 30% and remained fairly stable until YE March 2023 before falling to 16% at YE March 2026.
Registrations from EU8 account for 8% of EU registrations from YE March 2026, falling from 13% at YE March 2022 to 9% at YE March 2023, then remaining stable until falling by one percentage point at the latest YE.
Registrations from EU ‘other’ have remained stable since YE March 2022 and account for only 2% of EU registrations for YE March 2026.
Top five EU nationalities by total NINo registrations for year-end (YE) March 2025 and YE March 2026

Source: Stat-Xplore
The top five EU nationalities that registered for a NINo for YE March 2026 have remained in the same top five position since YE March 2025.
Although each has seen a decrease in the number of registrations in the latest YE apart from Ireland.
For YE March 2026, Ireland is the EU nationality with the highest number of registrations (12,000), compared with 11,000 registrations at YE March 2025. Ireland is part of the Common Travel Area (CTA) which allows British and Irish citizens to move freely and reside in either jurisdiction. (see background information and methodology note for further details).
Registrations from those with a Romanian nationality remain the second highest number of registrations (6,700) for YE March 2026, decreasing from 8,100 registrations for the YE March 2025.
For YE March 2026, those with a French nationality had the third highest number of registrations (5,300), a fall of 200 compared to YE March 2025.
For YE March 2026, NINo registrations from Italian nationals were the fourth highest at 5,100, followed by Spanish nationals with 4,300.
Five-year timeseries showing YE totals of NINo registrations for the top five EU nationalities at YE March 2026

Source: Stat-Xplore
Note: Figures in the graph show 12 month ending totals, plotted at annual intervals.
Figures for the top five EU nationalities at YE March 2026 show Irish nationals have the highest number of registrations at 12,000. Registrations decreased from 14,000 at YE March 2022 to 13,000 at YE March 2023, then fell further to 12,000 at YE March 2026.
Romania has the second highest number of registrations at 6,700. Registrations for Romania were 40,000 at YE March 2022, falling steeply to 6,700 registrations at YE March 2026.
French registrations are the third highest at YE March 2026 at 5,300, a decrease from 11,000 at YE March 2022.
Italian nationals have the fourth highest numbers of EU registrations at YE March 2026 at 5,100 falling from 19,000 at YE March 2022.
Spanish registrations are the fifth highest at YE March 2026 at 4,300, a fall from 16,000 for YE March 2022.
6. Non-EU registrations
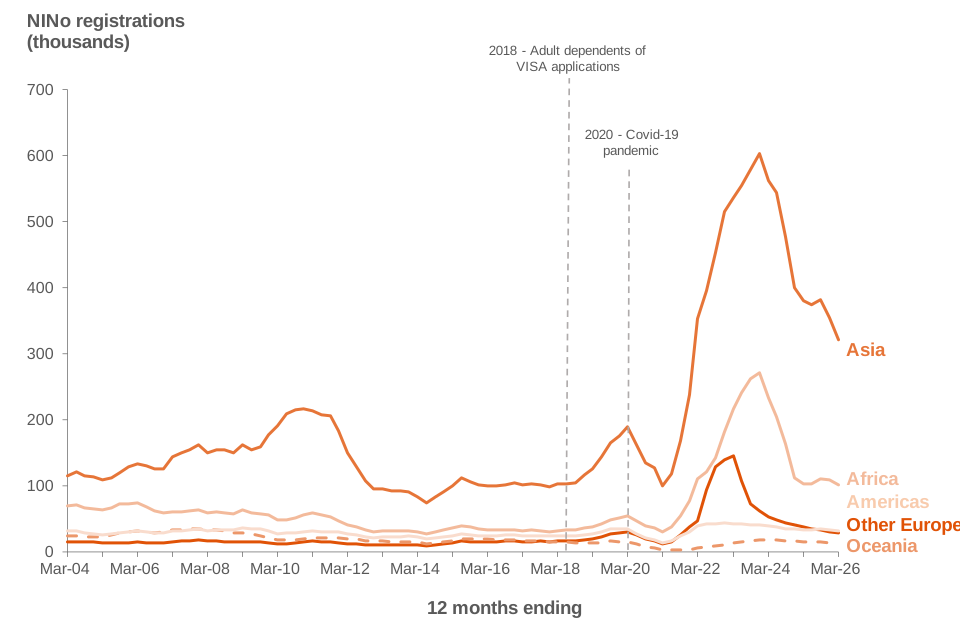
Year End (YE) NINo registration totals by non-EU nationality group: to YE March 2026
Source: Stat-Xplore
Note: Figures in the graph show 12 month ending totals, plotted at quarterly intervals.
For more information on time point descriptions, please see background information and methodology note.
Since the timeseries began, NINo registrations from Asian nationals have always been the highest of all registrations from the non-EU groups, peaking at YE December 2010 with 220,000, but then declining to 75,000 at YE June 2014. Registrations then remained stable until YE December 2018 before gradually increasing to 190,000 at YE March 2020. Registrations then fell to 100,000 at YE March 2021, increasing steeply to 600,000 by YE December 2023. Since then numbers of registrations have decreased sharply to 320,000 at YE March 2026.
Registrations from African nationals remained relatively stable before peaking in YE March 2006 with 74,000 registrations, after which the number of registrations continued to decline to 27,000 at YE June 2014. Registrations from Africa were then stable, until they started to increase from YE December 2018 to reach 56,000 at YE March 2020 before falling to 31,000 at YE March 2021. Numbers of registrations since rose steeply to 270,000 at YE December 2023 before falling to 100,000 at YE March 2025 and has since remained stable at 100,000 at YE March 2026.
Registrations from America have mostly been low. Registrations gradually increased to 36,000 at YE March 2009, then decreased to 20,000 at YE June 2014. The number of registrations then remained relatively stable before gradually increasing to 35,000 at YE September 2019, before decreasing sharply to 14,000 at YE March 2021. Since then, number of registrations peaked at a high of 44,000 at YE December 2022 but have since decreased to 33,000 at YE March 2026.
Similarly, registrations from Oceania have always remained low but peaked at YE December 2007 at 35,000. Since then, the registration numbers remained stable before gradually decreasing to 2,900 at YE June 2021 before rising to 14,000 at YE March 2026.
Registrations from nationalities who are not part of the EU (Other Europe), remained relatively low and stable until YE March 2018 when, for the first time, they had more registrations than Oceania at 17,000 compared with 16,000 for Oceania. Registrations then increased to 31,000 at YE March 2020, before falling to 12,000 in YE March 2021. Following this, registrations increased steeply to 150,000 at YE March 2023. This can be attributed to an increase in registrations from Ukrainian nationals following breakout of conflict with Russia. Since then, the number of ‘Other Europe’ registrations has fallen to 30,000 at YE March 2026.
It should be noted that the noticeable increase in registrations from non-EU nationals after September 2018 until the beginning of 2020, is mostly due to registration for a NINo of adult dependants as part of certain visa approvals. See background information and methodology note for more information.
Percentage of non-EU registrations by non-EU nationality group: to Year End (YE) March 2026

Source: Stat-Xplore
Note: Percentages are calculated using unrounded data and then rounded to the nearest whole number, therefore may not add up to 100.
Registrations by Asian nationals remain the non-EU group with the largest proportion of NINo registrations at YE March 2026 (64%). The proportion has fluctuated slightly each year since YE March 2022 when it was 63%.
Registrations from African nationals have the next highest proportion at 20% at YE March 2026. The proportion at YE March 2022 was 20%, increasing to 26% at YE March 2024, before decreasing to 20% at YE March 2026.
The proportion of registrations from the Americas were 7% at YE March 2026. From YE March 2022 to YE March 2024 the percentage of registrations fell from 7% to 4%, but has since risen back to 7% at YE March 2026.
At YE March 2022 the proportion of registrations from ‘other Europe’ was 9% which increased to 15% at YE March 2023. Since then, the proportion of registrations fell and remained fairly stable, standing at 6% at YE March 2026.
The proportion of registrations for Oceania was 3% at YE March 2026, compared with 1% at YE March 2022.
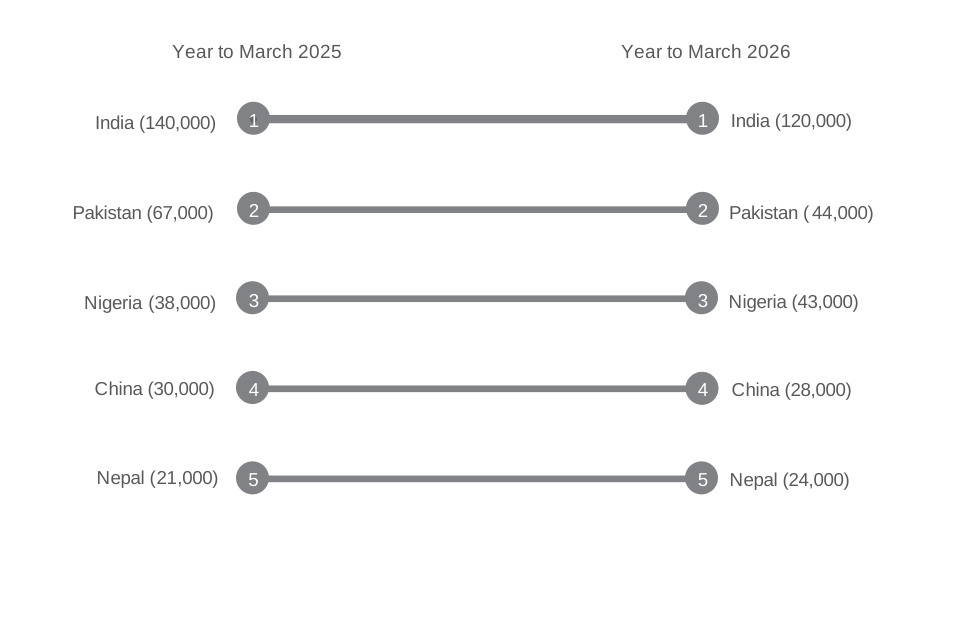
Top five non-EU nationalities by total NINo registrations for YE March 2025 and YE March 2026
Source: Stat-Xplore
When compared with registrations from other non-EU nationals at YE March 2026 India remain the nationality with the highest number, with 120,000 at YE March 2026, decreasing from 140,000 registrations at YE March 2025.
Registrations from Pakistan nationals remain the second highest at YE March 2026 with 44,000 registrations, a decrease from 67,000 at YE March 2025.
Nigeria remains third highest with 43,000 registrations at YE March 2026, increasing from 38,000 at YE March 2025.
The non-EU nationality with the fourth highest number of NINo registrations was China with 28,000 registrations at YE March 2026, a decrease from 30,000 at YE March 2025, when they were also the fourth highest.
Nepal had the fifth highest number of non-EU registrations at YE March 2026 at 24,000, compared to YE March 2025 where it was also ranked fifth at 21,000.
It is worth noting that the chart above does not include those that have registered for a NINo with a British Nationals Overseas (BNO) nationality. At present there is no category in the operational data system for BNO nationality therefore they are recorded as having an unknown nationality in the data. See background information and methodology note for more information.
Timeseries showing YE totals of NINo registrations for the top five non-EU nationalities at Year End (YE) March 2026

Source: Stat-Xplore
Note: Figures in the graph show 12 month ending totals, plotted at annual intervals.
Figures for the top five non-EU nationalities at YE March 2026 show India has the highest number of registrations at 120,000. The number of registrations increased from 170,000 at YE March 2022 to 270,000 at YE March 2023 followed by a decrease to 120,000 at YE March 2026.
Pakistan had the second highest numbers of registration with 44,000 at YE March 2026. The number of registrations increased from 44,000 at YE March 2022 to 89,000 at YE March 2024 but has since decreased to 44,000 at YE March 2026.
Nigeria had the third highest number of registrations at YE March 2026 at 43,000. Numbers of registrations rose from 59,000 at YE March 2022 to 120,000 at YE March 2023, before falling to 43,000 at YE March 2026.
China had the fourth highest number of registrations at 28,000 at YE March 2026. Registrations increased from 21,000 at YE March 2022 to 36,000 at YE March 2023, but has since fallen to 28,000 at YE March 2026.
Nepal had the fifth highest number of non-EU registrations at YE March 2026 with 24,000. The numbers of registrations rose from 8,300 at YE March 2022 to 20,000 at YE March 2024. Registrations then increased to 24,000 at YE March 2026.
7. Where in the UK are people registering?
Year-end (YE) total of NINo registrations by region and non-EU/EU groups for YE March 2026
| Region | Non-EU | EU |
|---|---|---|
| London | 150,000 | 18,000 |
| South East | 49,000 | 4,600 |
| West Midlands | 49,000 | 2,500 |
| North West | 47,000 | 3,100 |
| East of England | 33,000 | 3,300 |
| Scotland | 33,000 | 2,900 |
| Yorkshire and The Humber | 30,000 | 1,900 |
| East Midlands | 26,000 | 2,000 |
| South West | 21,000 | 2,000 |
| North East | 14,000 | 590 |
| Wales | 10,000 | 670 |
| Northern Ireland | 6,400 | 3,000 |
| Overseas Registration | 26,000 | 8,900 |
| Unknown or Missing Region | 4,200 | 1,100 |
Source: Stat-Xplore
Note: Overseas indicates registrations which were obtained via Home Office Visa scheme prior to arrival in UK. Geography information is based on address given at time of NINo registration.
At YE March 2026, the number of registrations from non-EU nationals were greater than registrations from EU nationals (500,000 compared with 55,000) and this was reflected across all regions.
43% of all registrations with a known UK address at the time of registration for YE March 2026 resided in London or the South East regions at the time of NINo registration.
The region with the highest number of NINo registrations was London with 150,000 non-EU registrations and 18,000 EU registrations.
The South East region had the second highest number of registrations with 49,000 non-EU and 4,600 EU registrations.
Top 10 Local Authorities by total of NINo registrations for YE March 2026
| Local Authorities | Registrations |
|---|---|
| Newham | 18,000 |
| Birmingham | 18,000 |
| Manchester | 13,000 |
| Tower Hamlets | 10,000 |
| Glasgow City | 9,700 |
| City of Edinburgh | 9,200 |
| Coventry | 9,200 |
| Ealing | 9,000 |
| Leeds | 9,000 |
| Redbridge | 8,700 |
Source: Stat-Xplore
Note: Geography information is based on address given at time of NINo registration.
The local authority with the highest number of registrations at YE March 2026 was Newham, closely followed by Birmingham, both with 18,000 registrations. Manchester was third with 13,000.
8. About these statistics
Re-designation of Accredited Official Statistics status
These statistics are accredited official statistics and were independently reviewed by the Office for Statistics Regulation (OSR) in November 2020. They comply with the standards of trustworthiness, quality and value in the Code of Practice for Statistics and should therefore be labelled ‘accredited official statistics’. Accredited official statistics are called National Statistics in the Statistics and Registration Service Act 2007. For more information see background information and methodology note.
OSR introduced the term ‘Accredited Official Statistics’ to describe National Statistics in September 2023. This was done following OSR’s review of the National Statistics designation and subsequent designation refresh project, which found the term ‘National Statistics’ was not well understood by users of statistics.
Our statistical practice is regulated by the Office for Statistics Regulation (OSR). OSR sets the standards of trustworthiness, quality and value in the Code of Practice for Statistics that all producers of official statistics should adhere to.
You are welcome to contact us directly with any comments about how we meet these standards by emailing the cbm.stats@dwp.gov.uk.
Alternatively, you can contact OSR by emailing regulation@statistics.gov.uk or via the OSR website.
EU exit
The Immigration and Social Security Co-ordination (EU Withdrawal) Act 2020 ended free movement between the EU and the UK on 31 December 2020 and the Future Relationship treaty came into force, launching the new Points Based Immigration System. Read the background information and methodology note for further information on the EU Exit.
What can you use these figures for?
The statistics provide:
-
a 100% count of non-UK overseas nationals registered for a NINo
-
Stat-Xplore allows users to tabulate NINo registrations for each quarter and Year-End Nino registrations (for each quarter)
-
the focus of this bulletin is on NINo registrations for Year End (YE)
-
the nationality of non-UK overseas nationals at the time of registering
-
the geographical location of the non-UK overseas nationals at the time of registering
What you cannot use these figures for
The statistics cannot be used as a count of:
-
quarterly or annual migration to the UK
-
the number of non-UK overseas nationals who have started work or are currently in work
-
the number of non-UK overseas nationals who are currently in the UK
The statistics show the number of people registered for a NINo in order to work or to claim benefits and tax credits and are one of a number of supplementary measures produced by government of in-migration to the UK.
Although quarterly registration figures are provided in Stat-Xplore, care should be taken when interpreting quarterly changes as they might reflect changes in operational activity. Annual year-on-year changes are more reliable to reflect longer-term trends.
The statistics are published as part of the scheduled timetable for the release of cross-Government migration statistics.
Read the background information and methodology note for further information, including detail on uses and limitations of the series.
Comparisons with other sources of migration
NINo statistics are not a direct measure of long-term migration and therefore are not directly comparable with Office for National Statistics (ONS) long-term estimates of immigration.
Transformation of migration statistics
The Office for National Statistics (ONS) have transformed the way they measure Long-Term International Migration (LTIM). Since 2021, data from the Home Office and Department for Work and Pensions have been used to produce Admin-Based Migration Estimates (ABMEs). For more information on how these are developed, see Provisional long-term international migration estimates: technical user guide – Office for National Statistics (ons.gov.uk).
Methodology for assigning geographies
Since the February 2023 release, the statistical method for assigning geographies has been improved. For more information on how geographies are assigned see background information and methodology note.
For this release, the statistics has been produced using COA21 geographies. In addition, the historic time series available on Stat-Xplore have been revised across all series to reflect these updated boundaries. Read the full guidance on: Changes to DWP statistical geographies in National and Official statistics – GOV.UK.
Rounding policy
Numbers in this bulletin have been rounded as detailed in the background information and methodology note. Percentage changes are calculated prior to rounding and then are rounded to the nearest whole number. As all figures within this bulletin have been rounded, therefore they may not sum to totals.
Due to rounding and the inclusion of unknown nationalities in the total, the total figure could differ from the sum of EU and non-EU.
World Areas
For reporting purposes, countries have been grouped into ‘world areas’ based primarily on geographical location. Countries are grouped according to current world area status for the entire back series.
| World Area | Sub-Group | |
|---|---|---|
| European Union (EU) | European Union EU14 (original EU members), European Union EU8 (joined EU in 2004), European Union EU2 (joined EU in 2007), European Union Other | |
| Non-European Union (Other Europe) | Other Europe | |
| Asia | Middle East and Central Asia, East Asia, South Asia, South East Asia | |
| Africa | Sub-Saharan Africa, North Africa | |
| Americas | North America, Central and South America | |
| Oceania | Oceania |
A detailed nationality breakdown for each world area is available in the background information and methodology note.
Release schedule
The statistics are published quarterly in February, May, August, and November and are sourced from administrative data originally collected via Migrant Workers Scan (MWS) which is sourced from the HMRC National Insurance and PAYE system (NPS).
Next release: 27 August 2026
Where to find out more
Read previous releases of these statistics.
Read further information for this series, including detail on data sources, uses, quality and limitations of the series.
Statistics on NINo allocations to adult overseas nationals entering the UK are available from Stat-Xplore.
Read about the NINo application process.
9. User engagement
Enquires and feedback
DWP would like to hear your views on our statistical publications. If you use any of our statistics publications, we would be interested in hearing what you use them for and how well they meet your requirements: Send your comments by email to: cbm.stats@dwp.gov.uk.
As detailed on the collection page a public consultation to obtain views on the ongoing value in continuing to publish this statistical series on a quarterly basis closed on 12 May. We will now be reviewing the responses from this consultation and a response will be published in due course.
Contacts
Press enquiries should be directed to the DWP Press Office.
Lead Analyst: MD Akmal Hossain Sadi
Statistics Producer: Darrel Adams
ISBN: 978-1-78659-980-3