National Insurance numbers allocated to adult overseas nationals to March 2023
Published 25 May 2023

© Crown copyright 2023
This publication is licensed under the terms of the Open Government Licence v3.0 except where otherwise stated. To view this licence, visit nationalarchives.gov.uk/doc/open-government-licence/version/3 or write to the Information Policy Team, The National Archives, Kew, London TW9 4DU, or email: psi@nationalarchives.gov.uk.
Where we have identified any third party copyright information you will need to obtain permission from the copyright holders concerned.
This publication is available at https://www.gov.uk/government/statistics/national-insurance-numbers-allocated-to-adult-overseas-nationals-to-march-2023/national-insurance-numbers-allocated-to-adult-overseas-nationals-to-march-2023
This summary contains statistics on National Insurance numbers (NINos) allocated to adult non-UK overseas nationals, covering the period from January 2002 to March 2023.
These Department for Work and Pensions (DWP) statistics show a count, by individual nationality, of the number of NINos registered to adult non-UK nationals, irrespective of the length of stay in the UK. The statistics are not a count of quarterly or annual migration or the number of adult nationals currently residing in the UK. The statistics only show the nationality of the individual at the point of registration.
The narrative in this bulletin focuses on the number of registrations over annual periods of time, rather than quarterly. The benefit of this is that it allows us to focus on trends over longer periods of time, plus, quarterly numbers can often be influenced by seasonal affects and various changes to policy. Both quarterly and annual numbers are available via Stat-Xplore.
Statistical Trends
When observing statistical trends in this release it is helpful to understand the context of world events during the period covered by the statistics. Changing make-up of constituent nation states within the EU, with nations joining the EU, and the UK’s EU exit, as well as global conflicts, impacts of the pandemic and subsequent changes to the travel rules because of government migration policies and COVID-19 have all had an impact on the trends seen in the time series.
1. Main stories
The main stories are:
-
for the year ending (YE) March 2023 there were 1.1 million NINo registrations from non-UK overseas nationals. This compares to 770,000 registrations for the YE March 2022, and is the highest number of registrations since the published figures began in 2002
-
the number of registrations for the YE March 2023 (1.1 million) is higher than pre COVID-19 numbers, when there were 650,000 registrations for the YE March 2019, and 670,000 for the YE March 2018
-
the majority of registrations for the YE March 2023 are from non-EU nationals, 950,000, compared with 140,000 registrations from EU nationals
-
for the YE March 2023, the nationality with the highest number of registrations from non-EU nationals was India with 270,000, followed by Nigeria with 120,000 registrations
-
for the YE March 2023 the nationality with the highest number of registrations from EU nationals was Romania (38,000)
2. What you need to know
This summary contains statistics on NINos allocated to non-UK adult overseas nationals on the date the NINo was registered, covering the period from January 2002 to March 2023.
The two main methods of applying for a NINo are:
-
directly to DWP at the GOV.UK website via Apply for a NINo (AfN)
-
via the Home Office when an application for a visa is made
Apply for a Nino (AfN) is a digital NINo application service where users can apply for a NINo on-line, the service is open 24 hours a day, 7 days a week. For more information on how these processes work see background information and methodology note.
EU groupings used within migration statistics
The following EU groupings are used in the statistics:
-
EU14 (these are the original EU members: Austria, Belgium, Denmark, Finland, France, Germany, Greece, Ireland, Italy, Luxembourg, Netherlands, Portugal, Spain, and Sweden)
-
EU8 (these joined the EU in 2004: Czech Republic, Estonia, Hungary, Latvia, Lithuania, Poland, Slovakia, and Slovenia)
-
EU2 (these joined the EU in 2007: Romania & Bulgaria)
-
EU Other (Croatia, Cyprus, and Malta)
For reporting purposes, other European nationalities not in the EU are labelled ‘other Europe’ and are classified as non-EU. This includes countries such as Ukraine. The full list of country groupings can be found in the data tables ‘World Areas’ sheet.
3. How many people are registering?
Year end (YE) NINo registration numbers for EU and non-EU nationals: to YE March 2023
Source: Stat-Xplore
Note: For more information on time point descriptions, please see background information and methodology note. There is an increased proportion of registrations where the nationality is ‘unknown’ during the period 1st July 2021 to 16th August 2022 due to information not being available in the source data. See background information and methodology note for more detail.
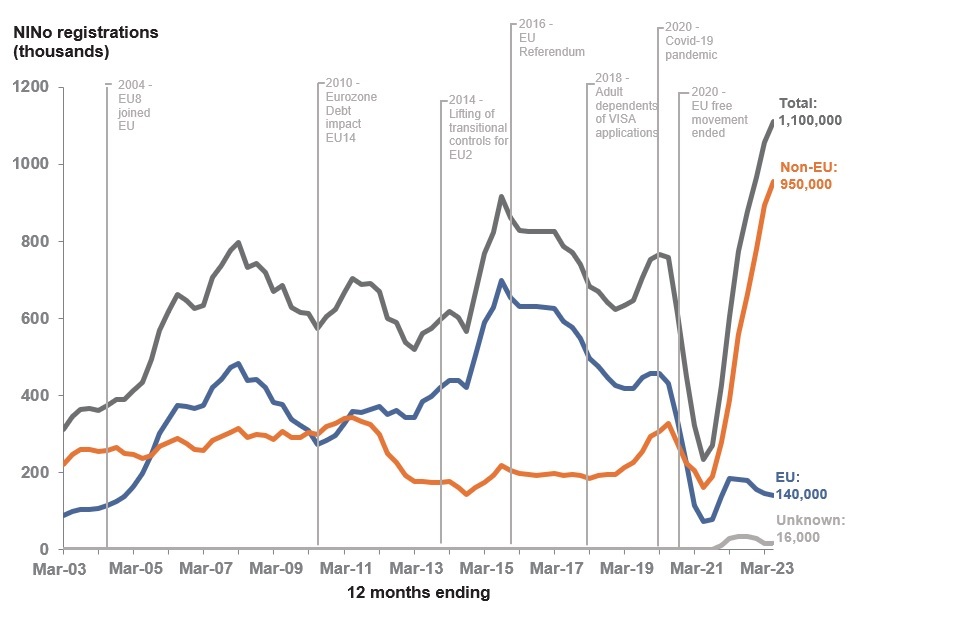
From the beginning of this statistical series (YE January 2002), the number of non-UK overseas NINo registrations fluctuated, but gradually increased to 920,000 registrations at year end (YE) June 2015. Following this peak, numbers gradually declined to 760,000 in March 2020 before falling to a record low at YE March 2021 with 230,000 registrations.
The decrease in registrations since March 2020 was impacted by the COVID-19 pandemic, which introduced increased travel restrictions and the suspension of processing new NINo applications on 8 March 2020.
Since then, numbers have continued to rise, and for YE March 2023 there were the highest number of NINos registered to adult overseas nationals annually, with 1.1 million NINos registered. This compares to 770,000 registrations the previous YE March 2022
The majority of registrations for YE March 2023 were from non-EU nationals at 950,000 (86%) compared to 140,000 (13%) from EU nationals. The remaining 16,000 (1%) were from unknown nationalities. The majority of registrations for YE March 2022 were also from non-EU nationals at 560,000 (72%) compared with 180,000 (24%) from, EU nationals, and 34,000 (4%) unknown. This trend was similar for the previous YE March 2021 with 160,000 (69%) from non-EU nationals, compared to 72,000 (31%) registrations from EU Nationals.
It is important to note the differing restrictions to NINo applications for EU and non-EU nationals during the COVID-19 pandemic. Registrations from non-EU nationals were less severely impacted, as postal applications were reinstated from late April to May 2020, whereas EU nationals could not apply until the latter of 2020, as a result of COVID-19 restrictions disrupting face-to-face services. See the background information and methodology note for more information.
Prior to this, since YE September 2005, NINo registrations from EU nationalities were always in the majority apart from a short period in YE 2010, when non-EU nationalities had slightly more registrations than EU.
Several things may have contributed to these changing trends, for example, the transition of the UK leaving the EU and EU nationals being subject to visa restrictions may have impacted numbers of EU nationals registering. In addition, the UK providing ongoing support for Ukrainian nationals and others requiring protection may have contributed to the increase of registrations from non-EU nationals.
4. Where in the world are people registering from?
Percentage of NINo registrations by EU/non-EU nationality group: Year ending (YE) March 2019 to March 2023
Source: Stat-Xplore
Note: There is an increased proportion of registrations where the nationality is ‘unknown’ during the period 1st July 2021 to 16th August 2022 due to information not being available in the source data. See background information and methodology note for more detail. Graph percentages may not round to 100% as they are calculated based on the figure for each nationality group and are subsequently rounded to the nearest whole number.
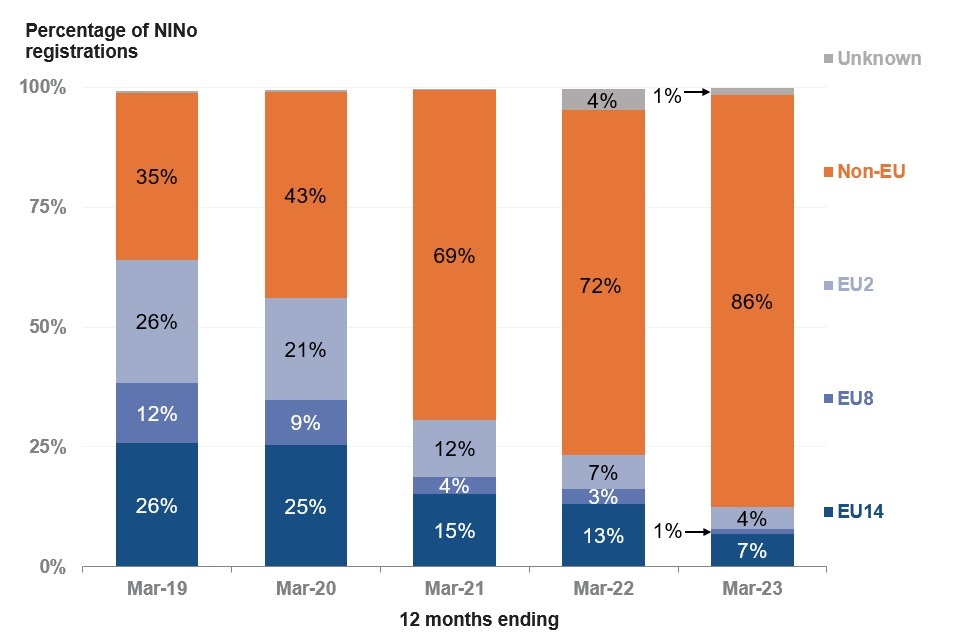
The proportion of non-EU NINo registrations has been steadily increasing over recent years. For YE March 2023 86% of NINos registered from overseas nationals were from non-EU nationals, an increase of 14 percentage points on YE March 2022 and 51 percentage points greater than YE March 2019.
The proportion of NINo registrations from EU nationals (from all EU subgroups) has fallen in recent years to 13% for YE March 2023, a fall of 11 percentage points since YE March 2022 and 52 percentage points since YE March 2019.
The steady fall of EU NINo registrations since YE March 2019 is evident in all EU groups with EU2 having the greatest percentage point fall by 22 percentage points, EU14 falling by 19 percentage points and EU8 by 11 percentage points.
5. EU NINo Registrations
NINo registration numbers by EU nationality group: to YE March 2023
Source: Stat-Xplore.
Note: For more information on time point descriptions, please see background information and methodology note.
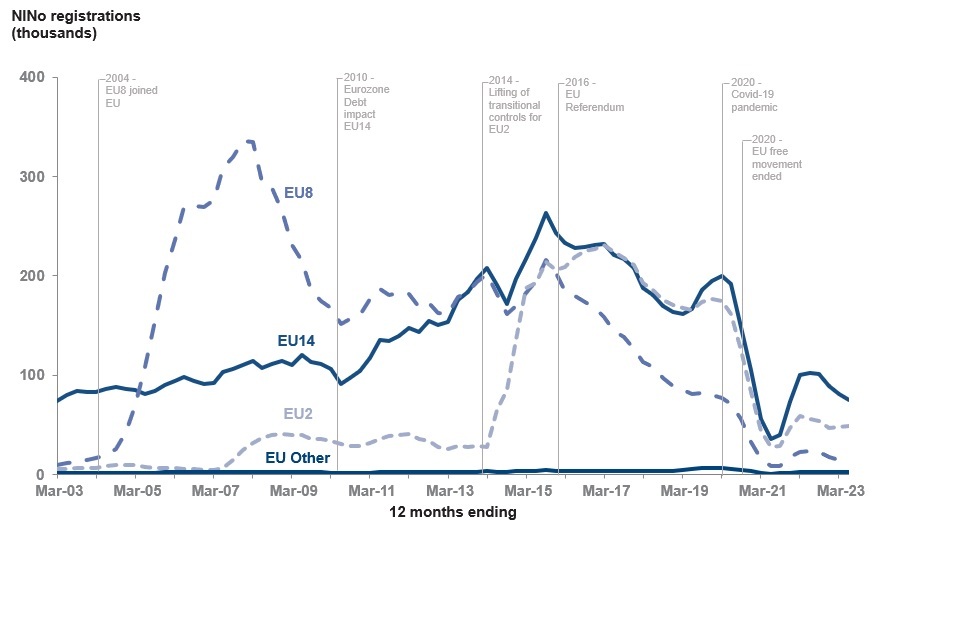
Registrations from EU14 nationalities gradually increased from 2002 until they peaked at 260,000 in YE June 2015, before declining to 160,000 in YE December 2018, following the EU Exit referendum in June 2016. Numbers then began to increase slightly until YE March 2020, but then declined rapidly until YE March 2021 (35,000), impacted by COVID-19 restrictions. Since then, registrations from EU14 nationalities increased slightly to 100,000 at YE March 2022 but have since fallen to 75,000 at YE March 2023. The EU14 group has had the largest number of registrations of all the EU groups since YE March 2019.
Registrations from EU8 nationalities drove the sharp rise in EU NINo registrations in 2004, when countries from the EU8 joined the EU. EU8 registrations peaked for the YE September 2007 to 340,000 registrations, after which numbers declined until YE March 2010 to 150,000. After a period of volatility EU8 registrations have again generally declined since the EU Exit referendum in 2016, to 8,500 registrations for YE March 2021, also impacted by COVID-19 restrictions. Since then, numbers have increased slightly to 23,000 for YE March 2022, but have since fallen to 13,000 registrations for YE March 2023.
Registrations from EU2 nationals were relatively low until the removal of restrictions on work for EU2 citizens drove the sharp rise in EU registrations in 2014. Some of this reflected individuals who were residing in the UK prior to 2014 and would only have been able to register for a NINo after that date (see arrival to registration analysis on EU2 nationals for more information). EU2 registrations peaked in the YE December 2016, with 230,000 registrations, then declined until YE March 2019 (170,000), followed by a small increase until YE March 2020, at which registrations then declined steeply, affected by COVID-19 restrictions, until YE March 2021 (28,000). Recently registrations have increased slightly to 49,000 for YE March 2023.
NINo registrations from EU ‘other’ have remained consistently low throughout the timeseries and there were only 2,300 registrations for YE March 2023.
Percentage of EU Registrations by EU nationality group: Year ending (YE) March 2019 to YE March 2023
Source: Stat-Xplore
Note: Graph percentages may not round to 100% as they are calculated based on the figure for each nationality group and are subsequently rounded to the nearest whole number.
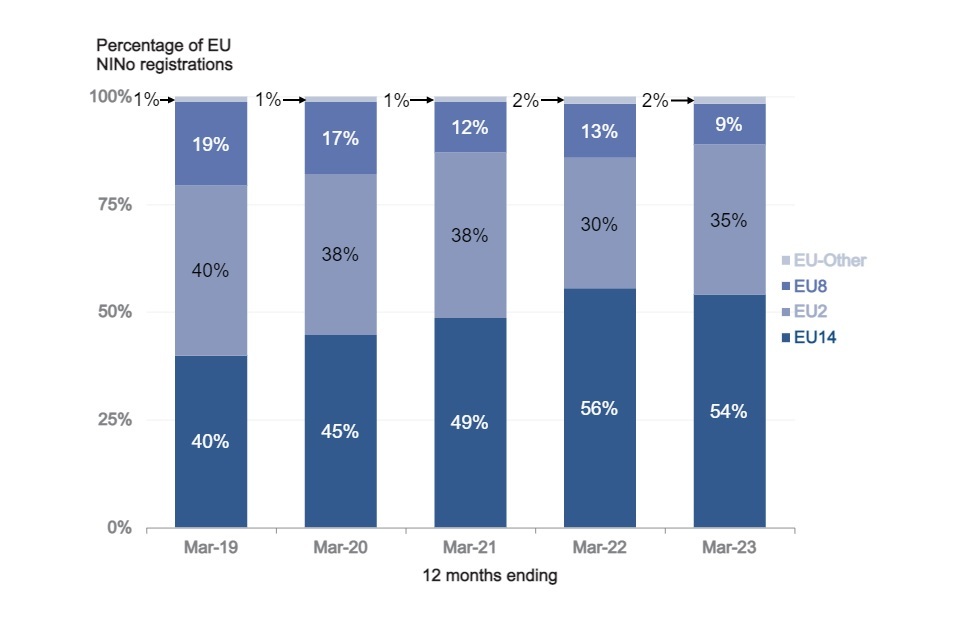
In general, although the overall number of EU NINo registrations has fallen across all EU groups in the last five years (420,000 for YE March 2019 to 140,000 for YE March 2023), affected by the EU Exit and COVID-19 restrictions, the proportions of those registering by each EU group has also changed over this period of time:
Most registrations from EU nationals for YE March 2023 were from nationalities in the EU14 subgroup (54%). The proportion of all EU registrations made up by EU14 registrations has increased over the last 5 years with a rise of 14 percentage points since YE March 2019. However, the overall number of nationals registering from EU14 nations has more than halved in this period, from 170,000 for YE March 2019 to 75,000 for YE March 2023.
Registrations from nationalities in the EU2 group have the second highest proportion of registrations of all the EU groups for YE March 2023 (35%), however this is a decrease in proportion by 5 percentage points since YE March 2019.
Registrations from EU8 account for 9% of EU registrations for YE March 2023. The registrations in this group have decreased by 10 percentage points since YE March 2019.
Registrations from EU ‘other’ remain very low and account for only 2% of EU registrations for YE March 2023.
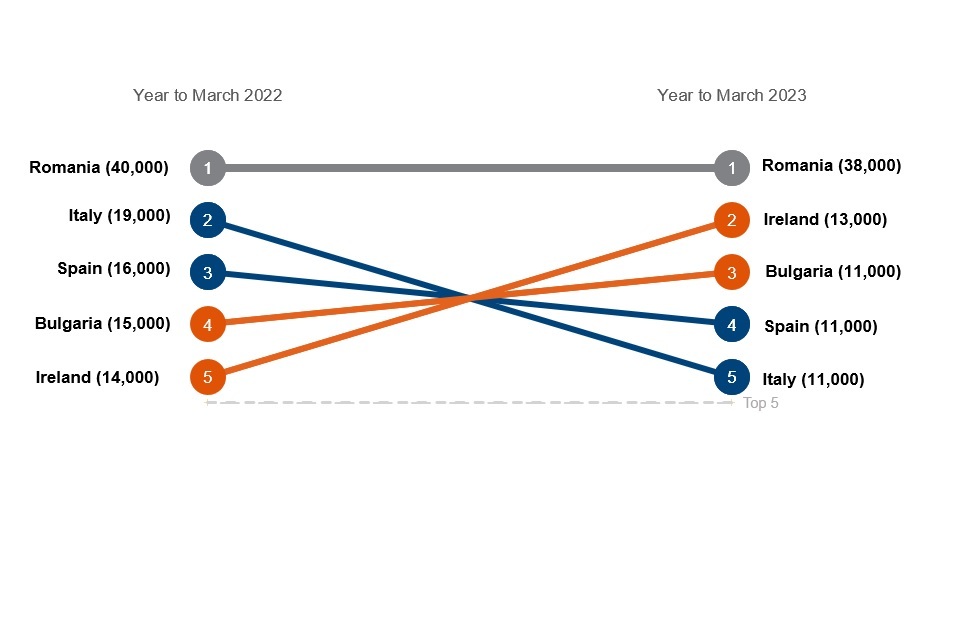
Top five EU nationalities by number of registrations for year ending (YE) March 2022 and YE March 2023.
Source: Stat-Xplore
Each nationality, in the top five EU nationalities for YE March 2023 shows a reduced number of NINo registrations when compared to figures from YE March 2022.
For YE March 2023, Romania remained the EU nationality with the highest number of registrations (38,000), however had fallen by 2000 registrations since a year earlier, when the number of registrations was 40,000 for YE March 2022.
The number of registrations from the second to fifth highest countries are very similar and range between 11,000 and 13,000 for YE March 2023.
Registrations from those with an Irish nationality had the second highest number of registrations (13,000) for YE March 2023 and has decreased in registrations since the previous year to date (YE March 2022), where it had the fifth highest number of EU registrations (14,000).
For YE March 2023 NINo registrations from Bulgarian nationals were the third highest at 11,000. For YE March 2022 Bulgarian nationals had the fourth highest number of registrations at 15,000.
For YE March 2023 those with a Spanish nationality had fourth highest number of registrations (11,000) followed by Italian nationals (11,000).
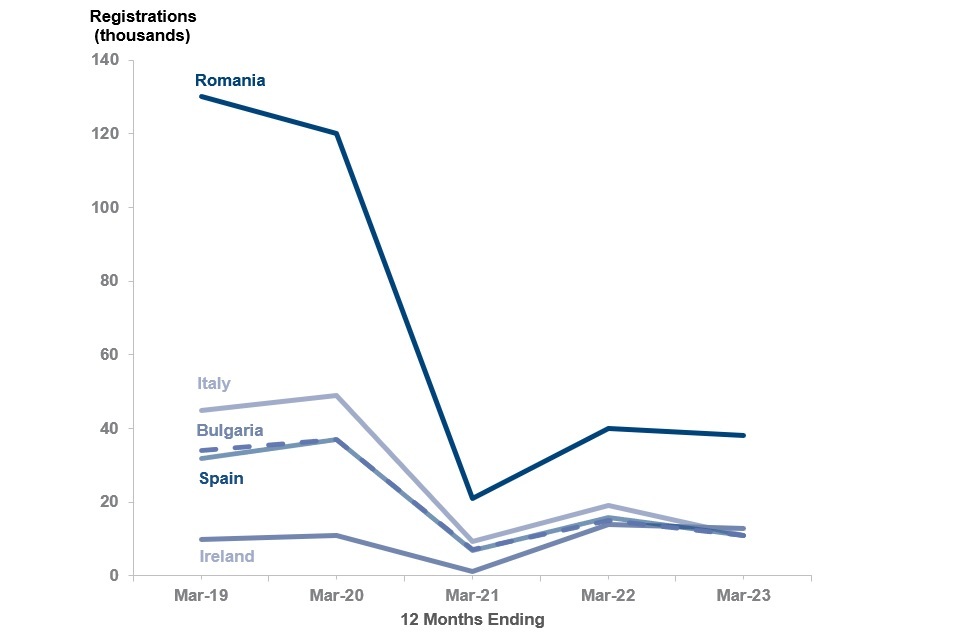
Timeseries showing numbers of NINo registrations for the top five EU nationalities: Year ending (YE) March 2019 to YE March 2023
Source: Stat-Xplore
Figures for the top five EU nationalities since 2019 show that despite a fall in numbers from 130,000 in YE March 2019 to 38,000 for YE March 2023, Romania remained the EU nationality with the highest number of NINo registrations for YE March 2023.
Irish nationals, the second highest group of registrations for YE March 2023 (13,000) - is the only nationality to have had an overall increase in registrations since YE March 2019, increasing from 10,000 at YE March 2019.
Bulgarian nationals had the third highest numbers of EU registrations for YE March 2023 at 11,000, falling from 34,000 at YE March 2019.
Spanish registrations were the fourth highest nationality for YE March 2023 at 11,000, decreasing from 32,000 at YE March 2019.
Italian registrations were the fifth highest at YE March 2023 at 11,000, a fall from 45,000 at YE March 2019.
6. Non-EU registrations
Registrations from non-EU nationals were less severely impacted by disruptions to NINo services than registrations from EU nationals during the COVID-19 pandemic. The postal process for NINo applicants with a valid work visa, issued prior to their arrival in the UK, was suspended in March 2020. For Home Office postal applications (non-EU nationals) processing of applications was reinstated in late April and May 2020, whereas the processing of all other applications (non-EU and EU nationals) including 53,000 parked applications awaiting a decision prior to suspension, were not reinstated until June 2020.
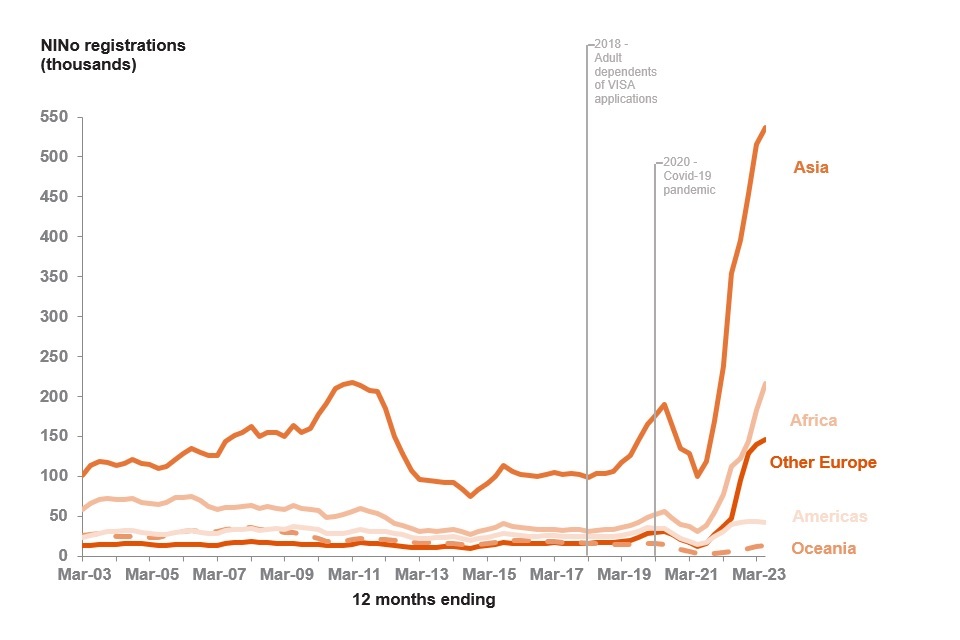
NINo registration numbers by non-EU nationality group: to YE March 2023.
Source: Stat-Xplore
Note: For more information on time point descriptions, please see background information and methodology note.
Registrations from all non-EU nationalities were impacted by the COVID-19 pandemic, with a decrease to 160,000 for YE March 2021. Since then, numbers of registrations across all non-EU groups have increased rapidly to 950,000 for YE March 2023.
Since 2002 NINo registrations from Asian nationals have always been the highest of all the non-EU groups, peaking at YE December 2010 with 220,000, but then declined until an overall low of 75,000 for YE June 2014. Registrations then remained stable until YE December 2018 before gradually increasing to 190,000 at YE March 2020. Registrations fell to 100,000 for YE March 2021, impacted by COVID-19, but have since increased to 540,000 for YE March 2023.
Registrations from African nationals remained relatively stable before peaking in YE March 2006 with 74,000 registrations, after which the number of registrations continued to decline until the YE June 2014, when they fell to 27,000. Registrations from Africa were then stable, until they started to increase from YE December 2018 to reach 56,000 in YE March 2020 before falling to 31,000 at YE March 2021. Numbers of registrations have since risen to 220,000 at YE March 2023.
Registrations from the Americas have always been relatively low and stable but after a very gradual increase for YE March 2009 to 36,000 registrations, numbers then gradually fell to 20,000 for YE June 2014. The number of registrations then remained relatively stable, but gradually increased to 35,000 for YE September 2019, before falling to 14,000 in YE March 2021, impacted by COVID-19. Since then, numbers of registrations have risen to 42,000 at YE March 2023.
Similarly, registrations from Oceania have always remained low and peaked in YE September 2007 at 35,000. Since then, numbers have remained fairly stable, but gradually fell to 2,900 in YE June 2021, impacted in the latter year by COVID-19. Since then, registrations have risen slightly to 13,000 in YE March 2023.
Registrations from European nationalities not a part of the EU (Other Europe), have remained relatively low and stable until YE March 2018 when, for the first time, they had more registrations than Oceania at 17,000 compared with 16,000 for Oceania. Registrations then increased to 31,000 in YE March 2020, before falling to 12,000 in YE March 2021. Registrations have since increased steeply and for YE March 2023 there were 150,000 registrations. This is mostly due to increased registrations from Ukrainian nationals.
It should be noted that the noticeable increase in registrations from non-EU nationals after September 2018 until the beginning of 2020, is mostly due to registration for a NINo of adult dependants as part of certain visa approvals. See the background information and methodology note for more information.
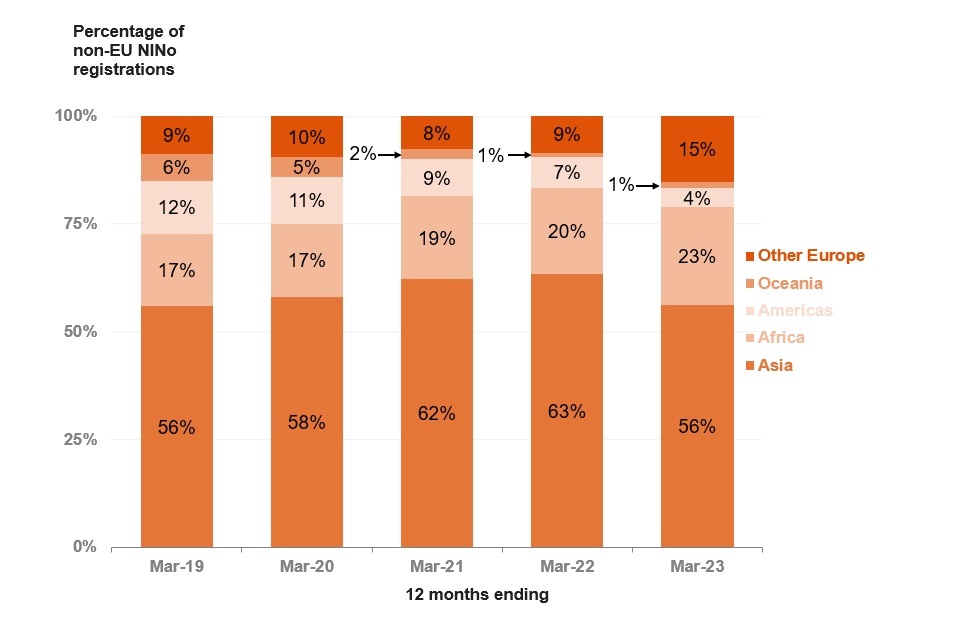
Percentage of non-EU registrations by non-EU nationality group: to YE March 2023
Source: Stat-Xplore
Note: Graph percentages may not round to 100% as they are calculated based on the figure for each nationality group and are subsequently rounded to the nearest whole number.
In general, numbers of registrations from non-EU nationalities have increased over the last five years to 950,000 registrations for YE March 2023 from 230,000 for YE March 2019. Comparison of the subgroups for non-EU nationalities shows there has only been slight changes in the proportions for each of the non-EU subgroups over the last five years.
Registrations by Asian nationals remain the non-EU group with the largest proportion of NINo registrations for YE March 2023 (56%), the same proportion it was for the YE March 2019.
African nationals have the next highest proportion at 23% YE March 2023 An increase of 6 percentage points since YE March 2019.
Proportions have steadily increased since YE March 2019 (9%) for ‘other Europe’ and this group now has the third highest percentage of registrations for YE March 2023 at 15%.
Americas registrations are the fourth highest group of non-EU registrations, with only 4% for YE March 2023. There has been a steady fall in proportion since YE March 2019 when the percentage of registrations was 12%.
There has also been a fall of registrations for Oceania, the fifth highest group, from 6% for YE March 2019. After an all-time low of 2,900 in YE June 2021, the number of registrations for Oceania has since been steadily rising, however this group has the lowest proportion of NINos registered for all non-EU groups in YE March 2023 at only 1%.
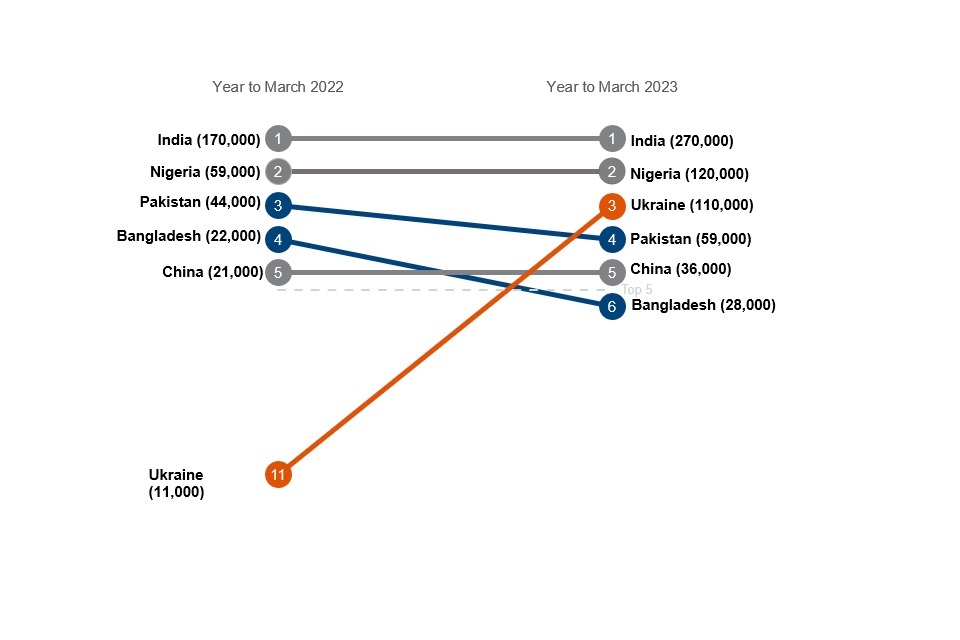
Top five non-EU nationalities by number of registrations for year ending (YE) March 2022 and YE March 2023
Source: Stat-Xplore
Figures for the top five non-EU nationalities for YE March 2023 show the nationality with the highest number of NINo registrations remained India at 270,000, increasing from 170,000 registrations for YE March 2022.
Nigerian registrations were the second highest nationality for non-EU registrations, at 120,000 for YE March 2023, increasing from 59,000 for YE March 2022, at which they were also second highest.
The third highest NINo registrations from non-EU nationalities for YE March 2023 were from Ukrainian nationals with 110,000, a 10-fold increase from 11,000 for YE March 2022 when they were eleventh highest.
Pakistan had the fourth highest number of non-EU registrations for YE March 2023 (59,000), an increase from 44,000 for YE March 2022 (when they were the third highest).
The non-EU nationality with the fifth highest number of NINo registrations was China with 36,000 registrations, in comparison to 21,000 for YE March 2022, when they were also fifth highest.
It is worth noting that the chart above does not take into account those that have registered for a NINo with a British Nationals Overseas (BNO) Nationality as they are treated as unknown in the data, due to there not being a category in the MWS to record this Nationality. See the background information and methodology note for more information.
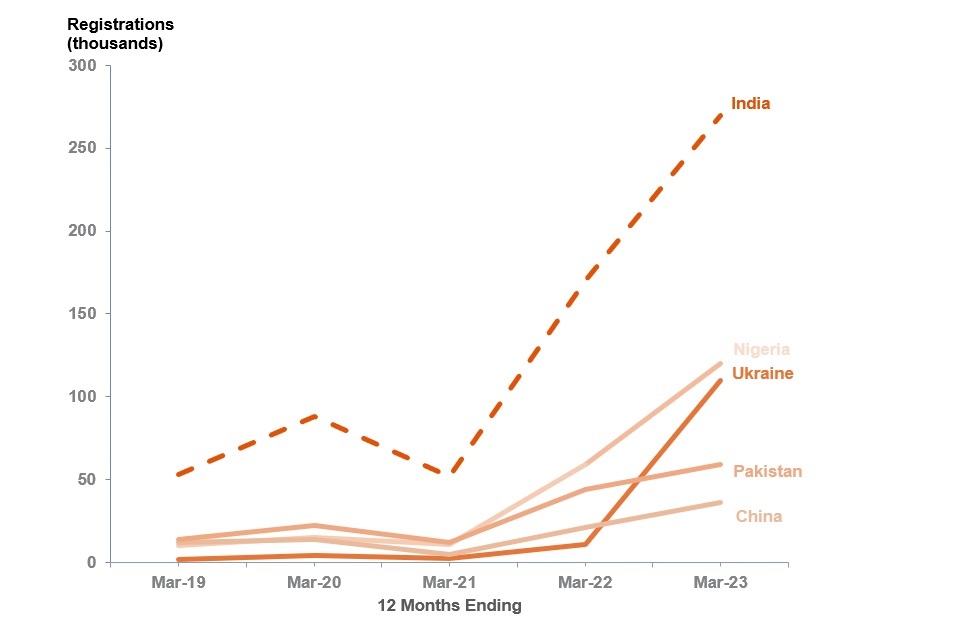
Timeseries showing numbers of NINo registrations for the top five non-EU nationalities: Year ending (YE) March 2019 to YE March 2023
Source: Stat-Xplore
Figures for the top five non-EU nationalities since 2019 show that for YE March 2023 India had the highest number of registrations at 270,000, increasing from 53,000 for YE March 2019.
Nigeria had the next highest number of registrations for YE March 2023 at 120,000, an increase from 10,000 for YE March 2019.
Ukraine had the third highest number of registrations with 110,000 for YE March 2023, a steep increase from 1,700 for YE March 2019.
Pakistan had the fourth highest number of registrations at 59,000 for YE March 2023 an increase from 14,000 for YE March 2019. China had the lowest number of top five non-EU registrations for YE March 2023 at 36,000, an increase from 12,000 for YE March 2019.
7. Where in the UK are people registering?
Numbers of NINo registrations by region and non-EU/EU groups for the year ending (YE) March 2023
| Region | non-EU | EU |
|---|---|---|
| London | 270,000 | 48,000 |
| South East | 110,000 | 13,000 |
| West Midlands | 88,000 | 12,000 |
| North West | 78,000 | 10,000 |
| East of England | 70,000 | 11,000 |
| Scotland | 59,000 | 6,400 |
| East Midlands | 59,000 | 9,000 |
| Yorkshire and the Humber | 57,000 | 7,000 |
| South West | 47,000 | 5,300 |
| Wales | 26,000 | 1,800 |
| North East | 25,000 | 1,700 |
| Northern Ireland | 11,000 | 3,100 |
| Overseas | 45,000 | 10,000 |
| Unknown | 8,800 | 1,200 |
Source: Stat-Xplore
Note: Overseas indicates registrations which were obtained via Home Office Visa scheme prior to arrival in UK. Geography information is based on address given at time of NINo registration. There is an increased proportion of registrations where the nationality is ‘unknown’ during the period 1st July 2021 to 16th August 2022 due to information not being available in the source data. See background information and methodology note for more detail.
In the YE March 2023, the number of registrations from non-EU nationals was greater than registrations from EU nationals (950,000 compared with 140,000) and this was reflected across all regions. It is important to acknowledge that registrations from non-EU nationals were less severely impacted by restrictions to NINo services during the COVID-19 pandemic than registrations from EU nationals. See background information and methodology note for more information.
A high percentage (43%) of all registrations with a known UK address at the time of registration for YE March 2023 resided in London or the South East regions at the time of NINo registration.
The region with the highest number of NINo registrations was London with 270,000 non-EU registrations and 48,000 EU registrations.
The South East region had the second highest number of registrations with 110,000 non-EU and 13,000 EU.
Top 10 Local Authorities by number of NINo registrations for the year ending (YE) March 2023
| Local Authorities | Registrations |
|---|---|
| Birmingham | 33,000 |
| Newham | 28,000 |
| Manchester | 21,000 |
| Tower Hamlets | 19,000 |
| Brent | 18,000 |
| Coventry | 18,000 |
| Leicester | 18,000 |
| Ealing | 17,000 |
| Glasgow City | 16,000 |
| Leeds | 16,000 |
Source: Stat-Xplore
Note: Geography information is based on address given at time of NINo registration.
The local authority with the highest number of registrations for YE March 2023 was Birmingham with 33,000. Newham had the second highest registrations with 28,000 then Manchester with 21,000.
8. About these statistics
Re-designation of National Statistics status
The UK Statistics Authority re-designated these statistics as National Statistics, in November 2020. For more information see the background information note.
EU exit
This statistical release covers the period until 31 December 2022. The Immigration and Social Security Co-ordination (EU Withdrawal) Act 2020 ended free movement between the EU and the UK on 31 December 2020 and the Future Relationship treaty came into force, launching the new Points Based Immigration System. Read the background information note for further information on the EU Exit.
What can you use these figures for?
The statistics provide:
-
a 100% count of non-UK overseas nationals registered for a NINo
-
Stat-Xplore allows users to tabulate NINo registrations for each quarter and Year End Nino registrations (for each quarter)
-
the focus of this publication is on NINo registrations for Year End (YE)
-
the nationality of non-UK overseas nationals at the time of registering
-
the geographical location of the non-UK overseas nationals at the time of registering
What you cannot use these figures for
The statistics cannot be used as a count of:
-
quarterly or annual migration to the UK
-
the number of non-UK overseas nationals who have started work or are currently in work
-
the number of non-UK overseas nationals who are currently in the UK
The statistics show the number of people registered for a NINo in order to work or to claim benefits and tax credits and are one of a number of supplementary measures produced by government of in-migration to the UK.
Although quarterly registration figures are provided in the accompanying data tables, care should be taken when interpreting quarterly changes as they might reflect changes in operational activity. Annual year-on-year changes are more reliable to reflect longer-term trends.
The statistics are published as part of the scheduled timetable for the release of cross-Government migration statistics.
Read the background information and methodology note for further information, including detail on uses and limitations of the series.
Comparisons with other sources of migration
NINo statistics are not a direct measure of long-term migration and therefore are not directly comparable with Office for National Statistics (ONS) long-term estimates of immigration.
Transformation of migration statistics
Following the suspension of the international Passenger Survey (IPS) as a result of the COVID-19 pandemic, the ONS is in the process of developing international migration statistics based on alternative administrative data sources. The first iteration of these new Admin-Based Migration Estimates (ABMEs) were published on 16 April 2021. More information on the progress made and timelines can be found in “Population and migration statistics system transformation – recent updates”.
Change to methodology for assigning geographies
Since the February 2023 release, the statistical method for assigning geographies has been improved. For more information on how geographies are assigned see background information and methodology note
Rounding policy
Numbers in this bulletin have been rounded as detailed in the background information and methodology note. Percentage changes are calculated prior to rounding and then are rounded to the nearest whole number. As all figures within this bulletin have been rounded, therefore they may not sum to totals.
Due to rounding and the inclusion of unknown nationalities in the total, the total figure could differ from the sum of EU and non-EU.
World Areas
For reporting purposes, countries have been grouped into ‘world areas’ based primarily on geographical location. Countries are grouped according to current world area status for the entire back series.
| World Area | Sub-Group |
|---|---|
| European Union (EU) | European Union EU14 (original EU members), European Union EU8 (joined EU in 2004), European Union EU2 (joined EU in 2007), European Union Other |
| Non-European Union (Other Europe) | Other Europe |
| Asia | Middle East and Central Asia, East Asia, South Asia, South East Asia |
| Africa | Sub-Saharan Africa, North Africa |
| Americas | North America, Central and South America |
| Oceania | Oceania |
A detailed nationality breakdown for each world area is available in the supplementary data tables accompanying this release.
Release schedule
The statistics are published quarterly in February, May, August, and November and are sourced from data originally collected via Migrant Workers Scan (MWS) administrative system.
Next release: 24 August 2023
Where to find out more
Read previous releases of these statistics.
Read further information for this series, including detail on data sources, uses, quality and limitations of the series.
Statistics on NINo allocations to adult overseas nationals entering the UK are available from Stat-Xplore.
Read about the NINo application process.
9. User engagement
Enquires and feedback
DWP would like to hear your views on our statistical publications. If you use any of our statistics publications, we would be interested in hearing what you use them for and how well they meet your requirements: Send your comments by email to: cbm.stats@dwp.gov.uk
NINo registrations Stat-Xplore proposed presentational changes
We are looking to make presentational improvements to the Stat-Xplore tabulation options for the NINo Registrations data which accompanies this statistical release to make it easier for users to view and choose what time periods they want to tabulate and would like to hear your views. It is important to note that no changes will be made to the data itself that is currently published, only to the options of how it is structured to facilitate tables.
Issue with how breakdown options currently displayed: Currently users can choose to tabulate either year end (YE) or quarterly tables, but the ordering of the breakdowns and fact that the quarterly breakdowns are nested within the YE option makes it not very easy for users to understand what the latest data is and how to table it. Unfortunately, the YE ordering option can’t be changed to display the latest YE option at the top, as this would have made it more intuitive.
Option 1: remove the option to tabulate YE breakdowns and replace with one stand-alone list of all quarterly breakdowns. Users can then still select the quarterly or YE figures, by selecting the quarters they require within the time-period they want to view:
-
the advantage of this is that users can easily view which is the latest quarterly data available and will see a more simple view of breakdown options to help them produce tables
-
disadvantage is that users would need to select each quarter to tabulate YE figures
Option 2: make two tabling options visible on Stat-Xplore - one which will allow users to choose from a stand-alone list of quarterly breakdowns (not nested within YE breakdowns), as well as a separate stand-alone list of YE breakdowns. So removing the quarter option nested within the YE category which is how it is currently presented:
-
the advantage of this is that users would still have the ability to pick quarterly or YE tabling options, but the quarterly options would not be nested within the YE options but would be displayed as two separate breakdown lists. Users would be able to view more easily the latest data held by viewing the latest quarterly breakdown
-
disadvantage is that having two Stat-Xplore tabulation options could appear more confusing to users as there would be two methods available to tabulate the same tables
Our preferred option is Option 1 as we think it will:
-
enable users to see more clearly what are the latest quarterly figures
-
still give users the ability to tabulate any time periods they want to produce figures for
-
make Stat-Xplore tabulation page more simple which will help users produce the tabulations and time periods they require
Please send any views by email to cbm.stats@dwp.gov.uk by 10 July 2023
Contacts
Press enquiries should be directed to the DWP Press Office, telephone: 0203 267 5144.
Lead Analyst: Kate Walker
Enquiries about these statistics should be directed by email to: cbm.stats@dwp.gov.uk
ISBN: 978-1-78659-513-3