National Insurance numbers allocated to adult overseas nationals to December 2019
Updated 7 May 2020

© Crown copyright 2020
This publication is licensed under the terms of the Open Government Licence v3.0 except where otherwise stated. To view this licence, visit nationalarchives.gov.uk/doc/open-government-licence/version/3 or write to the Information Policy Team, The National Archives, Kew, London TW9 4DU, or email: psi@nationalarchives.gov.uk.
Where we have identified any third party copyright information you will need to obtain permission from the copyright holders concerned.
This publication is available at https://www.gov.uk/government/statistics/national-insurance-numbers-allocated-to-adult-overseas-nationals-to-december-2019/national-insurance-numbers-allocated-to-adult-overseas-nationals-to-december-2019
The latest release of these statistics can be found in the collection of National Insurance number allocations statistics.
This summary contains statistics on National Insurance numbers (NINos) allocated to adult overseas nationals, covering the period from January 2002 to December 2019.
A National Insurance number (or NINo) is generally required by any adult overseas national looking to work or claim benefits and tax credits in the UK.
These Department for Work and Pensions (DWP) statistics show a count, by individual nationality, of the number of NINos registered to adult non-UK nationals each quarter, irrespective of the length of stay in the UK. The statistics are not a count of the number of adult non-UK nationals currently residing in the UK.
1. Main stories
766,000 NINos were registered in the year to December 2019: a 21% increase on the year to December 2018. Although the majority of registrations continued to be from European Union (EU) nationals, the increase in registrations in the year to December 2019 was mostly the result of the increase of registrations by nationals from Non-EU countries.
EU registrations increased by 38,000 in the year to December 2019: a 9% increase on the previous year. This change was mostly the result of the increase of registrations by nationals from Italy, Spain, Portugal and Bulgaria, despite a decrease in registrations of nationals from Poland.
Non-EU registrations increased by 95,000 in the year to December 2019: a 45% increase on the previous year. This change was mostly the result of the increase of registrations by nationals from India, Pakistan, Nigeria, Ghana, and the United States.
2. What you need to know
This summary contains statistics on NINos allocated to adult overseas nationals, covering the period from January 2002 to December 2019.
These statistics are designated as Official Statistics.
What can you use these figures for?
The statistics provide:
- a 100% count of foreign nationals registered for a NINo in a quarter
- the nationality of foreign nationals at the time of registering
- where the foreign nationals registered
What you cannot use these figures for
The statistics cannot be used as a count of:
- quarterly or annual migration to the UK
- the number of foreign nationals who have started work or are currently in work
- the number of foreign nationals who are currently in the UK
The statistics show the number of people registered for a NINo in order to work or to claim benefits and tax credits and are one of a number of supplementary measures produced by government of in-migration to the UK.
Although quarterly registration figures are provided in the accompanying data tables, care should be taken when interpreting quarterly changes as they might reflect changes in operational activity. Annual year-on-year changes are more reliable to reflect longer-term trends.
The statistics are published as part of the scheduled timetable for the release of cross-Government migration statistics. The Migration Statistics Quarterly Report (MSQR) is a summary of the quarterly releases of official international migration statistics by the Office for National Statistics (ONS).
Read the background information note for further information, including detail on uses and limitations of the series.
Comparisons with other sources of migration
NINo statistics are not a direct measure of long term migration and therefore are not directly comparable with ONS long-term estimates of immigration.
On 7 March 2016, the ONS published an information note explaining the reasons why long-term international immigration figures from the International Passenger Survey (IPS) could differ from the number of NINo registrations.
This was followed by an analytical paper presenting analysis that has been undertaken across government to help understand why the two series are showing different trends, with focus on EU migration.
EU groupings used within migration statistics
The following EU groupings are used in the statistics:
- EU15 (these are the original EU members: Austria, Belgium, Denmark, Finland, France, Germany, Greece, Ireland, Italy, Luxembourg, Netherlands, Portugal, Spain and Sweden)
- EU8 (these joined the EU in 2004: Czech Republic, Estonia, Hungary, Latvia, Lithuania, Poland, Slovakia and Slovenia)
- EU2 (these joined the EU in 2007: Romania & Bulgaria)
- EU Other (Croatia, Cyprus and Malta)
For reporting purposes, countries have been grouped into ‘World Areas’ based primarily on geographical location.
Rounding policy
The numbers and changes of registrations are rounded to the nearest 1,000 except for Figure 11b where they are rounded to the nearest 100 for values greater than 50 and less than 1,000, and to the nearest 10 for values less than 50. All changes are calculated prior to rounding. Percentage changes are calculated prior to rounding and then are rounded to the nearest whole number.
3. How many people are registering?
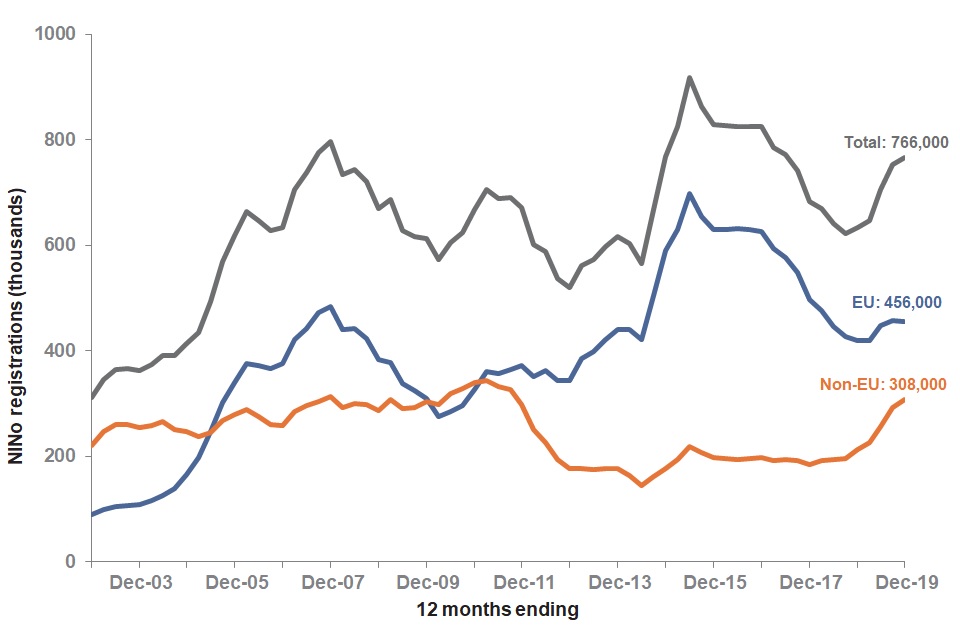
Figure 1: The number of NINo registrations to December 2019
Source: NINo statistics data tables.
766,000 NINos were registered in the year to December 2019: a 21% increase on the year to December 2018. Although the majority of registrations continued to be from EU nationals, the increase in registrations in the year to December 2019 was mostly the result of the increase of registrations by nationals from Non-EU countries.
This increase mostly reflects the inclusion of adult dependants of Non-EU nationals as a part of certain visa approvals. This process was introduced in September 2018.
4. Where in the world are people registering from?
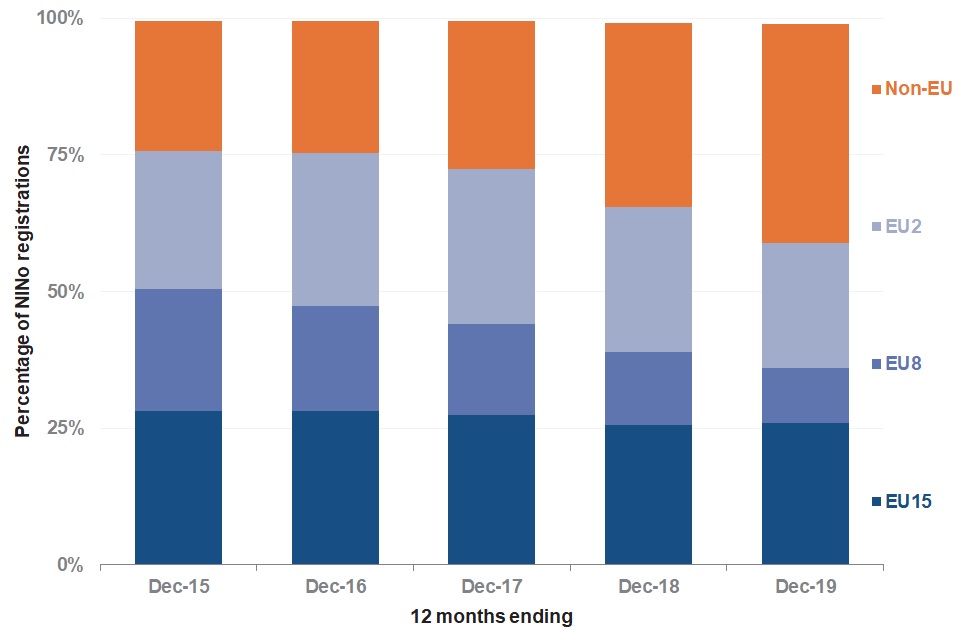
Figure 2: Percentage of NINo registrations by Non-EU and EU subgroups over the 5 years to December 2019
Source: NINo statistics data tables.
Figure 3: NINo registrations in the year to December 2019, change from previous year and annual percentage change
| World Area | Registrations to Dec 2018 | Registrations to Dec 2019 | Change from previous year | Annual Percentage Change |
|---|---|---|---|---|
| EU | 419,000 | 456,000 | +38,000 | +9% |
| Non-EU | 213,000 | 308,000 | +95,000 | +45% |
| Total* | 633,000 | 766,000 | +133,000 | +21% |
Note: * The total also includes registrations of individuals whose nationality is Unknown, as such it will be greater than the sum of EU and Non-EU.
Both registrations from EU and Non-EU nationals increased year on year. The increase for Non-EU nationals was far greater, with a 45% increase, compared to a 9% increase in registrations from EU nationals in the same period. This has driven a relative change in the balance of EU and Non-EU national registrations. While registrations from EU nationals remain the majority of registrations, EU registrations now account for 60% of registrations in the year to December 2019, compared with 66% of registrations in the year December 2018.
4.1. Long term trends and changes in EU Registrations
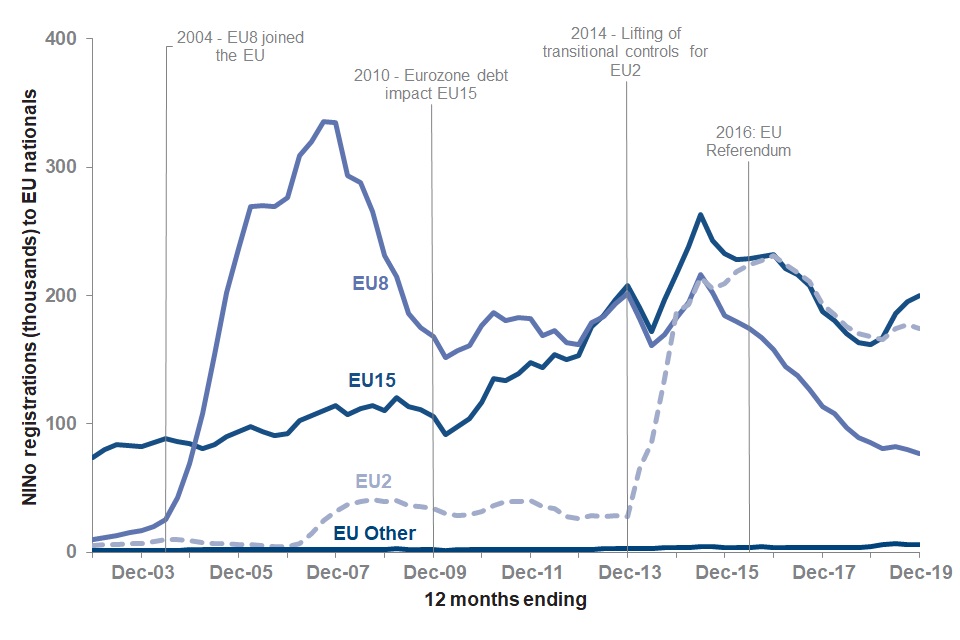
Figure 4: Number of NINo registrations by EU subgroups to December 2019
Source: NINo statistics data tables.
Registrations to EU8 citizens drove the sharp rise in EU NINo registrations in 2004, when countries from the EU8 joined the EU. EU8 registrations peaked in the year ending September 2007 (with 336,000 registrations accounted for 71% of EU registrations), after which declined until the year ending March 2010. After a period of volatility EU8 registrations have again declined since the EU referendum.
Registrations to EU2 nationals were relatively low until the removal of restrictions on work for EU2 citizens drove the sharp rise in EU registrations in 2014. Some of this reflected individuals who were residing in the UK prior to 2014 and would only have been able to register for a NINo after that date (arrival to registration analysis on EU2 nationals for more about this.) EU2 registrations peaked in the year to December 2016 (with 231,000 registrations accounted for 37% of EU registrations) and have declined since.
Registrations from EU15 countries gradually increased from June 2003 until they peaked in the year ending June 2015 (with 263,000 registrations accounted for 38% of EU registrations), and have generally declined since the referendum in June 2016.
Figure 5: NINo registrations by EU sub-group in the year to December 2019, change from previous year and annual percentage change
| EU sub-group | Registrations to Dec 2018 | Registrations to Dec 2019 | Change from previous year | Annual Percentage Change |
|---|---|---|---|---|
| EU15 | 162,000 | 200,000 | +38,000 | +23% |
| EU8 | 85,000 | 77,000 | -8,000 | -9% |
| EU2 | 168,000 | 174,000 | +7,000 | +4% |
| EU Other | 5,000 | 6,000 | +1,000 | +29% |
| Total EU | 419,000 | 456,000 | +38,000 | +9% |
In the year to December 2019, there were 456,000 NINo registrations by EU nationals, of which:
-
77,000 registrations were from EU8 nationals, a decrease of 9% since the year ending December 2018. EU8 registrations now account for just 17% of EU registrations compared to 20% in the year ending December 2018
-
174,000 registrations were from EU2 nationals, an increase of 4% since the year ending December 2018. EU2 registrations now account for 38% of EU registrations compared to 40% in the year ending December 2018.
-
200,000 registrations were from EU15 nationals, an increase of 23% since the year ending December 2018. EU15 registrations now account for 44% of EU registrations compared to 39% in the year ending December 2018
-
the largest number of registrations was from nationals from Romania (136,000), followed by nationals from Italy (53,000) and from Poland (41,000) (see Figure 6)
Figure 6: Top 5 EU individual nationalities by number of registrations in the year to December 2019 and annual percentage change
| EU Country | Registrations | Annual Percentage Change |
|---|---|---|
| Romania | 136,000 | +1% |
| Italy | 53,000 | +23% |
| Poland | 41,000 | -10% |
| Bulgaria | 39,000 | +16% |
| Spain | 38,000 | +23% |
In the year to December 2019, total EU registrations increased by 9% from the previous year. The increase was mainly driven by the increase in EU15 registrations and to a lesser extent by the increase in registrations by EU2 and Other EU nationals. This was only partly offset by the decreases in registrations by EU8 nationals. The recent increases in EU2 and EU15 registrations should be seen in context with increased operational capacity and the processing of outstanding applications rather than by an increase in new NINo applications.
Figures 7a and 7b show that the countries which had the largest increase in registrations are within the EU15 sub-group, whereas the countries which had the largest decrease in registrations are within the EU8 sub-group.
The increase in EU15 registrations was mostly the result of the increase of registrations by nationals from Italy, Spain and Portugal, whereas the increase in EU2 was mostly the result of the increase of registrations by nationals from Bulgaria. The decrease in EU8 was mostly the result of the decrease of registrations by nationals from Poland.
Figure 7a: EU individual nationalities with the largest increase in registrations in the year to December 2019, change from previous year and annual percentage change
| EU Country | Registrations to Dec 2018 | Registrations to Dec 2019 | Change from previous year | Annual Percentage Change |
|---|---|---|---|---|
| Italy | 43,000 | 53,000 | +10,000 | +23% |
| Spain | 31,000 | 38,000 | +7,000 | +23% |
| Portugal | 19,000 | 25,000 | +6,000 | +30% |
| Bulgaria | 33,000 | 39,000 | +5,000 | +16% |
| Greece | 13,000 | 17,000 | +4,000 | +31% |
Figure 7b: EU individual nationalities with the largest decrease in registrations in the year to December 2019, change from previous year and annual percentage change
| EU Country | Registrations to Dec 2018 | Registrations to Dec 2019 | Change from previous year | Annual Percentage Change |
|---|---|---|---|---|
| Poland | 46,000 | 41,000 | -5,000 | -10% |
| Lithuania | 13,000 | 11,000 | -2,000 | -17% |
| Slovakia | 5,000 | 4,000 | -1,000 | -15% |
4.2. Long term trends and changes in Non-EU Registrations
Figure 8: Number of NINo registrations by Non-EU subgroups to December 2019
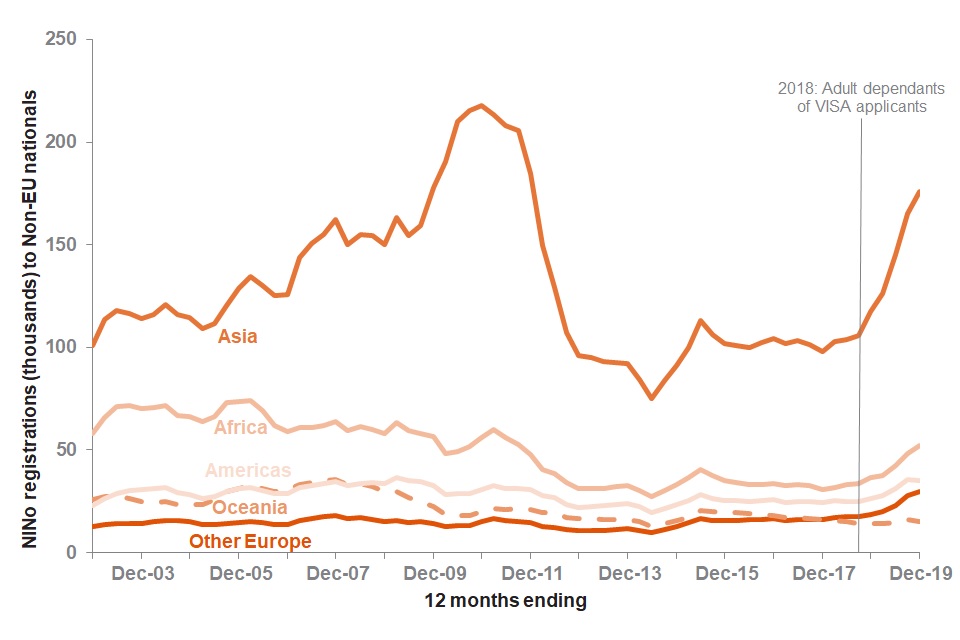
In Figure 8 Non-EU subgroups with neighbouring geographies have been combined together for ease of view.
Registrations from all world areas have been relatively stable, apart from those from Asia, which generally increased until they peaked in the year ending December 2010 (218,00 registrations accounted for 64% of Non-EU registrations), and declined until the year ending June 2014.
Amongst the other groups, the highest contributor of registrations since 2003 are nationals from Africa, followed by those from the Americas, Oceania and Other Europe. Registrations from Other Europe increased above those from Oceania since the end of December 2017.
The noticeable increase in registrations to Non-EU nationals after September 2018 is mostly due to registration for a NINo of adult dependants as part of certain visa approvals
Figure 9a: NINo registrations by Non-EU world areas in the year to December 2018 and 2019, change from previous year and annual percentage change
| Non-EU world areas | Registrations to Dec 2018 | Registrations to Dec 2019 | Change from previous year | Annual Percentage Change |
|---|---|---|---|---|
| Asia | 117,000 | 176,000 | +59,000 | +50% |
| Africa | 36,000 | 52,000 | +16,000 | +43% |
| Other Europe | 19,000 | 30,000 | +11,000 | +58% |
| Americas | 26,000 | 35,000 | +9,000 | +34% |
| Oceania | 14,000 | 15,000 | +1,000 | +7% |
| Total Non-EU | 213,000 | 308,000 | +95,000 | +45% |
Figure 9b: NINo registrations by Non-EU sub-group in the year to December 2018 and 2019, change from previous year and annual percentage change
| Non-EU sub-group | Registrations to Dec 2018 | Registrations to Dec 2019 | Change from previous year | Annual Percentage Change |
|---|---|---|---|---|
| South Asia | 68,000 | 110,000 | +42,000 | +61% |
| Sub-Saharan Africa | 28,000 | 41,000 | +13,000 | +44% |
| Other Europe | 19,000 | 30,000 | +11,000 | +58% |
| East Asia | 18,000 | 24,000 | +6,000 | +35% |
| Middle East and Central Asia | 17,000 | 23,000 | +6,000 | +37% |
| North America | 15,000 | 19,000 | +4,000 | +25% |
| South East Asia | 14,000 | 19,000 | +4,000 | +30% |
| Central and South America | 11,000 | 16,000 | +5,000 | +46% |
| Oceania | 14,000 | 15,000 | +1,000 | +7% |
| North Africa | 8,000 | 11,000 | +3,000 | +38% |
| Total Non-EU | 213,000 | 308,000 | +95,000 | +45% |
In the year to December 2019, there were 308,000 NINo registrations by Non-EU nationals, of which:
-
176,000 registrations of Asian nationals, an increase of 50% since the year ending December 2018. Asia now accounts for 57% of Non-EU registrations compared to 55% in the year ending December 2018
-
17% were from Africa, 11% from Americas, 10% from Other Europe and 5% from Oceania
-
the largest number of registrations was from nationals from India (78,000), followed by nationals from Pakistan (20,000) and from China (14,000) (Figure 10)
Figure 10: Top 5 Non-EU individual nationalities, by registrations in the year to December 2019 and annual percentage change
| Non-EU Country | Registrations | Annual Percentage Change |
|---|---|---|
| India | 78,000 | +71% |
| Pakistan | 20,000 | +43% |
| China | 14,000 | +24% |
| United States | 14,000 | +29% |
| Nigeria | 14,000 | +44% |
In the year to December 2019, registrations by Non-EU nationals increased by 45% from the previous year. The increase was the result of increases in registrations from all world areas, but particularly from nationals from Asia, followed by those from Africa and other Europe.
Figure 11a shows the countries which had the largest increase in registrations are within the Asia world area. Figure 11b shows that countries with a decrease in registrations saw a small decrease only.
The increase in registrations from Asia reflects the increase in registrations from India and Pakistan. The increase in registrations from Africa reflects the increase in registrations from Nigeria and Ghana. The increase in registrations from the Americas reflects the increase in registrations from the United States.
Figure 11a: Non-EU individual nationalities with the largest increase in registrations in the year to December 2019, change from previous year and annual percentage change
| Non-EU Country | Registrations to Dec 2018 | Registrations to Dec 2019 | Change from previous year | Annual Percentage Change |
|---|---|---|---|---|
| India | 46,000 | 78,000 | +32,000 | +71% |
| Pakistan | 14,000 | 20,000 | +6,000 | +43% |
| Nigeria | 9,000 | 14,000 | +4,000 | +44% |
| Ghana | 4,000 | 7,000 | +3,000 | +93% |
| United States | 11,000 | 14,000 | +3,000 | +29% |
Figure 11b: Non-EU individual nationalities with the largest decrease in registrations in the year to December 2019, change from previous year and annual percentage change
| Non-EU Country | Registrations to Dec 2018 | Registrations to Dec 2019 | Change from previous year | Annual Percentage Change |
|---|---|---|---|---|
| Libya | 1,000 | 700 | -300 | -33% |
| Congo | 400 | 300 | -100 | -35% |
| Armenia | 100 | 100 | -10 | -12% |
5. Where in the UK are people registering?
Almost half of all registrations are in London or the South East.
Figure 12: EU and Non-EU NINo registrations in the year to December 2019, by region
| Region | Non-EU | EU |
|---|---|---|
| London | 114,000 | 173,000 |
| South East | 35,000 | 56,000 |
| East of England | 22,000 | 40,000 |
| West Midlands | 22,000 | 33,000 |
| North West | 25,000 | 30,000 |
| Scotland | 21,000 | 27,000 |
| East Midlands | 16,000 | 29,000 |
| South West | 13,000 | 25,000 |
| Yorkshire and The Humber | 16,000 | 22,000 |
| Wales | 6,000 | 7,000 |
| North East | 7,000 | 5,000 |
| Northern Ireland | 2,000 | 8,000 |
Figure 13a: EU NINo registrations in the year to December 2019, by local authority at time of registration
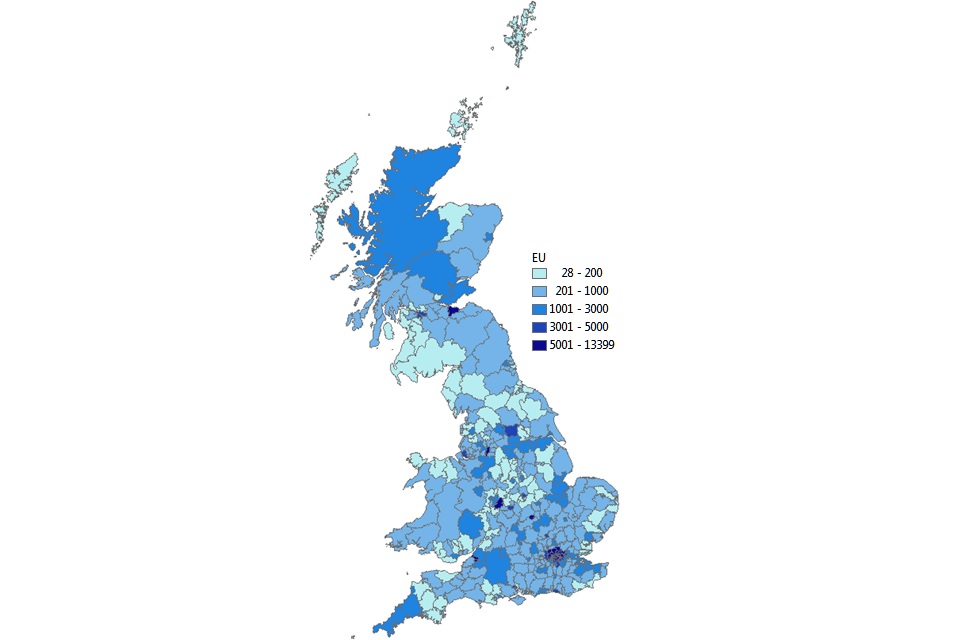
Source: NINo statistics data tables.
Figure 13b: Non-EU NINo registrations in the year to December 2019, by local authority at time of registration
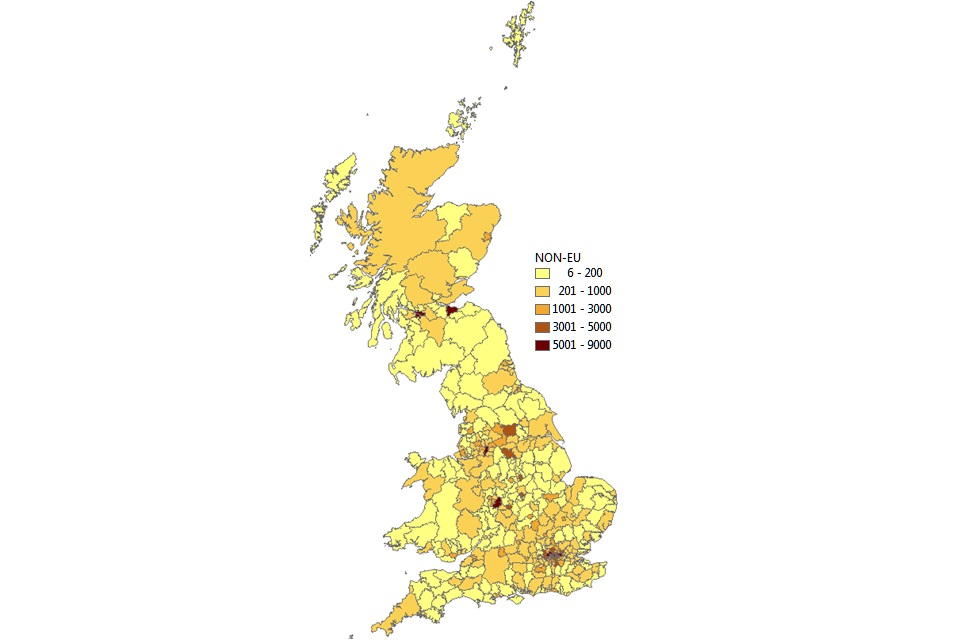
Source: NINo statistics data tables.
In figures 13a and 13b the darker areas of the maps show local authorities with higher levels of registrations.
You can also view an interactive version of the local authority map showing NINo registrations from different world areas by GB local authority.
Figure 14: Top 10 local authorities by number of NINo registrations in the year to December 2019
| Local Authorities | Registrations |
|---|---|
| Newham | 22,000 |
| Tower Hamlets | 19,000 |
| Brent | 17,000 |
| Birmingham | 16,000 |
| Glasgow City | 14,000 |
| Westminster | 13,000 |
| Manchester | 13,000 |
| Ealing | 12,000 |
| City of Edinburgh | 12,000 |
| Haringey | 12,000 |
6. About these statistics
Status: Official Statistics
National Insurance number (NINo) allocations to adult overseas nationals are Official Statistics. Official Statistics are produced in accordance with the Statistics and Registration Service Act 2007 and the Code of Practice for Statistics. They meet high standards of:
- trustworthiness
- quality
- public value
World Areas
For reporting purposes, countries have been grouped into ‘world areas’ based primarily on geographical location. Countries are grouped according to current world area status for the entire back series.
| World Area | Sub Group |
|---|---|
| European Union (EU) | European Union EU15 (original EU members), European Union EU8 (joined EU in 2004), European Union EU2 (joined EU in 2007), European Union Other |
| Non-European Union (Other Europe) | Other Europe |
| Asia | Middle East and Central Asia, East Asia, South Asia, South East Asia |
| Africa | Sub-Saharan Africa, North Africa |
| Americas | North America, Central and South America |
| Oceania | Oceania |
A detailed nationality breakdown for each world area is available in the supplementary data tables accompanying this release.
Where to find out more
Read previous releases of these statistics.
The background information note includes detail on data sources, uses and limitations of the series.
Full statistics on NINo allocations to adult overseas nationals entering the UK are available from Stat-Xplore.
View an interactive map showing NINo registrations from different world areas by GB local authority.
View an interactive NINo dashboard showing NINo registrations by nationality for each GB region.
Read about the NINo application process.
The Migration Statistics Quarterly Report provides a comprehensive summary of the various sources of migration statistics including headline NINo statistics.
Enquires and feedback
DWP would like to hear your views on our statistical publications. If you use any of our statistics publications, we would be interested in hearing what you use them for and how well they meet your requirements: Send your comments by email to: stats-consultation@dwp.gov.uk.
Press enquiries should be directed to the DWP Press Office, telephone: 0203 267 5144.
Other enquiries about these statistics should be directed by email to:
Producer of this release: mehdi.walji1@dwp.gov.uk
Responsible statistician: yolanda.ruizrodriguez@dwp.gov.uk
ISBN: 978-1-78659-213-2