Mortgage and landlord possession statistics: April to June 2025
Published 14 August 2025
Applies to England and Wales

© Crown copyright 2025
This publication is licensed under the terms of the Open Government Licence v3.0 except where otherwise stated. To view this licence, visit nationalarchives.gov.uk/doc/open-government-licence/version/3 or write to the Information Policy Team, The National Archives, Kew, London TW9 4DU, or email: psi@nationalarchives.gov.uk.
Where we have identified any third party copyright information you will need to obtain permission from the copyright holders concerned.
This publication is available at https://www.gov.uk/government/statistics/mortgage-and-landlord-possession-statistics-april-to-june-2025/mortgage-and-landlord-possession-statistics-april-to-june-2025
1. Main Points
This publication presents quarterly mortgage and landlord possession statistics up to April to June 2025. In general, we have compared figures to the same quarter in the previous year. Should users wish to compare against previous years, they can do so using the accompanying statistical tables. For technical detail, please refer to the accompanying supporting document published alongside this bulletin here: Mortgage and landlord possession statistics - GOV.UK
| All mortgage actions have increased | Compared to the same quarter in 2024 there were increases in mortgage possession claims from 5,348 to 6,537 (22%), orders from 3,384 to 4,429 (31%), warrants from 2,959 to 3,787 (28%) and repossessions by county court bailiffs from 869 to 1,146 (32%). |
| All landlord possession actions have decreased | When compared to the same quarter in 2024 there were decreases in landlord possession claims from 24,491 to 22,364 (9%), orders from 18,421 to 17,514 (5%), warrants from 11,240 to 10,307 (8%), and repossessions from 6,999 to 6,709 (4%). |
| Mortgage possession claims have risen across all regions | Increases in mortgage possession claims have been recorded in all regions. Decreases in landlord possession claims have been recorded across all regions except the North East, South East, and Wales. All types of landlord claims remained concentrated in London. |
| Median timeliness for mortgage repossessions has decreased. | The median average time from claim to mortgage repossession has decreased to 42.9 weeks, down from 45.9 weeks in the same period in 2024. Meanwhile, the median average time from claim to warrant is currently 34.0 weeks, unchanged from the same period in 2024. |
| Median timeliness for landlord repossessions has increased. | The median average time from claim to landlord repossession has increased to 27.9 weeks, up from 25.4 weeks in the same period in 2024. |
A data visualisation tool has also been published that provides further breakdowns in a web-based application. The tool can be found here.
For feedback related to the content of this publication and visualisation tool, please contact us at CAJS@justice.gov.uk
2. Statistician’s Comment
There have been decreases across all landlord possession actions when compared to the same quarter in 2024. The reduction in landlord claims is seen across all types of landlord (accelerated, private, and social) claims. The median timeliness of landlord claims to repossessions has risen by 2.4 weeks when compared to the same period in 2024 continuing the general increases seen over previous quarters.
Mortgage actions have all continued to increase this quarter with mortgage claims rising across all regions. The median timeliness for mortgage claims to repossession has fallen by 3 weeks compared to the same quarter last year.
3. Overview of Mortgage Possession
Mortgage possession actions: claims, orders, warrants and repossessions continue recent rises and are all currently above the previous year’s levels.
Compared to the same quarter in 2024, mortgage possession claims (6,537) are up 22%, mortgage orders for possession (4,429) are up 31%, warrants issued (3,787) are up 28% and repossessions (1,146) are up 32%.
Figure 1: Mortgage possession actions in the county courts of England and Wales, April to June 2020 to April to June 2025 (Source: Table 1)
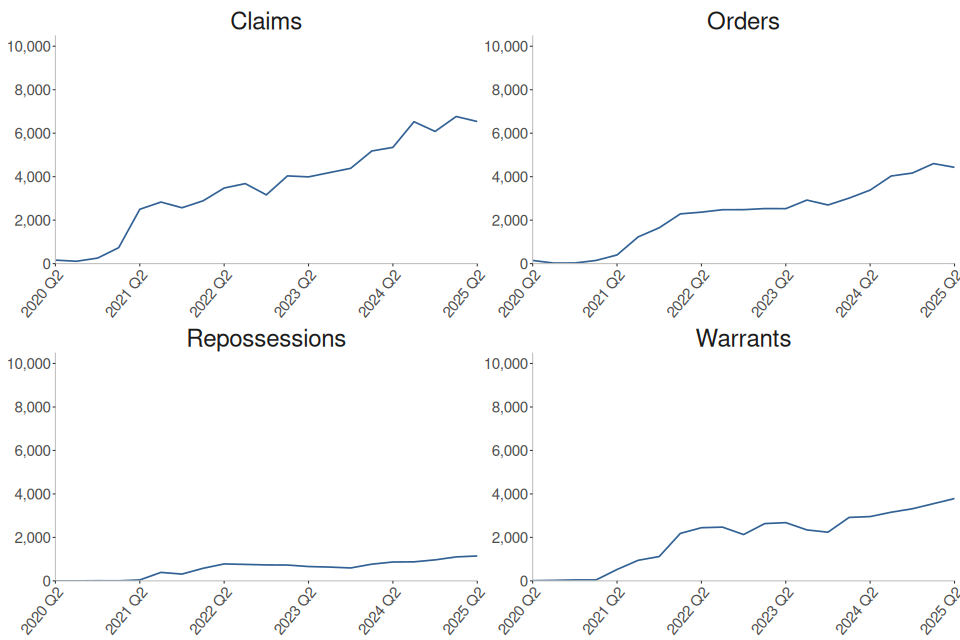
Mortgage possession claims have generally risen since Q2 2021 and continue to rise in the latest quarter. Claims and orders are now 6% and 11% above the volume in Q2 2019 respectively, whereas, warrants and repossession volumes are 20% and 9% below the Q2 2019 volume respectively.
Mortgage possession claims fell from a peak of 26,419 in April to June 2009 (in the aftermath of the 2008 financial crash) before stabilising in 2015. In the most recent quarter, Q2 2025, there were 6,537 claims for possession, up 22% from the same quarter in 2024.
Orders and warrants for possession have followed a similar trend to mortgage claims. Compared to the same quarter in 2024, orders are up 31% to 4,429 and warrants are up 28% to 3,787 in Q2 2025.
4. Mortgage Possession Action Timeliness
Claim to repossession median timeliness has decreased by 3 weeks. While claims to orders and claims to warrants have remained stable when compared to the same quarter in the pervious year.
Figure 2: Average timeliness of mortgage possession actions, April to June 2020 to April to June 2025 (Source: Table 3)
Number of weeks taken from initial mortgage claim to…
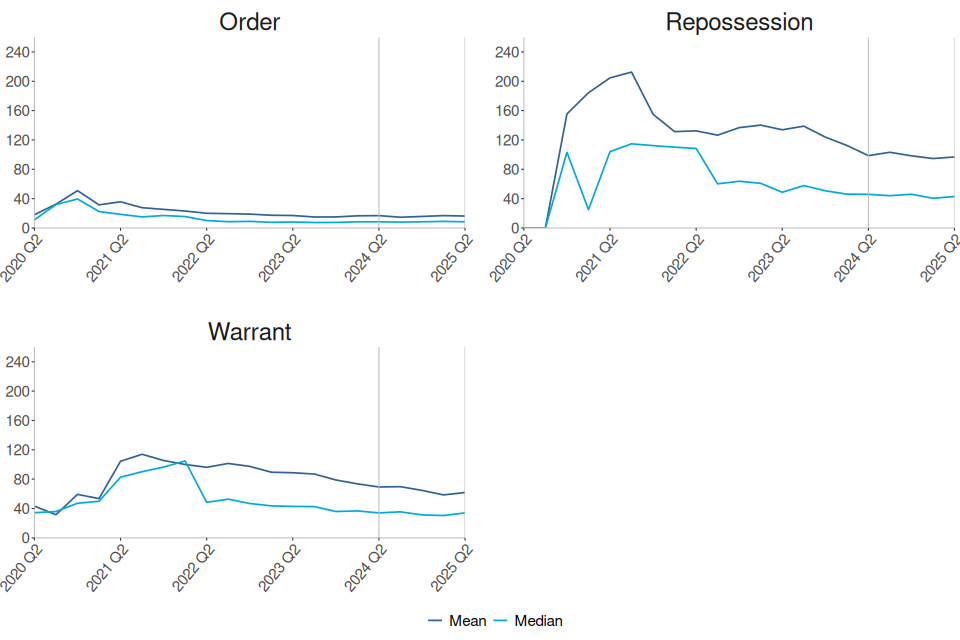
Median times taken to complete mortgage actions has remained stable for claims to orders and claims to warrants compared to the same quarter in 2024, whereas a decrease has been recorded for claims to repossession over the same period. This quarter;
-
Claims to order median timeliness is currently 8.4 weeks, unchanged from the same period in 2024.
-
Claims to warrant median timeliness is currently 34.0 weeks, unchanged from the same period in 2024.
-
Claims to repossession median timeliness has decreased to 42.9 weeks, down from 45.9 weeks in the same period in 2024.
The trend for mortgage possession timeliness is driven by outright orders, which make up around two thirds of all cases. In the most recent quarter, the median time taken from claim to repossession was 39.4 weeks for outright orders, and 146.9 weeks for suspended orders.
The above charts distinguish between the timeliness of possession claims at different stages of a case. Average time taken from claim to warrant or claim to repossession can fluctuate and is affected by various factors. For example, the final two charts take account of the amount of time between the court order being issued and the claimant, such as the mortgage lender, applying for a warrant of possession.
Median figures are generally considerably lower than mean figures, demonstrating that progression from claim to successive stages can be positively skewed by outlying cases.
5. Overview of Landlord Possession
The number of landlord possession actions across all stages (claims, orders, warrants, repossessions) have decreased compared to the same quarter of last year.
Claims (22,364), orders (17,514), warrants (10,307) and repossessions (6,709) have decreased by 9%, 5%, 8%, and 4% respectively compared to the same quarter in 2024.
Figure 3: Landlord possession actions in the county courts of England and Wales, April to June 2020 to April to June 2025 (Source: Table 4)
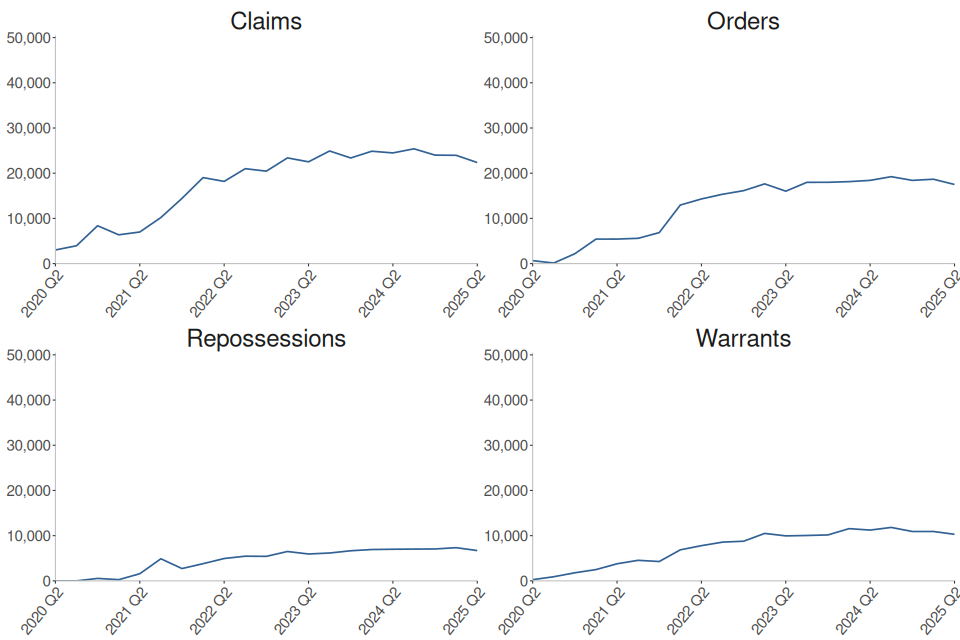
Landlord possession claims showed a general increase from Q2 2021 peaking in Q3 2024 at 25,402. However, these have fallen over the last 3 quarters, currently at 22,364. Within the landlord possession actions, accelerated claims are down 12%, private landlord claims are down 5% and social landlord claims are down 8% compared to the same quarter in 2024.
In Q2 2025, 34% (7,684) of all landlord possession claims were social landlord claims, compared to 33% (7,276) private landlord claims and 33% (7,404) accelerated claims. This contrasts with pre-covid proportions when a majority of claims (around 60%) were social landlord claims.
The fall in claims is present in 4 of the 7 geographical regions, whilst all other regions reported small increases over the same period. As in previous quarters, a concentration was seen in London, with 7,617 landlord claims at London courts accounting for 34% in Q2 2025. Falls were also seen in the Midlands, North and South West regions which have fallen by 17%, and 15% each respectively. In London, there was a decrease of 10% (from 8,486 in Q2 2024) for landlord claims.
The Housing Loss Prevention Advice Service (HLPAS) provides advice to tenants and homeowners as soon as they are served with a written notice asking them to leave their home. Individuals who require the service do not need to meet legal aid financial eligibility rules as the service is not means tested but they are required to show evidence that they are at risk of losing their home. More information can be found here.
6. Landlord Possession Timeliness
Median timeliness figures for landlord orders have remained stable compared to the same period of 2024 while warrant and repossession timeliness increased by 1 and 2.4 weeks respectively over the same period.
The median average time from claim to repossession has increased to 27.9 weeks, up from 25.4 weeks in the same period of 2024.
Figure 4: Average timeliness of landlord possession actions, April to June 2020 to April to June 2025 (Source: Table 6)
Number of weeks taken from initial landlord claim to…
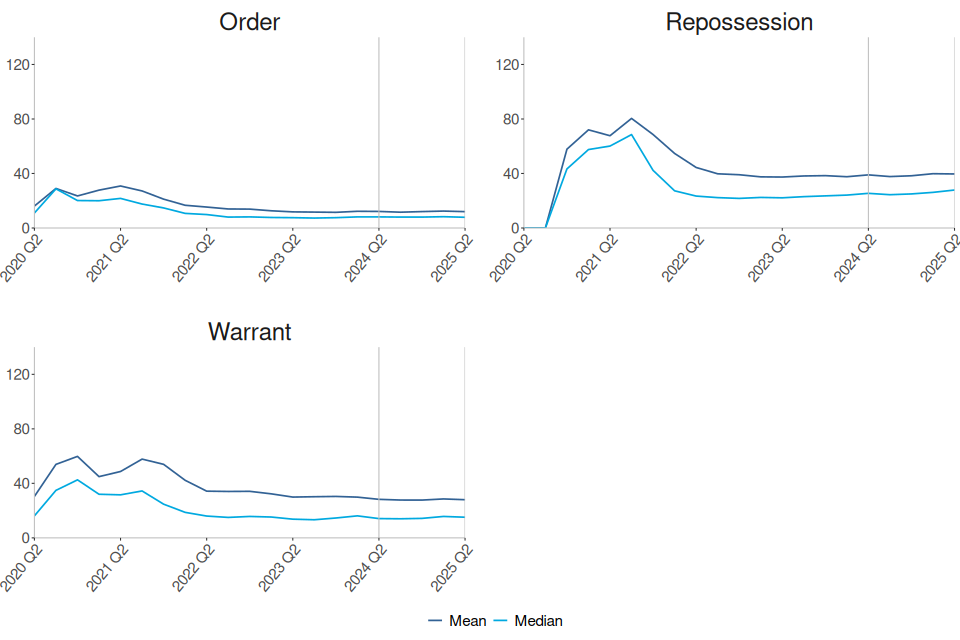
The median time taken to complete landlord actions increased for warrants and repossessions this quarter.
-
Claims to order median timeliness is currently 7.9 weeks, unchanged from the same period in 2024.
-
Claims to warrant median timeliness is currently 15.1 weeks, up from 14.1 weeks in the same period in 2024.
-
Claims to repossessions median timeliness has increased to 27.9 weeks, up from 25.4 weeks in the same period in 2024.
As shown in Figure 4, median figures are generally considerably lower than mean figures, demonstrating that progression from claim to successive stages can be positively skewed by outlying cases.
7. Regional Possession Claims
Westminster had the highest overall rate of mortgage repossessions at 354 per 100,000 households owned by a mortgage or loan.
Private landlord repossessions were highest in Barking and Dagenham with 760 per 100,000 households owned by a private landlord.
Social landlord repossessions were highest in Enfield with 554 per 100,000 households owned by a social landlord.
Since Q4 2022, the methodology used for calculating the rates of possession claims and repossessions has been modified to take into account the variation in proportions of tenure types in each local authority (LA) as measured by the 2021 census. More information on this change is provided in the accompanying guide to this publication here.
Please note rates for private and social landlord possession claims and repossessions do not include accelerated claims. This is because accelerated claims are recorded onto the case management system at point of entry so do not specify the tenure type.
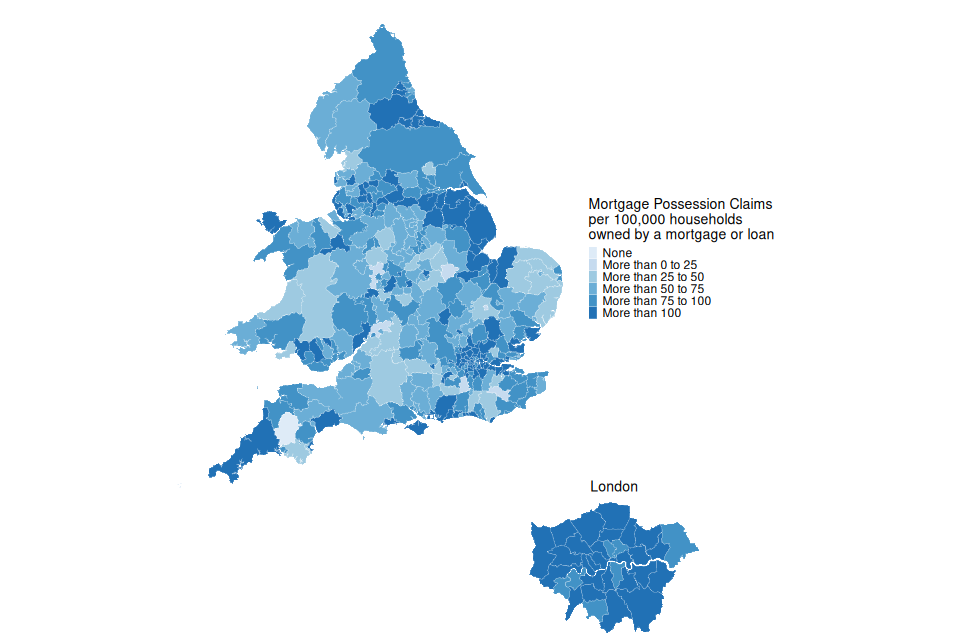
Figure 5: Mortgage possession Claims per 100,000 households owned by a mortgage or loan, April to June 2025 (Source: map.csv; see supporting guide)
| Local Authority | Rate (per 100,000 households owned by a mortgage or loan) | Actual number |
|---|---|---|
| Westminster | 354 | 38 |
| Kensington and Chelsea | 304 | 24 |
| Hartlepool | 226 | 25 |
London boroughs accounted for 5 of the 10 local authorities with the highest rate of mortgage claims. Westminster, in the London region, had the highest rate of mortgage possession claims at 354 per 100,000 households owned by mortgage or loan, followed by Kensington and Chelsea (London region) and Hartlepool (North East region); with 304 and 226 claims per 100,000 respectively. The Isles of Scilly and the City of London have very small populations (ranked 309th and 308th out of 309 respectively for population size) therefore rates may be less robust.
2 local authorities had no mortgage possession claims during this period. Excluding this Cambridge had the lowest rate of mortgage claims (9.8 per 100,000 households owned by a mortgage or loan).
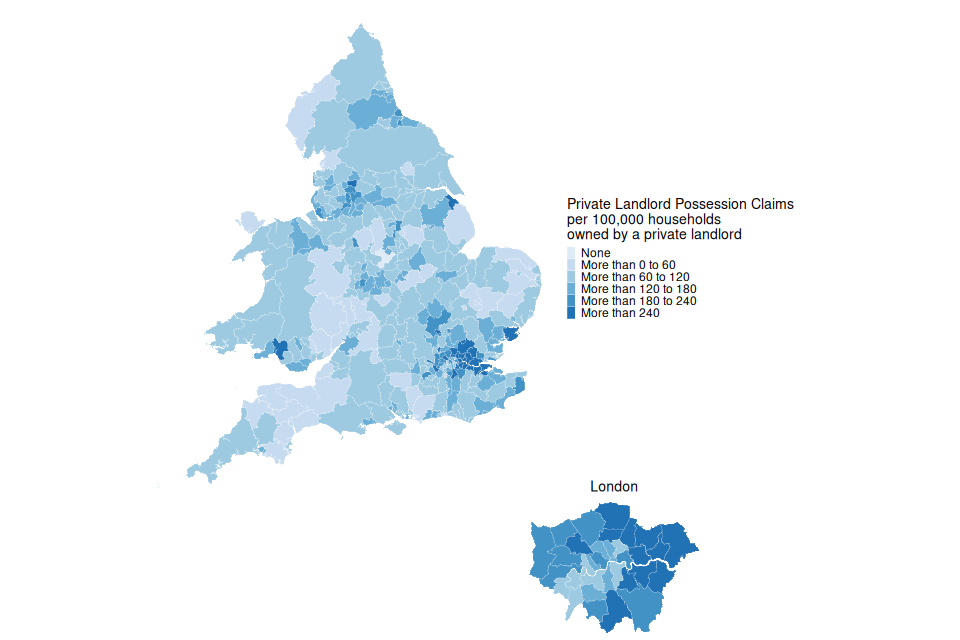
Figure 6: Private landlord possession Claims per 100,000 households owned by a private landlord, April to June 2025 (Source: map.csv; see supporting guide)
| Local Authority | Rate (per 100,000 households owned by a private landlord) | Actual number |
|---|---|---|
| Barking and Dagenham | 760 | 136 |
| Newham | 535 | 238 |
| Redbridge | 497 | 157 |
London boroughs accounted for 8 of the 10 local authorities with the highest rate of private landlord claims. Barking and Dagenham (London region) had the highest rate for private landlord claims (760 per 100,000 households owned by a private landlord), followed by Newham (London region) and Redbridge (London region) with 535 and 497 claims per 100,000 households owned by a private landlord respectively.
2 local authorities had no private landlord claims during this period. Excluding these, South Hams had the lowest rate of private landlord claims (15.8 per 100,000 households owned by a private landlord).
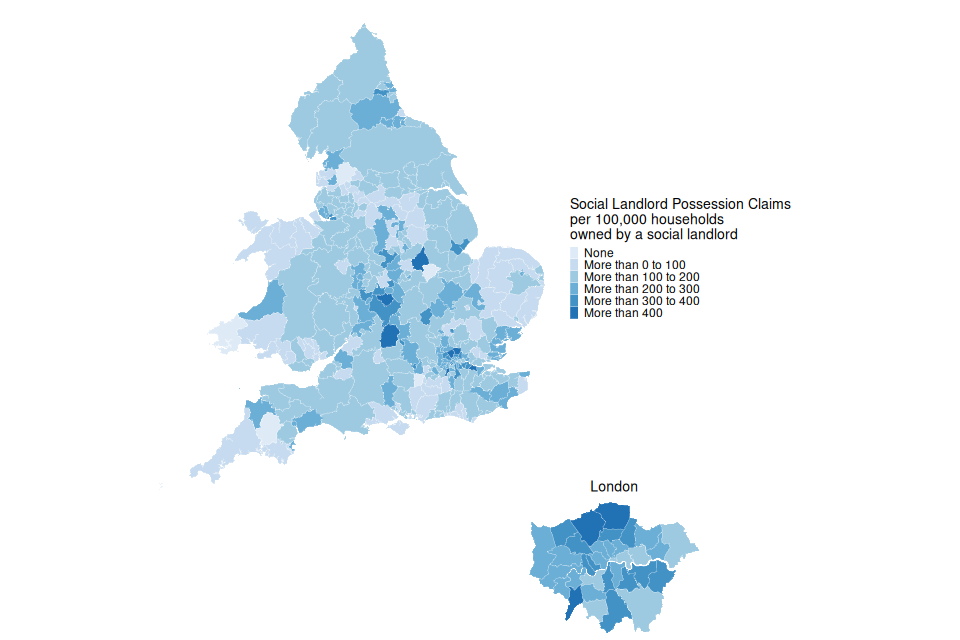
Figure 7: Social landlord possession Claims per 100,000 households owned by a social landlord, April to June 2025 (Source: map.csv; see supporting guide)
| Local Authority | Rate (per 100,000 households owned by a social landlord) | Actual number |
|---|---|---|
| Enfield | 554 | 114 |
| Kingston upon Thames | 525 | 38 |
| Barnet | 464 | 93 |
London and South East boroughs each accounted for 3 of the 10 local authorities with the highest rate of social landlord claims. Enfield (London region) had the highest social landlord possession claim rate with 554 per 100,000 households owned by a social landlord. This was followed by Kingston upon Thames (London region) and Barnet (London region) with 525 and 464 per 100,000 households owned by a social landlord respectively.
6 local authorities had no social landlord claims during this period. Excluding these, Hyndburn had the lowest rate of social landlord claims (21.2 per 100,000 households owned by a social landlord).
8. Regional Repossessions (by County Court Bailiffs)
Blackpool had the highest overall rate of mortgage repossessions at 65 per 100,000 households owned by a mortgage or loan.
Private landlord repossessions were highest in Newham with 247 per 100,000 households owned by a private landlord.
Social landlord repossessions were highest in Kingston upon Thames with 193 per 100,000 households owned by a social landlord.
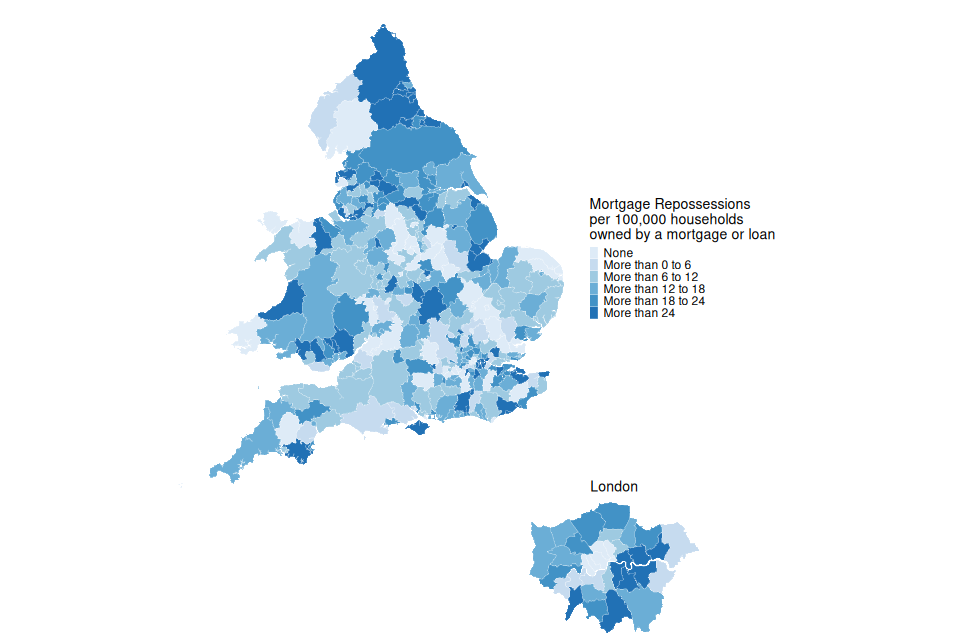
Figure 8: Mortgage repossessions per 100,000 households owned by a mortgage or loan, April to June 2025 (Source: map.csv; see supporting guide)
| Local Authority | Rate (per 100,000 households owned by a mortgage or loan) | Actual number |
|---|---|---|
| Blackpool | 65 | 11 |
| Hartlepool | 63 | <10 |
| Pendle | 57 | <10 |
North East local authorities account for 3 of the 10 boroughs with the highest rate of mortgage repossessions.
No repossessions by county court bailiffs were recorded during this period in 56 local authorities out of a total of 318.
Figure 9: Private landlord repossessions per 100,000 households owned by a private landlord, April to June 2025 (Source: map.csv; see supporting guide)
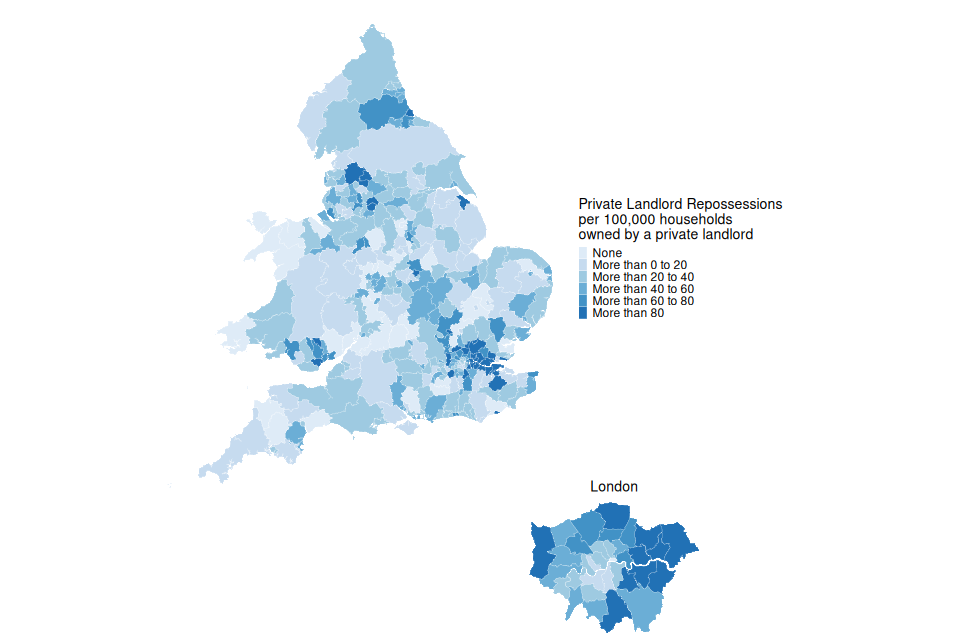
| Local Authority | Rate (per 100,000 households owned by a private landlord) | Actual number |
|---|---|---|
| Newham | 247 | 110 |
| Barking and Dagenham | 240 | 43 |
| Gravesham | 201 | 16 |
London local authorities account for 6 of the 10 boroughs with the highest rate of private landlord repossessions.
37 local authorities had no private landlord repossessions by county court bailiffs in Q2 2025.
Figure 10: Social landlord repossessions per 100,000 households owned by a social landlord, April to June 2025 (Source: map.csv; see supporting guide)
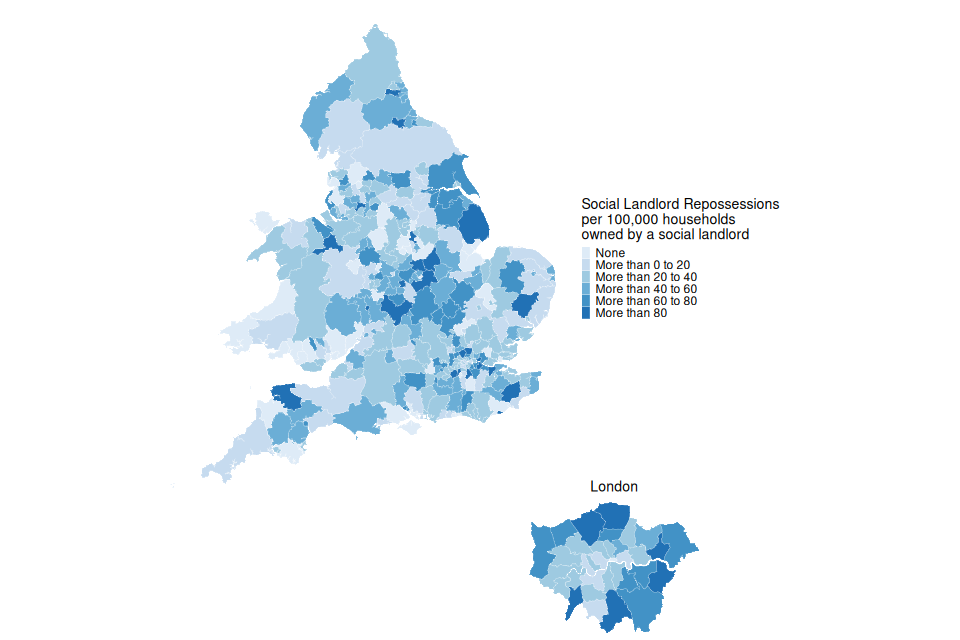
| Local Authority | Rate (per 100,000 households owned by a social landlord) | Actual number |
|---|---|---|
| Kingston upon Thames | 193 | 14 |
| Nuneaton and Bedworth | 147 | 12 |
| East Lindsey | 137 | 10 |
East Midlands local authorities account for 4 of the 10 boroughs with the highest rate of social landlord repossessions.
48 local authorities had no social landlord repossessions by county court bailiffs in Q2 2025.
As with claims, it should be noted that for some of these areas the rates are based on a small number of repossessions.
9. Further information
The statistics in the latest quarter are provisional and revisions may be made when the next edition of this bulletin is published. If revisions are needed in subsequent quarters, these will be annotated in the tables.
9.1 Accompanying files
As well as this bulletin, the following products are published as part of this release:
-
A supporting guide providing further information on how the data is collected and processed, including a guide to the csv files, as well as legislation relevant to mortgage possessions and background information.
-
A set of overview tables (also available in accessible format), covering key sections of this bulletin.
-
CSV files of the map data and the possession action volumes by local authority and county court.
-
A data visualisation tool which provides a detailed view of the Mortgage and Landlord statistics. We welcome feedback on this tool to help improve it in later editions and to ensure it meets user needs.
These can be found here: https://www.gov.uk/government/statistics/mortgage-and-landlord-possession-statistics-april-to-june-2025
9.2 National Statistics status
National Statistics are accredited official statistics (https://osr.statisticsauthority.gov.uk/accredited-official-statistics/) that meet the highest standards of trustworthiness, quality and public value.
Accredited official statistics are called National Statistics in the Statistics and Registration Service Act 2007. These accredited official statistics were independently reviewed by the Office for Statistics Regulation in September 2021. They comply with the standards of trustworthiness, quality and value in the Code of Practice for Statistics and should be labelled ‘accredited official statistics’.
It is the Ministry of Justice’s responsibility to maintain compliance with the standards expected for National Statistics. If we become concerned about whether these statistics are still meeting the appropriate standards, we will discuss any concerns with the Authority promptly. National Statistics status can be removed at any point when the highest standards are not maintained, and reinstated when the standards are restored. These statistics have been audited and re-accredited as National Statistics. The most recent compliance check completed by the Office of Statistics Regulation can be found here.
9.3 Future publications
Our statisticians regularly review the content of publications. Development of new and improved statistical outputs is usually dependent on reallocating existing resources. As part of our continual review and prioritisation, we welcome user feedback on existing outputs including content, breadth, frequency and methodology. Please send any comments you have on this publication including suggestions for further developments or reductions in content.
9.4 Contact
Press enquiries should be directed to the Ministry of Housing, Communities and Local Government press office:
email: newsdesk@communities.gov.uk
Other enquiries and feedback on these statistics should be directed to the Courts and People unit of the Ministry of Justice:
Rita Kumi-Ampofo - email: CAJS@justice.gov.uk
Next update: 13 November 2025
© Crown Copyright
Produced by the Ministry of Justice