Maintained schools and academies inspections and outcomes as at 31 December 2017
Published 22 March 2018

© Crown copyright 2018
This publication is licensed under the terms of the Open Government Licence v3.0 except where otherwise stated. To view this licence, visit nationalarchives.gov.uk/doc/open-government-licence/version/3 or write to the Information Policy Team, The National Archives, Kew, London TW9 4DU, or email: psi@nationalarchives.gov.uk.
Where we have identified any third party copyright information you will need to obtain permission from the copyright holders concerned.
This publication is available at https://www.gov.uk/government/statistics/maintained-schools-and-academies-inspections-and-outcomes-as-at-31-december-2017/maintained-schools-and-academies-inspections-and-outcomes-as-at-31-december-2017
This release contains:
- most recent inspections and outcomes as at 31 December 2017
- provisional data for inspections completed between 1 September 2017 and 31 December 2017
- revised data for inspections completed between 1 September 2016 and 31 August 2017
There has been very little change in the overall effectiveness grades for schools at their most recent inspection.
Overall the picture has remained broadly consistent. The proportion of outstanding schools has increased very slightly, to 22%, although the proportion of schools judged to be good has decreased from 68% to 67%. There has been gradual improvement in inspection outcomes over a number of years.
Figure 1: Overall effectiveness of maintained schools and academies at their most recent inspection
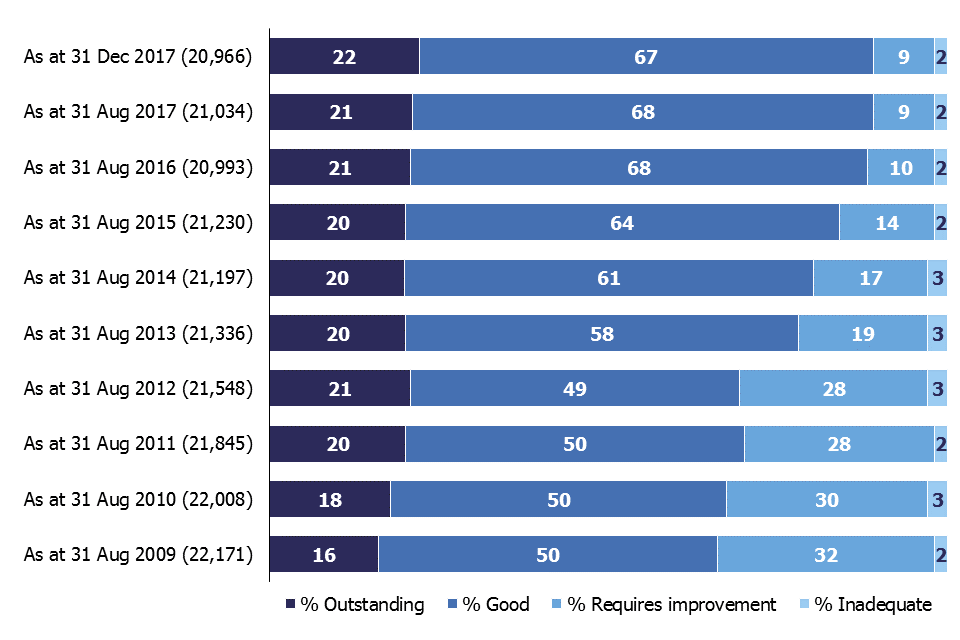
There has been gradual improvement in inspection outcomes over a number of years.
A lower proportion of short inspections converted to a full inspection this year following a change of policy.
Only 21% of short inspections converted to a full inspection in this academic year so far (compared with 29% last year). This fall is due in part to changes to the way we carry out inspections, where around 20% of previously good schools now receive a full inspection instead of a short inspection.
1. Inspections between 1 September 2017 and 31 December 2017
Between 1 September 2017 and 31 December 2017, there were 974 inspections that resulted in an overall effectiveness judgement being made for the school. These consisted of:
- inspections that were planned to be full inspections (conducted under section 5 of the Education Act 2005)
- inspections conducted under section 8 of the act, which became full inspections part way through the inspection (through Ofsted’s power to convert section 8 to section 5), in order to gather further evidence and make an overall effectiveness judgement
There were 625 scheduled full section 5 inspections, and 66 section 8 inspections that were deemed section 5 inspections (for instance monitoring inspections where the school had made progress since the last inspection so the inspection became a full inspection). In addition there were 283 short inspections that converted to a full section 5 inspection where more evidence was needed to confirm the original judgement, or where there were serious concerns on safeguarding, behaviour or the quality of education. Of the 1,344 short inspections conducted, 1,061 did not convert, and confirmed the grade given at the school’s previous section 5 inspection.
Figure 2: Overall effectiveness of schools inspected in between 1 September 2017 and 31 December 2017, by phase (includes most recent outcome for short inspections that did not convert) [footnote 1]
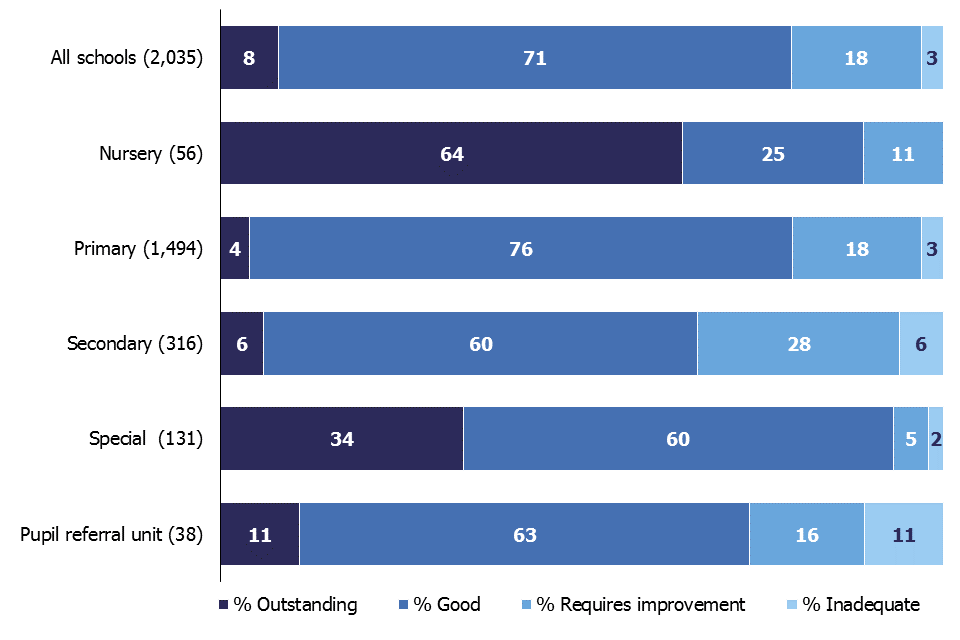
Seventy-nine per cent of schools were judged good or outstanding over the period with a majority of schools being judged good, across each phase of education.
Seventy-nine per cent of the 2,035 schools receiving a full or short inspection were judged good or outstanding over the period. The majority of schools were judged good, across each phase of education, except for nursery schools where nearly two-thirds were judged outstanding (Figure 2). Pupil referral units (11%) and secondary schools (6%) had the highest proportion of schools judged inadequate.
Out of these 2,035 inspections, 1,923 were of schools that had been inspected before. The remaining 112 were mainly sponsor-led academies receiving their first inspection as an academy.
Of the schools with a previous inspection, 71% retained their previous grade, whilst more schools declined than improved: 17% compared with 12%.
Figure 3: Overall effectiveness of schools inspected between 1 September 2017 and 31 December 2017, by previous inspection outcome (includes most recent outcome for short inspections that did not convert) [footnote 2]
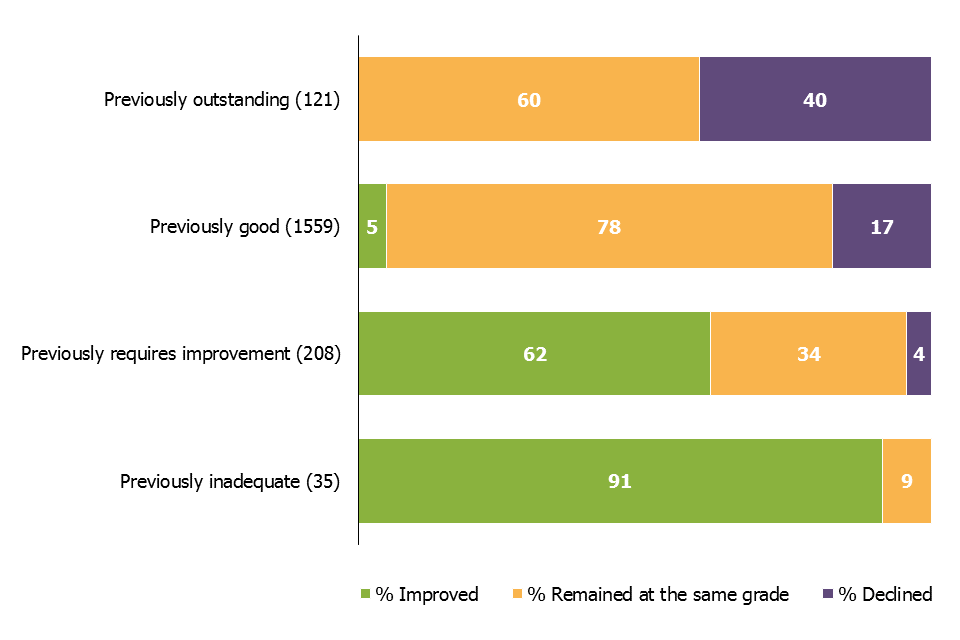
Between 1 September 2017 and 31 December 2017 there were 1,680 inspections of schools that were good or outstanding at their previous inspection and 77% of these remained at the same grade.
Between 1 September 2017 and 31 December 2017 there were 1,680 inspections of schools that were good or outstanding at their previous inspection and 77% of these remained at the same grade. Of these, 1,344 were short inspections, where 8 out of 10 inspections confirmed the grade of the previous inspection. Of the schools previously judged requires improvement or inadequate, both groups have seen improvement (62% and 91% respectively).
2. Short inspections
Between 1 September 2017 and 31 December 2017 we carried out 1,344 short inspections of schools judged to be good or outstanding at their previous inspection.
Overall, 90% of schools confirmed or improved on the grade of their previous inspection (good or outstanding). Some of these were of schools that remained the same grade following a short inspection that did not convert. In other cases, short inspections converted to a full inspection and just over half confirmed or improved on the previous judgement.
Primary schools were more likely to retain their good grade or improve to outstanding than secondary schools. Ninety per cent of primary schools stayed good or improved to outstanding following a short inspection, compared with 86% of secondary schools.
Only 21% of short inspections have converted to a full inspection. This was lower than those that converted between 1 September 2016 and 31 August 2017, where 29% converted to a full inspection. Of the 283 inspections that converted, nearly half (48%) then resulted in the school declining to requires improvement or inadequate, compared to 58% between 1 September 2016 and 31 August 2017.
This fall in the conversion rate is due in part to changes to the way we carry out short inspections of previously good or outstanding schools. From November 2017, following a public consultation on the short inspections of good schools, around 20% of previously good schools now receive a full inspection instead of a short inspection, where our risk assessment tells us that a short inspection would be highly likely to convert. As these schools are no longer part of the short inspection process, we would expect a lower proportion of those still having a short inspection to convert to a full inspection.
Conversion rates between 1 September 2017 and 31 December 2017 are higher for secondary schools than primary schools: 37% compared with 19%. However, where conversion took place, primary schools were more likely to decline than secondary schools (52% compared to 39%).
3. Schools at their most recent inspection
At the end of December 2017, the proportion of schools judged to be good or outstanding at their most recent inspection remained the same, at 89%: the same proportion seen since August 2016. However within this there has been a marginal increase in the proportion of schools that are judged outstanding, to 22%, while the proportion that are judged good has reduced slightly to 67%. Grades remain higher for primary schools (90% good or outstanding) than for secondary schools (80% good or outstanding).
For some phases of education there have been small changes to the proportion[footnote 3] of schools judged good or outstanding at their most recent inspection, when compared with August 2017:
-
secondary schools remained broadly the same, with a marginal increase to 80%, from 79% in August 2017
-
pupil referral units are 85%, a decrease from 88%
-
nursery schools are 98%, a small decrease from 99%
Figure 4: Overall effectiveness of maintained schools and academies at their most recent inspection, 31 December 2017
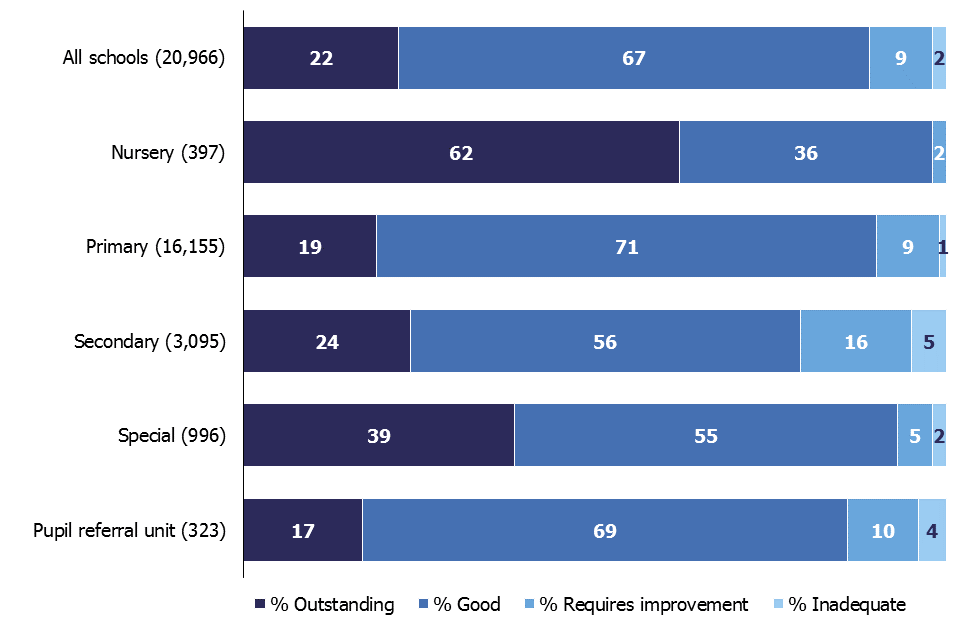
The proportion of outstanding schools has increased very slightly to 22%.
However there has been no overall change in the proportion of schools judged good and outstanding for:
- primary schools are still 90%, the same position as in August 2017
- special schools are still 94%
For secondary schools, the small improvement seen is driven by school closures. While inspections during this academic year showed that more schools improved than declined, more schools actually declined from good or outstanding to requires improvement or inadequate, than improved from requires improvement or inadequate to good or outstanding. Overall, this should have a downward impact on the proportion of all secondary schools that are good or outstanding.
However, in the same period 106 secondary schools closed. A third of these schools closed and reopened as converter academies, which, under our statistical methodology, keep the inspection history of their predecessor school in the dataset. The two-thirds of schools that closed for other reasons, including to become sponsor-led academies, currently lose their inspection history and their grades are no longer included in the dataset. Nearly 8 out of 10 of these schools were judged to be less than good at their most recent inspection. Therefore the percentage of schools that are outstanding or good can increase as a proportion of all schools inspected, simply because of schools closing.
Following our recent consultation on changes to Ofsted’s statistical reporting of inspection outcomes for maintained schools and academies, all schools that close and then reopen as an academy will be included in our statistical releases from June 2018.
4. The relationship between the inspection judgements
In addition to overall effectiveness, there are 4 other judgements made on all full (section 5) school inspections. The grades given for these judgements are often the same as the grade given for the school’s overall effectiveness judgement.
Looking at the 6,231 full inspections conducted since the common inspection framework was introduced in September 2015, Table 1 shows the proportion of inspections where the grades for each judgement were the same as the overall effectiveness grade.
Outcomes for children and learners and the quality of teaching and assessment have the highest proportions of inspections with the same grade as the overall effectiveness grade. The effectiveness of leadership and management also has a strong relationship with the overall effectiveness grade, but to a lesser degree. The reasons for this, such as how inspectors take account of the challenges that leaders face in schools with high proportions of disadvantaged pupils, were explored in the Ofsted’s Annual Report 2017.
Table 1: The proportion of inspections where the overall effectiveness grade is the same as the grade for the other judgements, at inspections between 1 September 2015 and 31 December 2017
| Judgement | Overall effectiveness of all schools* | Overall effectiveness of primary schools | Overall effectiveness of secondary schools |
|---|---|---|---|
| Outcomes for children and learners | 96% | 97% | 94% |
| Quality of teaching, learning and assessment | 96% | 97% | 94% |
| Effectiveness of leadership and management | 90% | 91% | 84% |
| Personal development, behaviour and welfare | 68% | 65% | 73% |
* The term ‘all schools’ includes nursery schools, primary schools, secondary schools, special schools and pupil referral units.
Primary schools show the highest proportion of schools with the same grade in comparison with secondary schools. This is true of all judgements except personal development, behaviour and welfare, where it is lower than secondary school inspections.
Table 2: Comparison of outcomes for personal development, behaviour and welfare and overall effectiveness, at inspections between 1 September 2015 and 31 December 2017
| Overall effectiveness judgement | Personal development, behaviour and welfare is stronger than overall effectiveness | Personal development, behaviour and welfare is the same as overall effectiveness | Personal development, behaviour and welfare is weaker than overall effectiveness |
|---|---|---|---|
| All outcomes | 32% | 68% | 0% |
| Outstanding | 0% | 99% | 1% |
| Good | 15% | 85% | 0% |
| Requires improvement | 59% | 41% | 0% |
| Inadequate | 54% | 46% | 0% |
For the personal development, behaviour and welfare judgement, the relationship with the overall effectiveness judgement is far less strong than that seen for the other judgements.
The differences between the personal development, behaviour and welfare judgement and the overall effectiveness judgement are mainly where the personal development, behaviour and welfare grade is higher than the overall effectiveness grade. This is true for all phases of education and across all grades of overall effectiveness except where overall effectiveness is outstanding.
5. Revisions to previous release
Provisional data for the last academic year indicated that there were 2,821 section 5 inspections between 1 September 2016 and 31 August 2017, as published by 30 September 2017.
Revised data shows that an additional 21 inspections took place where the report was published too late for inclusion in the provisional data, but was published by 31 December 2017. Sixteen were primary schools and there were 5 secondary schools.
Fourteen of the 21 inspections resulted in an inadequate judgement. Inspections leading to an inadequate judgement undergo additional moderation and are sometimes published later than reports for schools with other overall effectiveness grades. See the methodology and quality report for more details.
The percentages of schools remained the same for all phases of education except:
- the proportion of requires improvement primary schools reduced from 37% to 36%, and the proportion inadequate increased from 9% to 10%
- the proportion of inadequate secondary schools increased from 19% to 20%.from 10% to 11% for primary schools
Further details can be found in the revised table 2 of the charts and tables Excel document.
6. Response to the consultation on changes to Ofsted’s statistical reporting of inspection outcomes for maintained schools and academies
Between 30 November 2017 and 18 January 2018, Ofsted consulted on proposals to change to the way we compile data on schools’ most recent inspections.
Ofsted published its response to this consultation on 15 March 2018. Respondents supported these proposals. Based on these findings, we will make all of the changes proposed as part of the consultation. These will be applied in the next official statistics publication in June 2018.
7. Notes
Data in this release is from inspections undertaken between 1 September 2017 and 31 December 2017 and most recent inspections of open schools at 31 December 2017, where the inspection report was published by 31 January 2018. If an inspection report is not published by 31 January 2018 then the previous inspection, where available, will be reported as a school’s most recent inspection.
Inspections are conducted under sections 5 and 8 of the Education Act 2005. Under exceptional circumstances Ofsted may withhold publication of an inspection report.
An explanation of the main uses of this data and further contextual information and the arrangements for quality assurance is provided in the accompanying methodology and quality report. This report also provides information about strengths and limitations of the statistics.
8. Glossary
8.1 Academies
Academies are publicly funded independent schools. Academies do not have to follow the national curriculum and can set their own term times. They still have to follow the same rules on admissions, special educational needs and exclusions as other state schools.
Academies get money direct from the government, not the local authority. They are run by an academy trust, which employs the staff. Some academies have sponsors such as businesses, universities, other schools, faith groups or voluntary groups. Sponsors are responsible for improving the performance of their schools.
Academies include converter and sponsor-led academies, free schools, university technical colleges and studio schools.
8.2 Academy converters
Academy converters are schools that have opted to become an academy, most of which were good or outstanding local authority maintained schools before they became an academy.
Academy converters retain their latest inspection grade, even if the most recent inspection was of the predecessor school.
8.3 Sponsor-led academies
Sponsor-led academies are academies which have sponsors such as businesses, universities, other schools, faith groups or voluntary groups. Sponsors are responsible for improving the performance of their schools.
Sponsor-led academies are viewed as new legal entities and do not retain their inspection history.
8.4 Free schools
Free schools are funded by the government but are not run by the local authority. They are set-up on a not-for-profit basis by charities, universities, and community and faith groups, among others.
Free schools are ‘all-ability’ schools, so cannot use academic selection processes like a grammar school. They can set their own pay and conditions for staff and change the length of school terms and the school day. Free schools do not have to follow the national curriculum.
8.5 Local authority maintained schools
Maintained schools are funded by the government and run by the local authority. They must follow the national curriculum.
8.6 Short inspections
Most good schools now receive short inspections, as do outstanding nursery, pupil referral units and special schools. Short inspections are a one-day inspection visit and take place approximately every 3 years. A short inspection determines whether the school continues to provide the same good or outstanding standard of education for pupils. A short inspection does not result in individual graded judgements nor does it change the overall effectiveness grade of the school. If the school shows significant decline, a short inspection is converted to a full inspection, where inspectors will make the full set of graded judgements required under section 5. From November 2017, around 20% of previously good schools are now subject to a full section 5 inspection instead of a short inspection, where our risk assessment tells us that a short inspection would be highly likely to convert. For example where a school underwent significant change, such as changing its age range, or where the quality of provision may have deteriorated significantly.
9. Further information
If you have any comments or feedback on this publication, please contact Louise Butler on 03000 131 457 or Louise.Butler@ofsted.gov.uk
9.1 Acknowledgements
Thanks to the following for their contribution to this statistical release: John Willman, James Jordan, Michael Taylor and Chris Foley.
-
Short inspections that did not convert confirm the grade of the previous inspection. Those outcomes are included here and will always be good or outstanding. ↩
-
Short inspections that did not convert confirm the grade of the previous inspection. Those outcomes are included here and will always be good or outstanding. ↩
-
The proportion of schools that are good or outstanding is calculated using unrounded data, so sometimes differs slightly from the sum of the % good and % outstanding shown in the chart. ↩