Local tobacco control profiles for England: short statistical commentary, December 2021
Published 7 December 2021
Applies to England

© Crown copyright 2021
This publication is licensed under the terms of the Open Government Licence v3.0 except where otherwise stated. To view this licence, visit nationalarchives.gov.uk/doc/open-government-licence/version/3 or write to the Information Policy Team, The National Archives, Kew, London TW9 4DU, or email: psi@nationalarchives.gov.uk.
Where we have identified any third party copyright information you will need to obtain permission from the copyright holders concerned.
This publication is available at https://www.gov.uk/government/statistics/local-tobacco-control-profiles-for-england-december-2021/local-tobacco-control-profiles-for-england-short-statistical-commentary-december-2021
New in this update
New smoking prevalence and attributable mortality data has been added to the local tobacco control profiles (LTCP) on the Fingertips platform. The following indicators have been updated and are available at local authority level as well as for England, the regions, and various inequality groups:
- smoking prevalence in adults (18+) – current smokers (Annual Population Survey (APS)) (2020 definition)
- smoking prevalence in adults (18+) – ex-smokers (APS) (2020 definition)
- smoking prevalence in adults (18+) – never smoked (APS) (2020 definition)
- odds of reporting current smoking status among adults aged 18 to 64 with a routine and manual occupation (APS) (2020 definition)
- smoking prevalence among adults aged 18 to 64 in routine and manual occupations (APS) (2020 definition)
- mortality from lung cancer: single year
- mortality from chronic obstructive pulmonary disease: single year
Main findings
The current adult smoking prevalence in England for 2020 (April to December) was 12.1%. As explained in the ‘Background’ section below, due to a change in survey mode it is not appropriate to compare the 2020 prevalence figure to the previously published trend.
The prevalence of current smokers in the routine and manual occupation group (18 to 64) for 2020 (April to December) was 21.4%.
The prevalence of current smokers was highest in the North East and the North West and lowest in the South West.
For 2020 there were 26,935 deaths due to lung cancer in England. The mortality rate for lung cancer in England was 49.6 per 100,000. This continues the general downward trend for lung cancer mortality.
For 2020 there were 23,650 deaths due to chronic obstructive pulmonary disease (COPD) in England. The mortality rate for COPD in England was 43.3 per 100,000 and is the second consecutive reduction in the COPD mortality rate.
Smoking prevalence and smoking-related mortality rates were highest in the most deprived areas.
Key definitions used in this release
-
Smoking attributable mortality: Deaths from conditions which are partially caused by smoking. A fraction of the deaths from smoking related conditions are included based on the latest academic evidence about the contribution smoking makes to the condition.
-
Odds of reporting current smoking status among adults aged 18 to 64 with a routine and manual occupation: This is a renamed version of the previously published ‘Smoking prevalence in adults – socioeconomic gap in current smokers’. The underlying odds ratio calculation remains the same.
-
Odds ratio: A measure of association between an exposure and an event. The odds ratio represents the odds that an event will occur given a particular exposure, compared to the odds of the event occurring in the absence of that exposure.
Background
The smoking prevalence figures included in this update for 2020 are from the Annual Population Survey (APS). The APS is designated as a National Statistic and has provided a consistent time series of data for smoking prevalence.
However, data for 2020 is based on survey collection from April to December 2020 only due to the COVID-19 pandemic. The mode of the APS changed from face-to-face interview to telephone only from April 2020. Prior to publication the Office for National Statistics (ONS) have investigated whether there was a relationship between the smoking prevalence estimate and the change in survey mode and concluded these estimates have been impacted by the change from face-to-face interview to telephone. ONS have noted that historically prevalence has always been lower among telephone respondents compared to face-to-face respondents. ONS also concluded that selection bias will have also influenced the final prevalence figures, among other factors.
As such, the final prevalence figures published in this update are lower than would have been expected if data collection had stayed the same for 2020. This means the 2020 prevalence figures are presented separately from data for earlier periods.
As data cover less than a full year, confidence limits are wider than observed for a typical year of APS which has resulted in fewer local areas being statistically significantly higher or lower than the England average. In Fingertips this means fewer areas than expected will be rated red or green. More will be amber due to wider confidence intervals overlapping with the England average. This is not expected to be the case with the 2021 release which will again be based on a full calendar year.
Finally, as the latest data point for the mortality indicators cover the calendar year 2020, they will show the initial impact of the COVID-19 pandemic. To accommodate this, data has been presented as single years from 2001 to 2020. However, comparisons between 2019 and 2020 need to be made with caution. COVID-19 was a new cause of death in 2020 and some who died from it may have died from another cause instead if the pandemic had not occurred. This will have impacted on mortality rates from these other causes in 2020.
Summary of updated indicators
Smoking prevalence (APS)
The current adult (18+) smoking prevalence for 2020 was 12.1%. As discussed in the ‘Background’ to this update above, this figure is for April to December and is affected by the change in APS methodology, cannot be compared with previous years’ data and is lower than expected if the APS had retained its face-to-face component.
The prevalence of ex-smoking among adults (18+) in 2020 was 26.3% and of those who have never smoked was 61.6%.
The prevalence of current smokers was highest in the North East (13.6%) and the North West (13.4%) and lowest in the South West (10.9%). These were statistically significantly higher than the England average (12.1%). The prevalence of current smokers at upper-tier local authority level varied from 20.8% in Manchester to 5.5% in Wokingham.
Figure 1: prevalence of current smokers (18+), region, 2020
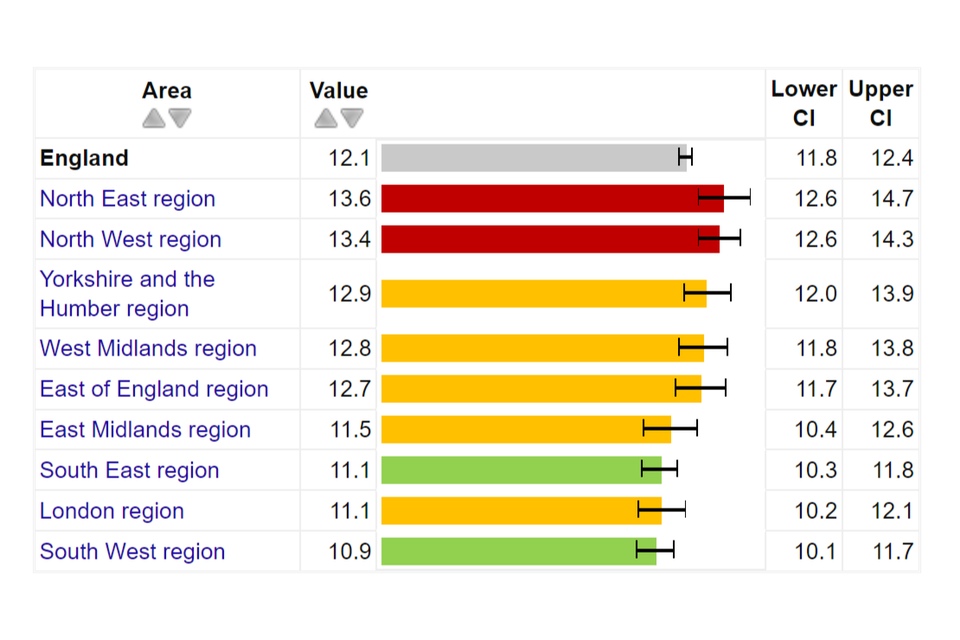
The prevalence of current smokers was highest in the most deprived decile (15.5%) and lowest in the least deprived decile (9.2%). The prevalence of current smokers in the routine and manual occupation group (18 to 64) was 21.4% which compares to 12.1% across the general population and gives an odds ratio of 2.1 when compared to those in other occupation groups.
As mentioned, it is not appropriate to compare the 2020 prevalence figures with the previously published trend.
Mortality from lung cancer: single year
For 2020 there were 26,935 deaths due to lung cancer in England. The mortality rate for lung cancer in England was 49.6 per 100,000. This is a reduction from 2019 where the rate was 51.4 (per 100,000) and continues the general downward trend for lung cancer mortality.
The mortality rate was highest in the North East region (67.4 per 100,000) and lowest in the South West region (41.6 per 100,000). The mortality rate at upper-tier local authority level varies from 97.2 per 100,000 in Manchester to 23.0 per 100,000 in Wokingham.
Figure 2: lung cancer mortality (all ages): single year, counties and unitary authorities, 2020
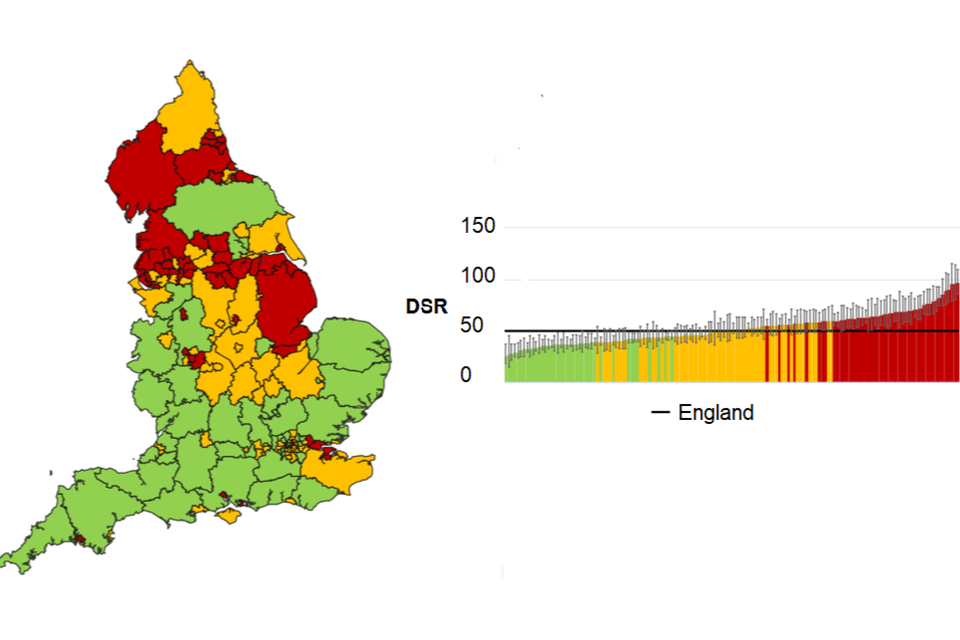
In addition, the rate of lung cancer mortality in the most deprived decile (73.5 per 100,000) was double the rate observed in the least deprived decile (35.9 per 100,000).
Mortality from chronic obstructive pulmonary disease: single year
For 2020 there were 23,650 deaths due to chronic obstructive pulmonary disease (COPD) in England. The mortality rate for COPD in England was 43.3 per 100,000. This is a reduction from 2019 where the rate was 50.5 (per 100,000) and is the second consecutive reduction in the COPD mortality rate. This is a significant reduction and likely impacted by cause displacement due to COVID deaths; that is, COVID-19 was a new cause of death in 2020 and some who died from it may have died from another cause such as COPD instead if the pandemic had not occurred.
The mortality rate was highest in the North East region (56.8 per 100,000) and lowest in the South West region (32.8 per 100,000). The mortality rate at upper-tier local authority level varies from 108.0 per 100,000 in Manchester to 17.8 per 100,000 in Harrow.
Figure 3: COPD mortality (all ages): single year, counties and unitary authorities, 2020
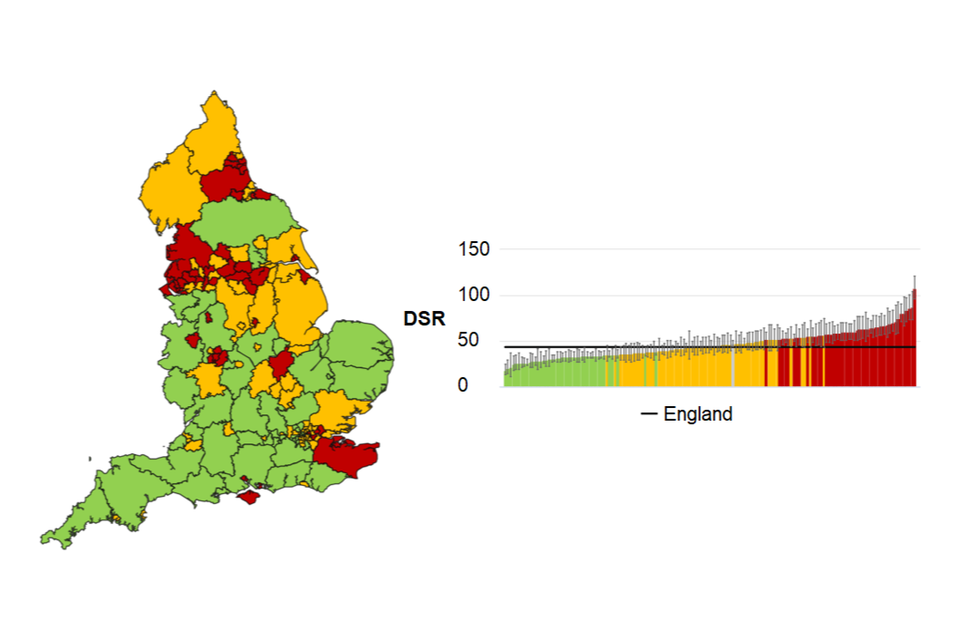
In addition, the rate of COPD mortality in the most deprived decile (68.6 per 100,000) was double the rate observed in the least deprived decile (32.8 per 100,000).
Further information
The local tobacco control profiles (LTCP) for England provide a snapshot of the extent of tobacco use, tobacco related harm, and measures being taken to reduce this harm at a local level. These profiles have been designed to help local government and health services to assess the effect of tobacco use on their local populations. They will inform commissioning and planning decisions to tackle tobacco use and improve the health of local communities.
The tool allows you to compare your local authority against other local authorities in the region and benchmark your local authority against the England or regional average.
View the LTCP.
Responsible statistician, product lead: Mark Cook.
For queries relating to this publication, please contact: Tobacco.Profiles@phe.gov.uk.