Local authority green belt statistics for England: 2020-21 - statistical release
Published 28 September 2021
Applies to England

© Crown copyright 2021
This publication is licensed under the terms of the Open Government Licence v3.0 except where otherwise stated. To view this licence, visit nationalarchives.gov.uk/doc/open-government-licence/version/3 or write to the Information Policy Team, The National Archives, Kew, London TW9 4DU, or email: psi@nationalarchives.gov.uk.
Where we have identified any third party copyright information you will need to obtain permission from the copyright holders concerned.
This publication is available at https://www.gov.uk/government/statistics/local-authority-green-belt-statistics-for-england-2020-to-2021/local-authority-green-belt-statistics-for-england-2020-21-statistical-release
1. Main points
- The extent of land designated as Green Belt in England as at 31 March 2021 was estimated at 1,614,000 hectares, around 12.4% of the land area of England.
- Overall there was a decrease of 1,750 hectares (-0.1%) in the area of land designated as Green Belt between 31 March 2020 and 31 March 2021.
- In 2020-21, 11 local authorities altered their Green Belt boundaries, with the result being a net decrease of 1,760 hectares in the overall area of land designated as Green Belt compared to 31 March 2020.
- In addition, updates to the Local Authority District (Mean High Water mark) boundaries resulted in a net increase of 10 hectares in the area of land designated as Green Belt, notably in coastal and tidal areas.
2. Context
England has a land area of just under 13,046,240 hectares [footnote 1] of which about 8% is of developed use.[footnote 2] When including land designated as Green Belt, just over 37% of the area of England (4.9 million hectares) is protected against development by one or more environmentally-protected designations. Environmentally-protected designations include National Parks, Areas of Outstanding Natural Beauty (AONBs) and Sites of Special Scientific Interest (SSSIs).
The National Planning Policy Framework states the government attaches great importance to Green Belts. The fundamental aim of Green Belt policy is to prevent urban sprawl by keeping land permanently open; the essential characteristics of Green Belts are their openness and their permanence.
Green Belt serves 5 purposes:
- to check the unrestricted sprawl of large built-up areas
- to prevent neighbouring towns merging into one another
- to assist in safeguarding the countryside from encroachment
- to preserve the setting and special character of historic towns
- to assist in urban regeneration, by encouraging the recycling of derelict and other urban land
Once Green Belts have been defined, local planning authorities should plan positively to enhance their beneficial use, such as looking for opportunities to provide access; to provide opportunities for outdoor sport and recreation; to retain and enhance landscapes, visual amenity and biodiversity; or to improve damaged and derelict land.
Once established, Green Belt boundaries should only be altered where exceptional circumstances are fully evidenced and justified, through the preparation or updating of plans. Strategic policies should establish the need for any changes to Green Belt boundaries, having regard to their intended permanence in the long term, so they can endure beyond the plan period. Where a need for changes to Green Belt boundaries has been established through strategic policies, detailed amendments to those boundaries may be made through non-strategic policies, including neighbourhood plans.
Inappropriate development is, by definition, harmful to the Green Belt and should not be approved except in very special circumstances.
When considering any planning application, local planning authorities should ensure that substantial weight is given to any harm to the Green Belt. ‘Very special circumstances’ will not exist unless the potential harm to the Green Belt by reason of inappropriateness, and any other harm resulting from the proposal, is clearly outweighed by other considerations.
2.1 Related publications
It is useful to consider this statistical release alongside other statistical releases published by the department. The Land Use statistical release provides a breakdown of land uses within the Green Belt at local authority level. The Land Use Change statistical release provides information on the proportion of new residential addresses created within the Green Belt and the previous use of the land on which the new residential addresses were created, also at local authority level.
3. Extent of the Green Belt as at 31 March 2021
The extent of land designated as Green Belt in England as at 31 March 2021 is shown in Map 1, below. It was estimated at 1,614,000 hectares, around 12.4% of the land area of England. A regional breakdown of the number of hectares designated as Green Belt and the proportion of the total regional land area designated as Green Belt is shown below in Table 1.
The table shows the South East has the largest area of land designated as Green Belt with 305,600 hectares, followed by the West Midlands with 264,980 hectares and Yorkshire and The Humber with 262,500 hectares. Out of the 9 regions, London has the smallest area of land designated as Green Belt with 34,790 hectares but has the highest proportion of its total land area designated as Green Belt with 22.1%. The region with the smallest percentage is the South West with land designated as Green Belt accounting for 4.5% of its total land area.
Table 1: Regional breakdown of Green Belt land
| Region | Green Belt area (hectares) | Percentage of total land area |
|---|---|---|
| England | 1,614,000 | 12.4 |
| East Midlands | 77,500 | 5.0 |
| East of England | 233,290 | 12.2 |
| London | 34,790 | 22.1 |
| North East | 71,840 | 8.4 |
| North West | 255,900 | 18.1 |
| South East | 305,600 | 16.0 |
| South West | 107,610 | 4.5 |
| West Midlands | 264,980 | 20.4 |
| Yorkshire and The Humber | 262,500 | 17.0 |
Note: hectarage figures are rounded to the nearest 10 hectares.
Map 1: Extent of Green Belt as at 31 March 2021
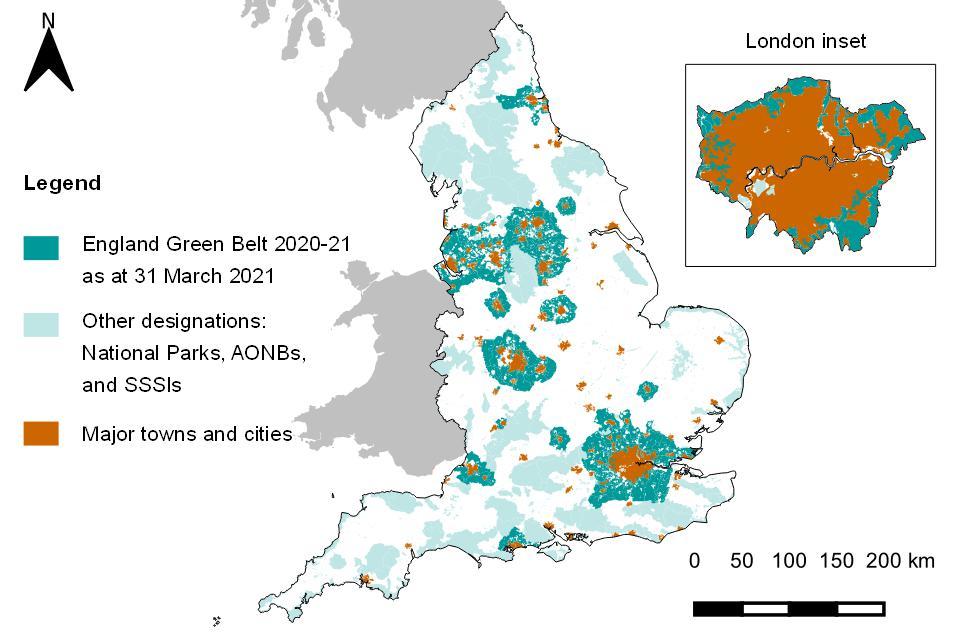
3.1 Urban core areas
Areas of land designated as Green Belt are, in practice, clustered around 16 built-up areas, as can be seen from the teal areas on Map 1. Although such areas have no formal statutory definition, they are generally known as ‘urban cores’. These urban cores are listed in Table 4, which also provides the amount of land designated as Green Belt that is associated with each urban core. The Metropolitan Green Belt (London) is the largest area of land designated as Green Belt surrounding an urban core equating to just under 31.5% of the England total. Merseyside and Greater Manchester is the second largest with 15.4% along with South and West Yorkshire also with 15.3% (after rounding).
The ‘Area by LA’ table in the Accompanying tables shows estimates of the area of Green Belt land in each of the 180 out of the 314 local authorities that had some land designated as Green Belt as at 31 March 2021. The ‘Change in area by LA’ table in the Accompanying tables compares estimates as at 31 March 2021 with the revised estimates as at 31 March 2020 by local authority.
3.2 Changes in methodology
A methodological change was introduced as part of last year’s statistical release providing general improvements to mapping accuracy, boundary definitions and area calculations. The area of land designated as Green Belt for each local authority was previously calculated by local authorities but is now calculated by the Department using the digital Green Belt boundary files provided by the local authorities. The local authority Green Belt boundaries are mapped against ONS Local Authority District (Mean High Water mark) boundaries [footnote 3] for the corresponding period. This results in greater accuracy in the delimiting of land designated as Green Belt where it meets coastal or estuarine areas and ensures a consistent national approach.
The Department for Levelling Up, Housing and Communities have applied the changes in methodology to the Green Belt data for previous years to ensure a consistent time series. Revisions have been made to the hectarage figures from 2013-14 onwards allowing users to better track the changes to the Green Belt over time.
The Net Changes section has been amended to record the year on year net change made to the area of land designated as Green Belt resulting from local authority designation policies and net changes resulting from updates made to the Local Authority District (Mean High Water mark) boundaries for the corresponding period.
4. Net changes
Overall, there was a decrease of 1,750 hectares (-0.1%) in the area of land designated as Green Belt in England between 31 March 2020 and 31 March 2021.
In 2020-21, 11 local authorities altered their Green Belt boundaries resulting in a decrease of 1,760 hectares in the overall area of land designated as Green Belt compared to 31 March 2020. The changes are set out in Table 2. There may be discrepancies between individual figures due to rounding, with all figures rounded to the nearest 10 hectares.
Table 2: Local authorities which adopted new boundaries for designated land as Green Belt 2020-21
| Local Authority | Area of designated Green Belt land 31 March 2020 (hectares) | Area of designated Green Belt land 31 March 2021 (hectares) | Change from 31 March 2021 (hectares) |
|---|---|---|---|
| Broxbourne | 3,330 | 2,830 | -490 (-15%) |
| Cherwell | 8,410 | 8,140 | -280 (-3%) |
| Chesterfield | 1,440 | 1,440 | 10 (0%) |
| County Durham | 8,720 | 8,580 | -130 (-2%) |
| Gateshead R | 8,530 | 8,530 | 0 (0%) |
| Harlow | 630 | 460 | -170 (-27%) |
| Lancaster | 1,740 | 1,540 | -200 (-11%) |
| New Forest | 5,110 | 4,970 | -140 (-3%) |
| Oxford | 1,270 | 1,270 | 0 (0%) |
| Runnymede | 6,130 | 5,800 | -330 (-5%) |
| Staffordshire Moorlands | 17,430 | 17,390 | -30 (0%) |
Note: hectarage figures are rounded to the nearest 10 hectares
R Local authority estimate for 2019-20 also revised
Of the 11 local authorities reporting changes to their land designated as Green Belt, Broxbourne contributed 28% of this change alone, with a reduction in its Green Belt of 15%.
The reported decrease of 1,760 hectares of land designated as Green Belt during 2020-21 is the third smallest decrease resulting from local authority designation policies since 2013-14 and follows 3 consecutive years of net decreases in excess of 3,500 hectares. The number of local authorities making changes to land designated as Green Belt has also increased in recent years, particularly from 2014-15 onwards: see Table 3. For the local authorities making changes to their Green Belt boundaries, extracts have been taken from each authority’s local plan to provide an explanation for the change. They are detailed in Annex A.
Updates made to the Local Authority District (Mean High Water mark) boundaries resulted in a net increase of 10 hectares in the area of land designated as Green Belt, notably in coastal and tidal areas where the Mean High Water mark (average high-tide line) can shift year on year. There were no significant changes this year. A breakdown of these net changes are provided at local authority level within the ‘Change in area’ in the Accompanying tables.
A timeline showing the breakdown of net change reported in each year (from 2013-14 onwards), reflecting subsequent revisions made to the accuracy of the estimates of Green Belt in each year can be seen in Table 3.
Table 3: National summary of net changes to land designated as Green Belt
| Year | Number of local authorities changing their Green Belt | Net change from Local Authority designation policies (hectares) | Net change from Local Authority digital boundary (hectares) | Total net change (hectares) |
|---|---|---|---|---|
| 2013-14 | 3 | -530 | -5,240 | -5,770 |
| 2014-15 | 11 | -1,890 | 0 | -1,890 |
| 2015-16 | 8 | -1,070 | 40 | -1,030 |
| 2016-17 | 8 | -1,190 | 10 | -1,180 |
| 2017-18 | 10 | -6,090 | -20 | -6,110 |
| 2018-19 | 13 | -3,860 | 0 | -3,860 |
| 2019-20 | 15 | -3,170 | -350 | -3,520 |
| 2020-21 | 11 | -1,760 | 10 | -1,750 |
Note: hectarage figures are rounded to the nearest 10 hectares
5. Revisions to 2019-20 estimates
Revisions are made each year to the published estimates for the previous year in order to accurately calculate the net change in Green Belt area. The revised Green Belt in England as at 31 March 2020 is estimated at 1,615,750 hectares. This is a decrease of 50 hectares on the previous estimate of 1,615,800 hectares published in September 2020.
Two revisions have been reported with the majority due to the methodology changes introduced as part of this year’s release. A summary of the scale of revisions over the preceding statistical releases, is available under the ‘Scale of revisions’ heading in the Technical notes section.
6. Longer term changes
Statistics on the area of Green Belt are available back to 1997, in the ‘Area since 1997 - England’ table of the Accompanying tables. Figures are, however, available on a consistent basis only from 2006, following the designation of 47,300 hectares of Green Belt land as part of the New Forest National Park in 2005. Those from 31 March 2015 are set out in Table 4, broken down by urban core.
Table 4: Trend in the area of land designated as Green Belt as at 31 March since 2014-15
| Urban core | 2014-15 | 2015-16 | 2016-17 | 2017-18 | 2018-19 | 2019-20 | 2020-21 |
|---|---|---|---|---|---|---|---|
| England | 1,631,500 | 1,630,470 | 1,629,290 | 1,623,180 | 1,619,320 | 1,615,750 | 1,614,000 |
| Bath and Bristol | 71,710 | 71,710 | 71,710 | 71,710 | 71,700 | 71,710 | 71,710 |
| Birmingham | 231,400 | 231,320 | 230,670 | 227,640 | 227,440 | 227,050 | 227,050 |
| Blackpool | 2,580 | 2,580 | 2,590 | 2,590 | 2,520 | 2,510 | 2,510 |
| Burton-upon-Trent and Swadlincote | 730 | 730 | 730 | 730 | 730 | 730 | 730 |
| Cambridge | 26,160 | 26,160 | 26,160 | 26,150 | 26,100 | 26,100 | 26,100 |
| Carnforth, Lancaster and Morecambe | 1,740 | 1,740 | 1,740 | 1,740 | 1,740 | 1,740 | 1,540 |
| Cheltenham and Gloucester | 7,490 | 7,490 | 7,490 | 6,230 | 6,190 | 6,190 | 6,190 |
| Derby and Nottingham | 60,720 | 60,720 | 60,710 | 60,710 | 60,510 | 59,950 | 59,950 |
| London | 513,260 | 513,270 | 513,220 | 513,050 | 511,310 | 509,110 | 508,120 |
| Merseyside and Greater Manchester | 251,620 | 250,840 | 250,840 | 249,370 | 249,360 | 249,300 | 249,300 |
| Oxford | 35,000 | 35,000 | 34,910 | 34,910 | 34,910 | 34,760 | 34,490 |
| South and West Yorkshire | 249,610 | 249,430 | 249,040 | 249,000 | 247,500 | 247,410 | 247,410 |
| South West Hampshire | 34,850 | 34,850 | 34,840 | 34,840 | 34,780 | 34,810 | 34,680 |
| Stoke-on-Trent | 44,470 | 44,470 | 44,470 | 44,440 | 44,450 | 44,450 | 44,420 |
| Tyne and Wear | 72,300 | 72,300 | 72,300 | 72,190 | 72,120 | 71,980 | 71,840 |
| York | 27,870 | 27,870 | 27,870 | 27,870 | 27,970 | 27,970 | 27,970 |
Note: figures are rounded to the nearest 10 hectares
R Revised (in this publication) since the original estimate was published
7. Accompanying tables and spatial boundary files
Additional tables, on total area and changes to land designated as Green Belt (annual), are available to download alongside this release. The tables are as follows:
| Table name | Table description | |
|---|---|---|
| Area by LA | Land designated as Green belt - area by local authority as at 31 March 2021 | |
| Change in area by LA | Change in Green Belt area between 31 March 2020 and 31 March 2021 | |
| Area since 1997 | Area of Green Belt land since 1997, England | |
| Area by PCON | Land designated as Green belt - area by parliamentary constituency as at 31 March 2021 | |
| Land designations by LA | Land designated as Green Belt and other designations including National Parks, Areas of Outstanding Natural Beauty and Sites of Special Scientific Interest - area by local authority as at 31 March 2021 | |
| Area by LA 2013-14 to 2020-21 .csv | Designated Green Belt land - area by local authority (annually) from 31 March 2014 to 31 March 2021 |
In addition, spatial data files setting out the extent of local authority Green Belt boundaries are available at https://data.gov.uk/.
8. Uses of the data
In general, the Green Belt statistics are used by government ministers, officials within the Department for Levelling Up, Housing and Communities, other government departments, local authorities including planning departments, the media, charities and house builders.
More specifically, the local authority Green Belt spatial boundaries, collected as part of this release are used in the preparation of other statistical releases published by the Department for Levelling Up, Housing and Communities. The Land Use Change statistics (LUCs) use the Green Belt boundaries to determine the proportion of new residential addresses created within the Green Belt, and the previous land use those addresses were created on. The Land Use statistics use the Green Belt boundaries to calculate proportions of various land use classes within the Green Belt.
The summary statistics for the Land Use Change statistics and the Land Use statistics within land designated as Green Belt are as follows:
- In 2017-18, 2% of new residential addresses created were within the Green Belt.
- In 2017-18, 53% of new residential addresses created within the Green Belt were built on previously developed land.
- In 2018, 7% of land designated as Green Belt in England was of developed use with 93% of land of non-developed use.
- Of the Green Belt land area, 0.3% is of a residential use with residential gardens accounting for a further 2.9%.
Detailed statistics on changes within the Green Belt can also be found in the Land Use Change Live Tables, numbers P310, P311 and P380 to P383.
Detailed statistics on land uses within the Green Belt can also be found in the Land Use in England 2018 Live Tables P401a and P401b.
Green Belt statistics are often quoted alongside statistics for other designations. These designations are often considered constraints on development with the statistics providing the amount of land ‘protected’ against development. These other designations do vary but normally include environmentally-protected designations such as National Parks, Areas of Outstanding Natural Beauty (AONBs) and Sites of Special Scientific Interest (SSSIs). Statistical information on these other designations can be found within the ‘Land designations by LA’ table in the Accompanying tables and within the Green Belt and other designations interactive dashboard.
The Green Belt boundaries and statistics are closely aligned with local plans and local planning. The Green Belt boundaries were used to help determine Local Housing Need numbers and feed into a number of other related housing and development related projects.
8.1 Annex A: explanation of changes in 2020-21
The following extracts have been taken from published versions of local authority local plan documents, with the exception of the entry for Cherwell, which comprises previously unpublished information submitted on the authority’s AGB return.
Broxbourne Borough Council
The new local plan was adopted on 23 June 2020.
Broxbourne’s countryside is all contained within the Metropolitan Green Belt. Whilst the Council will continue to protect the majority of the Green Belt, it has not been possible to meet the Borough’s development needs without releasing significant areas of land from it. National policy requires that Green Belt boundaries should only be altered in exceptional circumstances taking account of the need to promote sustainable patterns of development. In preparing this Local Plan the Council has therefore paid very close regard to selecting Green Belt areas for development where those developments have the greatest potential to deliver the most sustainable outcomes for Broxbourne.
Cherwell District Council
A partial review of the local plan was adopted on 7 September 2020.
The Cherwell Local Plan 2011-2031 (Part 1) Partial Review - Oxford’s Unmet Housing Need was formally adopted as part of the statutory Development Plan by the Council on 7 September 2020. The Plan allocated 6 strategic sites within the Green Belt and consequently removed 280 hectares of land designated as Green Belt. Please see Policy PR3: The Oxford Green Belt for further information.
Chesterfield Borough Council
The new local plan was adopted on 15 July 2020
As there is sufficient land outside the Green Belt to meet the borough’s housing and employment land needs, it is not necessary to review the Green Belt at this time. The council has, however, agreed to a joint methodology as part of Sheffield City Region which would guide a review if and when this occurs. There is no current plan or timeframe to review the Green Belt, but the Council is committed to working with partners on a strategic review in the future. It is not proposed to delete any areas of land from the Green Belt, except where minor adjustments are necessary to reflect current anomalies e.g. garden extensions.
A small area of land close to Staveley was designated as Green Belt, leading to an increase in Chesterfield’s total Green Belt area.
Durham County UA
The new local plan was adopted on 21 October 2020
In order to meet housing need and to promote sustainable patterns of development, land at Sniperley Park and Sherburn Road, as shown on the policies map, are allocated for planned urban extensions and will be removed from the Green Belt. Development is required to be comprehensively masterplanned and to demonstrate how the phasing of development on these sites will have regard to the provision and timing of the infrastructure and services necessary to support them.
Gateshead Metropolitan Borough Council
Part 3 of the local plan was adopted on 1 February 2021.
The Green Belt boundary has been amended in order to meet Gateshead’s objectively assessed needs for employment and housing. In addition there have been minor changes to the boundaries either arising from the identification of sites, or to ensure land is included or excluded from the Green Belt in accordance with national guidance on the purposes of including land in the Green Belt and the use of suitable features to form boundaries
Harlow District Council
The new local plan was adopted on 10 December 2020.
Given the level of housing need, it was decided that exceptional circumstances for Green Belt release existed to the east of Harlow, and this land was therefore released in order to meet the Objectively Assessed Housing Need (OAHN). This land is allocated as the district’s Strategic Housing Site. The existing Green Wedge will be extended to run eastwards through the site.
In addition to the release of the land for the Strategic Housing Site East of Harlow from the Green Belt, further minor changes to the Green Belt boundaries have been made to take account of:
(a) the proposed Garden Town Community in the Epping Forest district west of Harlow
(b) existing development in the Green Belt
(c) to establish stronger, more clearly defined boundaries following physical features on the ground
Lancaster City Council
The new local plan was adopted on 29 July 2020.
The Green Belt boundary has been amended to the north of Lancaster, between the urban fringes of Lancaster and the new Bay Gateway Link Road. There has been significant change in this area due to the construction of the new road that has radically altered the value of the Green Belt purposes in this area, leading to the Green Belt Review concluding low values for this area. The area has been identified for residential purposes, elements of which have also been designated as Urban Setting Landscape (USL). Land to the east will be identified as an area of separation to ensure that a green gap is maintained between Lancaster and Halton.
The Green Belt boundary to the east of Torrisholme has been amended to provide a more definable Green Belt boundary making use of the West Coast Mainline. This provided a more robust and permanent boundary that will not be vulnerable to future encroachment. The land that has been removed from the Green Belt will not be identified for development purposes and is identified as open countryside. This area of land has been designated as Key Urban Landscape. The land at Torrisholme Barrow will be protected as an area of open space and as a Scheduled Ancient Monument due to its recreational and historical importance.
New Forest District Council
The new local plan was adopted on 6 July 2020
This Local Plan Review included the first full review in 2016 of the South-West Hampshire Green Belt since the formation of the New Forest National Park, in recognition that there was unlikely to be sufficient, suitable development land to meet development needs unless the release of Green Belt land for development was considered. The 2016 review concluded that most of the Green Belt continues to serve the purposes of the Green Belt very well, but also identified some areas that made a weaker contribution to Green Belt purposes. Those areas considered by the Council to make a weaker contribution that were also in appropriate locations for strategic housing development have been removed from the Green Belt.
Oxford City Council
The new local plan was adopted on 8 June 2020
Through a Green Belt review process associated with the preparation of this Local Plan some sites in the Oxford Green Belt have been identified for release. Details of the approach to particular sites proposed for release from the Green Belt and of the sites released from the Green Belt are given in Chapter 9. It is important that the remaining areas of Green Belt are protected in accordance with the National Planning Policy Framework, in order that their function and purpose of protecting Oxford’s historic setting is retained.
Runnymede Borough Council
The new local plan was adopted on 16 July 2020
The spatial strategy for Runnymede is to continue to focus development in the Borough’s existing urban areas over the period of the Local Plan. Given, however, the significant level of housing need which exists in the Borough, as evidenced through the Runnymede-Spelthorne Strategic Housing Market Assessment (SHMA), it is evident that there needs to be a step change in housing delivery in Runnymede. This step change can only be achieved through the release of a number of sites from the Green Belt on adoption of the Local Plan and allocating them to meet identified housing (and employment) needs. This includes a new Surrey village, at Longcross Garden Village, becoming one of the first of 14 nationwide, which also contains an Enterprise Zone of new business adjacent to Longcross Station.
Staffordshire Moorlands District Council
The new local plan was adopted on 9 September 2020
The distribution of housing development largely adheres to the approach of the Core Strategy with minor adjustments to Cheadle and the Rural Areas. The Rural Areas share of the District’s housing requirement is reduced from 28% to 25% in order to reflect the constrained supply of suitable sites. However, it is not possible to meet identified development requirements without Green Belt release. The adopted Core Strategy anticipated that Green Belt release would be necessary with a commitment for a comprehensive review of the Green Belt in Biddulph. In the preparation of the Local Plan, the Council considered alternatives including inviting relevant neighbouring authorities to accommodate some of the District’s requirements, allocating a high-density site in Biddulph and alternative options for the distribution of development within the District. Whilst these measures reduced the amount of Green Belt release, some release of land is still required in the District to support the development requirements and associated economic and social benefits for the District.
Staffordshire Moorlands local plan
9. Technical notes
Please see the accompanying technical notes document for further details.
10. Enquiries
Date of next release: September/October 2022
Media enquiries: 0303 444 1209 newsdesk@communities.gov.uk
Public enquiries and responsible statistician: Alex Reynolds
Email: planning.statistics@communities.gov.uk
Information on Official Statistics is available via the UK Statistics Authority website.
Information about statistics at the Department of Levelling Up, Housing and Communities is available via the Department’s website.