Local authority and children's homes in England inspections and outcomes autumn 2018: main findings
Updated 21 September 2020
Applies to England

© Crown copyright 2020
This publication is licensed under the terms of the Open Government Licence v3.0 except where otherwise stated. To view this licence, visit nationalarchives.gov.uk/doc/open-government-licence/version/3 or write to the Information Policy Team, The National Archives, Kew, London TW9 4DU, or email: psi@nationalarchives.gov.uk.
Where we have identified any third party copyright information you will need to obtain permission from the copyright holders concerned.
This publication is available at https://www.gov.uk/government/statistics/local-authority-and-childrens-homes-in-england-inspections-and-outcomes-autumn-2018/local-authority-and-childrens-homes-in-england-inspections-and-outcomes-autumn-2018-main-findings
This release covers:
-
Inspections and outcomes for local authority children’s services inspections between 1 April 2018 and 30 September 2018, published by 31 October 2018 (provisional data)
-
Inspection and outcomes for local authority children’s services inspections as at 30 September 2018 and published by 31 October 2018 (provisional data)
-
Inspection outcomes of the most recent inspection, for all children’s homes, as at 30 September 2018 and published by 31 October 2018 (final data)
-
Inspections and outcomes for all children’s homes between 1 April 2018 to 30 September 2018, published by 31 October 2018 (provisional data)
The overall effectiveness profile of local authorities (LAs) has improved.
As at 30 September 2018, 43% of LAs were judged to be good or outstanding, an increase from 36% after every LA’s first SIF inspection.
2 LAs are now judged outstanding for help and protection.
For the first time, 2 LAs have been judged outstanding for the ‘children in need of help and protection’ sub judgement.
The proportion of all children’s homes judged good or outstanding remains the same as last year.
At 30 September 2018, 82% of homes were judged good or outstanding. This was the same picture as at 31 March 2018 and 30 September 2017.
Figure 1: Local authority overall effectiveness at 30 September 2018
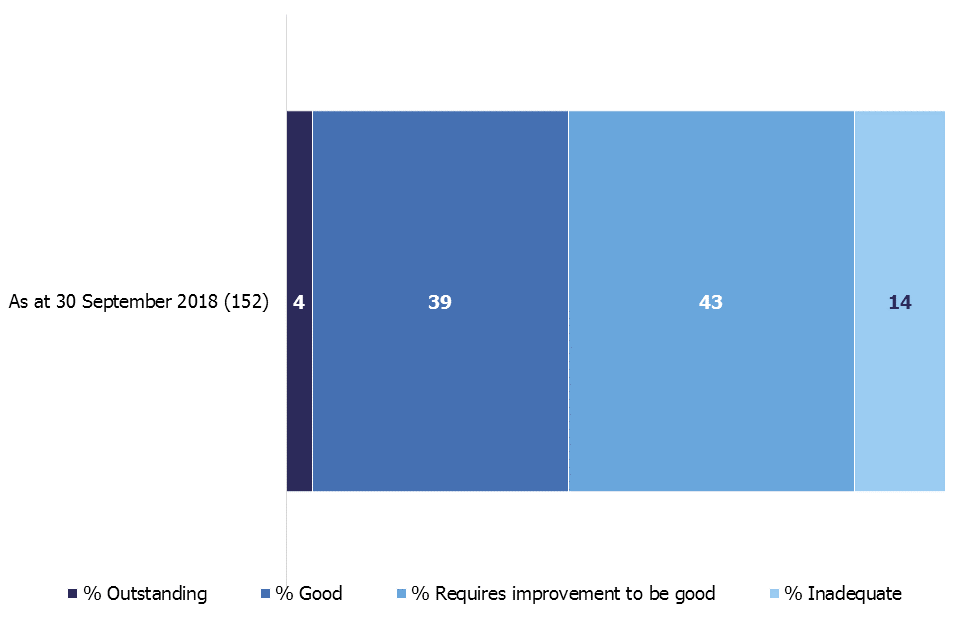
This figure shows the proportion of local authorities judged outstanding, good, requires improvement to be good, and inadequate as at 30 September 2018.
1. Introduction
This release contains data on all children’s homes inspections and local authority (LA) inspections. Ofsted inspects the 152 LAs in England responsible for ensuring and overseeing the effective delivery of social care services for children. These inspections are of LA services for children who need help and protection, children looked after, and care leavers, under the inspections of local authority children’s services (ILACS) framework. This inspection cycle began in January 2018.
Children’s homes all receive a full inspection, and certain homes receive an interim inspection, on an annual cycle. Children’s homes may receive additional concern-driven inspections. Ofsted use a risk-based approach to inspecting children’s homes. For more information, see the social care common inspection framework (SCCIF).
Children’s homes are made up of 3 different sub-types of homes:
- children’s homes – these are most of the homes in England and are defined as any home that does not fall within the other 2 sub-types below, that is, is not a residential special school registered as a children’s home and is not a secure children’s home
- residential special school registered as a children’s home – these are residential schools which, due to the number of days they look after children, must register as children’s homes
- secure children’s homes
All children’s homes cater for a variety of children and young people with varying difficulties, disabilities or disorders. These include, for example, emotional and/or behavioural difficulties, mental health problems, sensory impairment, and learning difficulties.
Unless otherwise stated, 2017 to 2018 refers to 1 April 2017 to 31 March 2018. The ‘period’ referred to throughout is the first 6 months in 2018 to 2019: 1 April 2018 to 30 September 2018.
2. Inspection of local authority children’s services
There are approximately 12 million children living in England, of whom, at any one time, just over 3% are in the social care system (classified as children in need).
2.1 Overall local authority effectiveness as at 30 September 2018
The picture for all local authorities as at 30 September 2018 has improved, with 43% of LAs now judged to be good or outstanding. After every LA’s first single inspection framework (SIF) inspection, this was 36%.
There was also a fall in the percentage judged inadequate, decreasing to 14% from 22% after every LA’s first SIF.
Figure 2: Local authority overall effectiveness after every LA’s first single inspection framework (SIF) inspection and at 30 September 2018
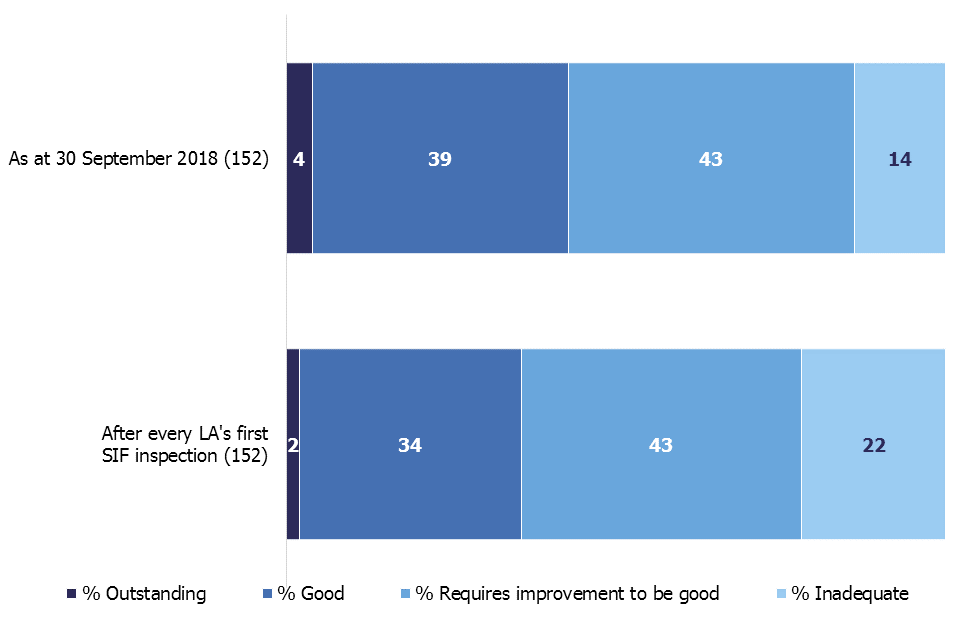
This figure shows that local authority overall effectiveness as at 30 September 2018 has improved since after every LA's first SIF inspection.
As the map below shows, the different inspection judgements are spread across the country.
Figure 3: Local authority overall effectiveness judgements as at 30 September 2018
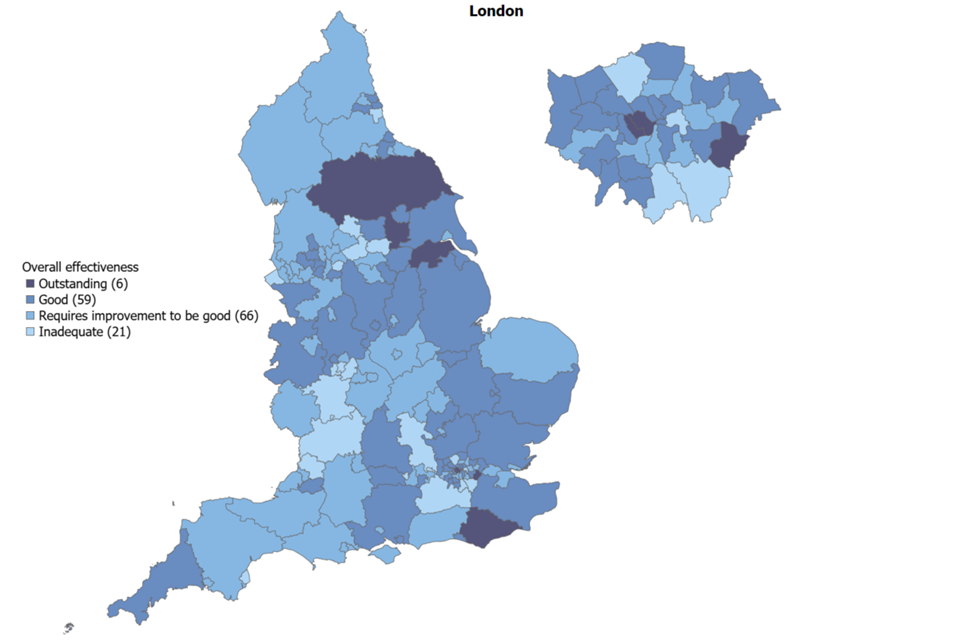
This map shows how inspection judgements are spread across every local authority in the country.
2.2 Sub judgements as at 30 September 2018
Under the new ILACS programme, the sub judgements for ‘children in need of help and protection’ and ‘children in care and care leavers’ remain comparable to the sub judgements for ‘children who need help and protection’ and ‘children looked after and achieving permanence’ in the SIF. For both sub judgements, the percentage of LAs judged to be good or outstanding has increased, to 32% for help and protection, and 42% for children in care and care leavers. In the sub judgement of children in need of help and protection, 2 LAs (Bexley and North Yorkshire) are now judged to be outstanding: this is the first time this judgement has been given in this area.
2.3 Inspections of local authority children’s services (ILACS)
The ILACS framework, which replaced the SIF programme, has been in place since the beginning of 2018. During that period, Ofsted has visited 91 LAs. These visits included 50 focused and 44 monitoring visits, 4 short and 15 standard ILACS inspections and 7 SIF re-inspections.
Figure 4: Local authority visits and inspections, January to September 2018
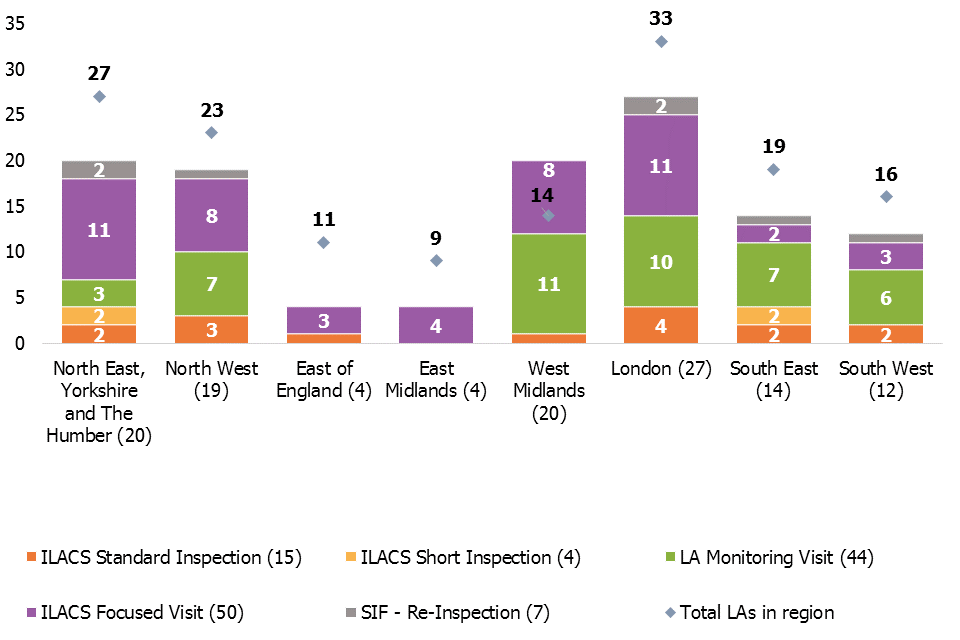
This figure shows that the LA visits and inspections that took place between January and September 2018 range from four to twenty-seven across the regions.
Note that some LAs will have received multiple visits and/or inspections in the period, so the total number of visits/inspections may not reflect the total number of LAs in the region.
2.4 Inspections of local authority children’s services (ILACS) short and standard inspections and visits
Since the ILACS framework came into effect in January 2018, Ofsted has conducted 19 ILACS inspections. The 4 short inspections were of LAs previously judged good for overall effectiveness, and the 15 standard inspections were of LAs previously judged requires improvement to be good.
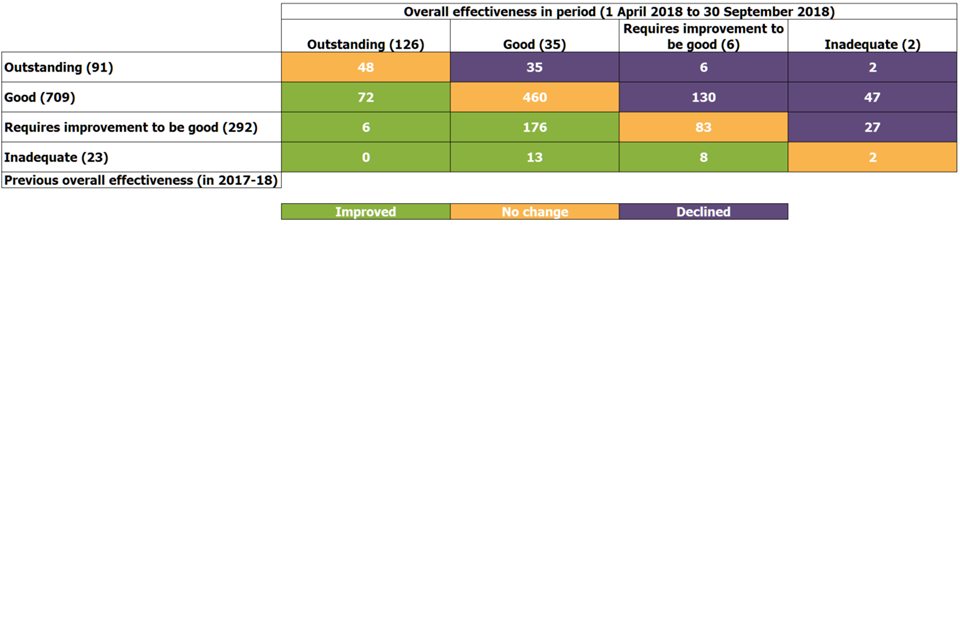
Of these 19 LAs: 10 improved at their ILACS inspection; 7 retained the same judgement; and 2 declined, both from requires improvement to be good to inadequate. One of the 10 LAs which improved did so from requires improvement to be good to outstanding (Bexley).
Table 1: Change in overall effectiveness from single inspection framework inspection to Inspections of Local Authority Children’s Services
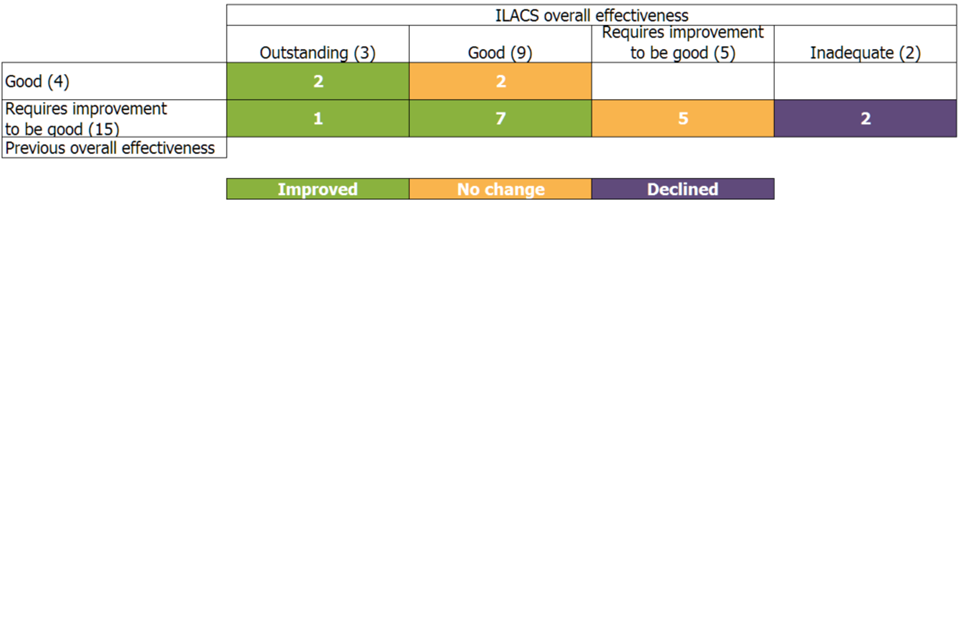
This table shows that ten local authorities improved their overall effectiveness from their SIF inspection to their ILACS inspection.
2.5 Local authority monitoring visits
Since the start of the ILACS framework, Ofsted has carried out 44 monitoring visits. Monitoring visits, which are carried out on a quarterly basis to LAs judged inadequate, are discussed in more detail in Ofsted’s 2017/18 annual report.
2.6 Inspections of local authority children’s services focused visits
Since their introduction under the ILACS framework in January 2018, Ofsted has carried out 50 focused visits. Focused visits are for inspectors to evaluate an aspect of service, a theme, or the experiences of a cohort of children.
The “front door” was a particularly common theme for visits, accounting for 42% (21 LAs). Least common was children in care, accounting for only 4% of visits (2 LAs).
Table 2: Theme, aspect of service, or experience of a cohort of children looked at on focused visits, January to September 2018
| Area looked at | Number of visits |
|---|---|
| Front door | 21 |
| Children in need/subject to a plan | 12 |
| Care leavers | 7 |
| Achieving permanence | 4 |
| Vulnerable adolescents | 4 |
| Children in care | 2 |
| Total focused visits | 50 |
3.1 Overall experiences and progress of children and young people for all children’s homes
There are 2 ways to look at information about the overall experiences and progress of children and young people judgement (overall effectiveness) for all children’s homes:
State of the nation
This looks at all providers active on 30 September 2018, and what their most recent inspection judgement was at this date. For all but 3 providers (who received an overall effectiveness judgement at their most recent monitoring inspection) this was their most recent full inspection. Providers inspected prior to 1 April 2018, but not since, will have their previous judgement included.
In year/relevant period
This looks at all inspections that took place in a set period of time. In this release that period is between 1 April 2018 and 30 September 2018. This will include providers that closed before the end of the period. Some providers will have had more than one inspection, since homes found at some point to be inadequate, or homes for which concerns were raised, required additional inspections. Some providers will be excluded as they were not inspected in the period, since children’s homes are inspected on a 12 month cycle and this release covers the first six months of that period.
See Inspection of children’s homes framework for inspection from 1 April 2018 for further details on grading inspection findings.
3.2 State of the nation for all children’s homes
On 30 September 2018, 95% of all active children’s homes had received a full inspection. One hundred and fourteen newly registered children’s homes had not yet been judged as they were newly opened homes: they are excluded from the following analysis.
Most children’s homes (82%) had an overall effectiveness judgement of good or outstanding. This was the same picture as at 30 September 2017 and 31 March 2018.
Figure 5: All children’s homes overall effectiveness at their most recent inspection, as at 30 September 2018
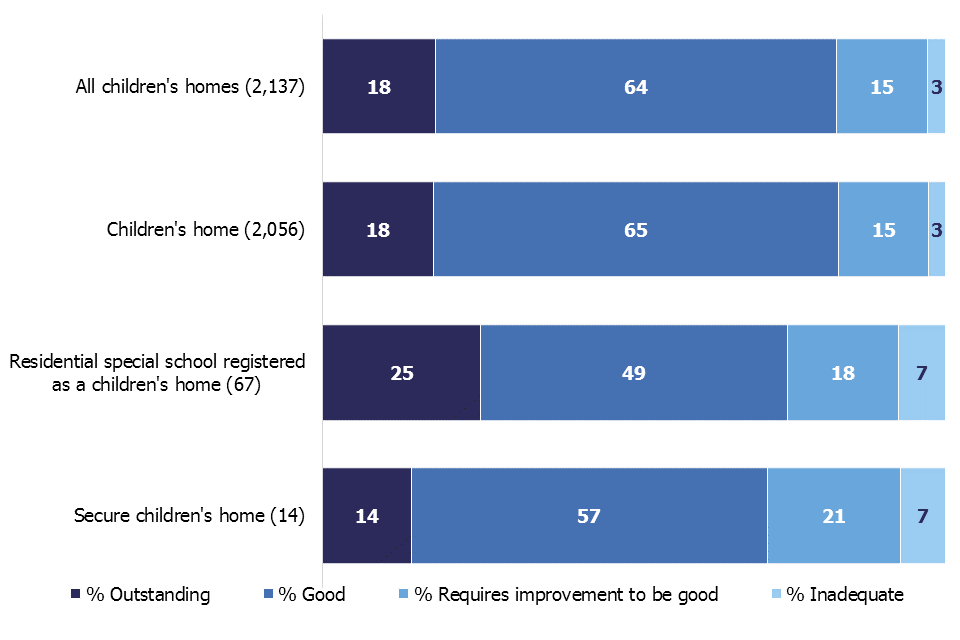
This figure shows that while the overall effectiveness of all children's homes at their most recent inspection has remained the same as in 2017, the picture looks different across the three sub-types.
Compared to 30 September 2017, although the overall picture has stayed the same, there have been changes to the state of nation for the 3 sub-types of homes. The proportion of secure children’s homes judged good or outstanding decreased by 14 percentage points due to 2 homes declining to requires improvement to be good. The proportion of good or outstanding residential schools registered as children’s homes decreased by 6 percentage points, while the proportion of children’s homes judged good or outstanding increased by 1 percentage point.
3.3 Regional outcomes for all children’s homes
Children’s homes are not spread evenly across the country, with 24% in the North West and 5% in London.
Figure 6: All children’s homes overall effectiveness at their most recent inspection, as at 30 September 2018, by region
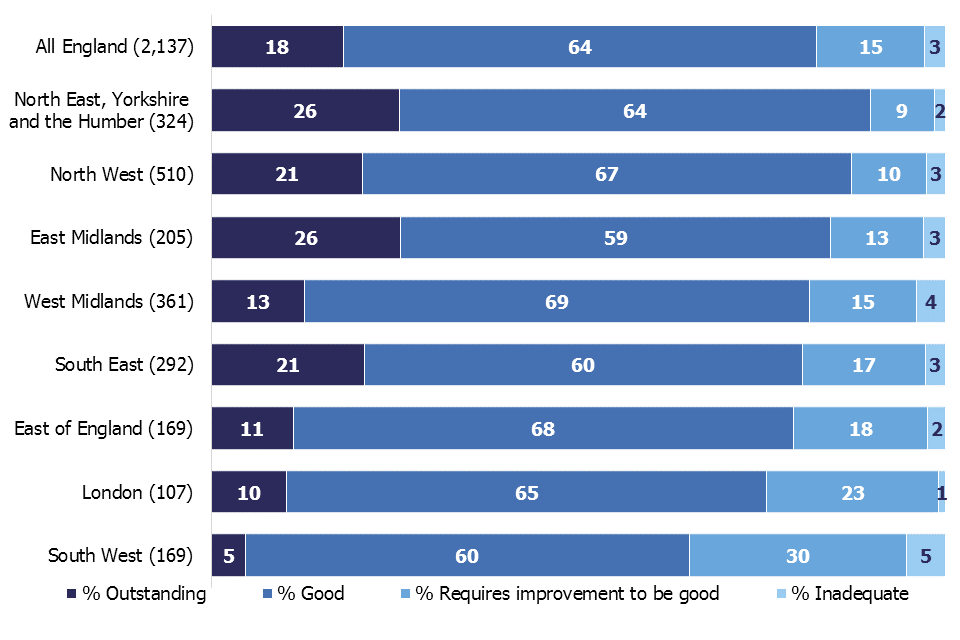
This figure shows that the proportion of homes judged good or outstanding at their most recent inspection ranges from 65% in the South West to 90% in the North East, Yorkshire and the Humber.
Three regions saw small increases in the percentage of all children’s homes judged good or outstanding since the same date last year, while 3 regions saw small decreases. The percentage of homes judged good or outstanding in the North West and North East, Yorkshire and the Humber remained the same as last year.
3.4 All children’s homes inspections in the period
Between 1 April 2018 and 30 September 2018, there were 1,225 full inspections of all children’s homes.
Figure 7: All children’s homes overall effectiveness, comparing 6 month periods
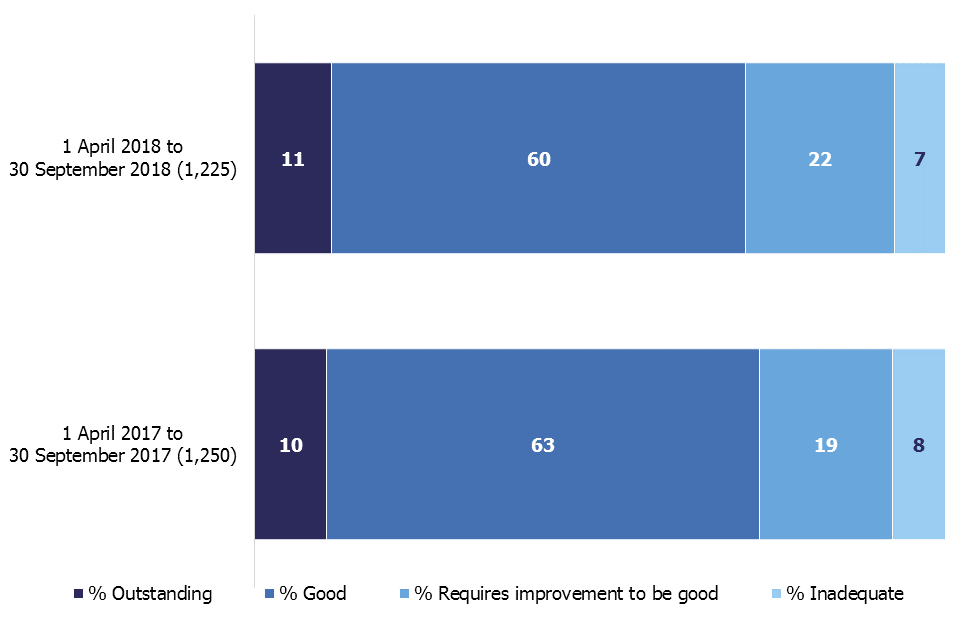
This figure shows the overall effectiveness of the 1,225 full inspections of children’s homes between 1 April 2018 and 30 September 2018.
There were 2 homes that received overall effectiveness judgements at a monitoring visit. Analysis in the period only includes full inspections, so these monitoring visit overall effectiveness judgements have been excluded from the data.
The percentage of inspections at which the home was judged good or outstanding was 71%: 2 percentage points lower than in this period last year. The percentage of inspections at which the home was judged inadequate was 7% (90), compared to 8% (96) in the same period last year.
Twenty-nine homes had 2 full inspections in the 6 month period: all 29 had been judged inadequate, including each of their sub judgements, at their first inspection in the period. Most (86%) of these 29 homes improved after re-inspection, with only 4 homes remaining inadequate.
3.5 Overall effectiveness for all children’s homes – change since 2017 to 2018 inspection
Of the 1,196 providers that had a full inspection in the period (1 April to 30 September 2018), 1,115 also had a full inspection in the previous year (1 April 2017 to 31 March 2018).
Table 3: Change to overall effectiveness compared to previous inspection
This table shows that the proportion of homes judged to have stayed the same was 53%, with 25% of homes improving and 22% declining.
If the provider had more than one full inspection in 2017 to 2018, the latest full inspection judgement has been used in the table above. If the provider has had more than one full inspection in the period (1 April to 30 September 2018), the first full inspection judgement has been used.
The proportion of homes judged to have stayed the same was 53%, with 25% of homes improving and 22% declining. Compared to the same period in 2016 to 2017, the proportion of homes that improved was 4 percentage points higher.
Eighty-six children’s homes were judged inadequate at their first full inspection in 2018 to 2019. Two of these had also been judged inadequate at their most recent full inspection in 2017 to 2018. Twenty-seven declined to inadequate from requires improvement to be good, 47 from good, and 2 from outstanding. The remaining 8 homes did not have a full inspection in 2017 to 2018.
3.6 Sector data for all children’s homes in period
Compared to this period in the last year, the inspection judgements for local authority and private children’s homes have remained broadly the same. The proportion of voluntary children’s homes judged good or outstanding has declined by 11 percentage points, from 76% to 65%.
Figure 8: All children’s homes overall effectiveness, 1 April 2018 to 30 September 2018, by sector
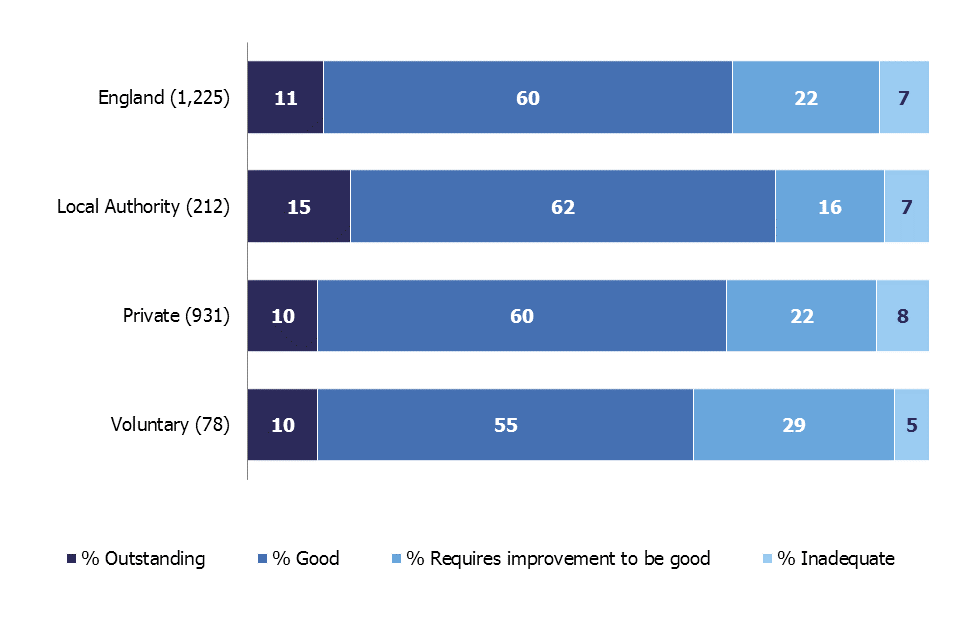
This figure compares the overall effectiveness of the 3 sectors of children's homes in the period
Sector data includes all full inspections and monitoring visits that have taken place in the period, so some homes will have more than one inspection included in this analysis. Inspection judgements for health authority homes have not been included as a separate entry in the figure above as there are so few of them (of 4 inspections, 2 received good judgements and 2 were requires improvement to be good). They have, though, been included in the England figure.
3.7 Interim inspections for all children’s homes in period
Between 1 April and 30 September 2018 there were 35 interim inspections, of which 26 resulted in a judgement. This compares to 36 interim inspections in the same period last year, of which 15 resulted in a judgement.
Revisions to previous release
View revised data covering the period 1 April 2017 to 31 March 2018 published as part of this release.
The revision of statistics relating to 1 April 2017 to 31 March 2018 from ‘provisional’ to ‘revised’ status includes outcomes relating to a further 176 inspections. These consist of an additional 58 full inspections and 7 monitoring visits of all provision types, and 21 interim inspections of children’s homes. These took place in this period and have been published since 30 April 2018. These additional inspections didn’t affect the general grade profile across all provider types.
Notes
Ofsted consulted with users in 2014 to seek views on the proposed arrangements for the frequency and content of social care inspection official statistics, which is described in more detail in the accompanying quality and methodology report. Ofsted also has representation at relevant meetings and forums to seek feedback about whether our publications meet user needs, which include regional meetings of performance leads from local authorities. Ofsted’s participation helps inform about user views, and suggested improvements are taken on board. Ofsted also engages with other organisations including the Department for Education (DfE) and representations from the private and voluntary sectors.
An explanation about key uses of this data, and further contextual information and the arrangements for quality assurance are provided in the accompanying quality and methodology report.
Ofsted also publishes data for all remits, including social care, as part of the annual Data View.
Glossary
For a full definition of the terms below, please see the Glossary tab within the underlying data tables.
Children’s homes
A children’s home is an establishment that provides care and accommodation wholly or mainly for children. Children’s homes vary in size and nature, and fulfil a range of purposes to meet the different needs of children and young people.
Residential special schools registered as children’s homes
Residential special schools registered as children’s homes provide education and accommodation to children resident for more than 295 days per year, including children with very specialist needs.
Sector
‘Sector’ refers to the type of provider that owns the children’s social care provision.
Academy: These are publicly funded independent schools who are run by trusts.
Health Authority: These are NHS Trust-run.
LA: These are public bodies responsible for the children’s social care provision.
Private: These are for-profit organisations mostly with limited company status. These can also be individually owned children’s social care provisions and run for profit.
Voluntary: These are mostly not-for-profit organisations, mainly with charitable status; and individually owned provisions run on a not-for-profit basis.
Secure children’s homes
Secure children’s homes accommodate children and young people who are remanded or have been sentenced for committing a criminal offence, or whose behaviour is deemed to present a significant threat to their own and others’ safety.
Further information
If you have any comments or feedback on this publication, please contact the Social Care Data Team on 03000 130 020 or socialcaredata@ofsted.gov.uk.
Acknowledgements
Thanks to the following for their contribution to this statistical release: Katherine Potts and Emily Moreton.