Local Alcohol Profiles for England: short statistical commentary, March 2023
Published 7 March 2023
Applies to England

© Crown copyright 2023
This publication is licensed under the terms of the Open Government Licence v3.0 except where otherwise stated. To view this licence, visit nationalarchives.gov.uk/doc/open-government-licence/version/3 or write to the Information Policy Team, The National Archives, Kew, London TW9 4DU, or email: psi@nationalarchives.gov.uk.
Where we have identified any third party copyright information you will need to obtain permission from the copyright holders concerned.
This publication is available at https://www.gov.uk/government/statistics/local-alcohol-profiles-for-england-lape-march-2023-update/local-alcohol-profiles-for-england-short-statistical-commentary-march-2023
New in this update
This update provides new data for alcohol-related and alcohol-specific mortality and hospital admissions. The indicators listed below have been updated and are available at local authority level as well as for England, the regions, deprivation deciles based on the Index of Multiple Deprivation, and sex. The new data has been added to the Local Alcohol Profiles for England (LAPE) tool on the Fingertips platform.
Trend data is not being presented alongside the 2021 updates as population estimates based on the 2021 Census are not yet available - see the Background section below in this commentary for more detail.
- alcohol-specific mortality
- alcohol-related mortality
- mortality from chronic liver disease
- alcohol-specific admissions
- alcohol-related admissions (broad)
- alcohol-related admissions (narrow)
- alcohol-related admissions (narrow): under 40
- alcohol-related admissions (narrow): 40 to 64
- alcohol-related admissions (narrow): 65 plus
- alcohol-related admissions (narrow) for unintentional injuries
- alcohol-related admissions (narrow) for mental and behavioural disorders
- alcohol-related admissions (narrow) for intentional self-poisoning due to exposure to alcohol
- alcohol-related admissions (broad) for cardiovascular disease
- alcohol-related admissions (broad) for mental and behavioural disorders
- alcohol-related admissions (broad) for alcoholic liver disease
Main findings
In 2021, there were 20,970 deaths that were related to alcohol in England, equating to a rate of 38.5 per 100,000 population. Of these 7,872 deaths were from chronic liver disease equating to a rate of 14.5 per 100,000 population and 7,556 deaths were wholly caused by alcohol equating to a rate of 13.9 per 100,000 population.
From 2021 to 2022, there were 342,795 hospital admissions that were wholly due to alcohol. This equates to a rate of 626 per 100,000 population. The number of hospital admissions wholly due to alcohol in men during this time period was double the figure for women (232,783 and 110,012 respectively).
During this time period, there were 948,312 hospital admissions that were alcohol-related under the broad definition. This equates to a rate of 1,734 per 100,000 population. The number of these type of admissions in men was 2.7 times the figure for women (690,658 and 257,654 respectively). There were 270,774 hospital admissions related to alcohol under the narrow definition. This equates to a rate of 494 (per 100,000 population). The number of alcohol-related (narrow) admissions in men during this time period (174,544) was 1.8 times the figure for women (96,230).
Background
The Local Alcohol Profiles for England bring together indicators related to alcohol-specific and alcohol-related mortality and hospital admissions.
Following Census 2021, the Office for National Statistics (ONS) is carrying out reconciliation and rebasing of the mid-year population estimates (MYE) it produces. This process happens every 10 years following the census. The official population estimates for mid-2012 to mid-2020 will be revised, to incorporate the data now available from Census 2021. As such, updated indicators using ONS mid-year population estimates are only presenting data for 2021. Once revised populations for mid-2012 to mid-2020 are published, the updated back series for the indicators affected will be published.
Key definitions used in this release
Alcohol-specific mortality
Deaths from conditions wholly caused by alcohol. This definition is also used by the ONS in their annual UK data release.
Alcohol-related mortality
Deaths from conditions which are wholly or partially caused by alcohol. For partially attributable conditions, a fraction of the deaths are included based on the latest academic evidence about the contribution alcohol makes to the condition.
Mortality from chronic liver disease
Deaths from chronic liver disease, including cirrhosis, classified by an underlying cause of death with ICD-10 code K70, K73 or K74 (all deaths included here are included in alcohol-related mortality rates).
Alcohol-specific admissions
Admissions to hospital where the primary diagnosis or any of the secondary diagnoses are an alcohol-specific (wholly attributable) condition.
Alcohol-related admissions (broad)
A measure of hospital admissions where either the primary diagnosis (main reason for admission) or one of the secondary (contributory) diagnoses is an alcohol-related condition (partially or wholly caused by alcohol). This represents a broad measure of alcohol-related admissions but is sensitive to changes in coding practice over time.
Alcohol-related admissions (narrow)
A measure of hospital admissions where the primary diagnosis (main reason for admission) is an alcohol-related condition. This represents a narrower measure. Since every hospital admission must have a primary diagnosis it is less sensitive to coding practices but may also understate the part alcohol plays in the admission.
In general:
- the broad measure gives an indication of the full impact of alcohol on hospital admissions and the burden placed on the NHS
- the narrow measure estimates the number of hospital admissions which are primarily due to alcohol consumption and provides the best indication of trends in alcohol-related hospital admissions
Age standardisation
All mortality and admissions rates in this update are standardised to adjust for differences in the age and sex structure of the population between areas and population groups.
Summary of updated indicators
Alcohol-specific mortality
In 2021, there were 7,556 alcohol-specific deaths in England, equating to a rate of 13.9 per 100,000 population.
The mortality rate was highest in the North East region (20.4 per 100,000 population) and lowest in the East of England region (10.3 per 100,000 population). The mortality rate at upper tier local authority level varied from 33.7 in Blackpool to 4.6 (per 100,000 population) in Barnet.
Figure 1: alcohol-specific mortality rate (all ages): single year, upper tier local authorities, 2021

Source: calculated by OHID Population Health Analysis (PHA) team from Office for National Statistics (ONS) death registration data and ONS mid-year population estimates.
In addition, the rate of alcohol-specific deaths in the most deprived tenth of upper tier local authority areas was double the rate in the least deprived tenth (19.8 and 9.5 per 100,000 population respectively).
Alcohol-related mortality
In 2021, there were 20,970 alcohol-related deaths in England, equating to a rate of 38.5 per 100,000 population.
The mortality rate was highest in the North East region (50.4 per 100,000 population) and lowest in the East of England region (32.3 per 100,000 population). The mortality rate at lower tier local authority level varied from 77.5 in Blackpool to 20.2 (per 100,000 population) in East Hampshire.
Figure 2: alcohol-related mortality (all ages), lower tier local authorities, 2021
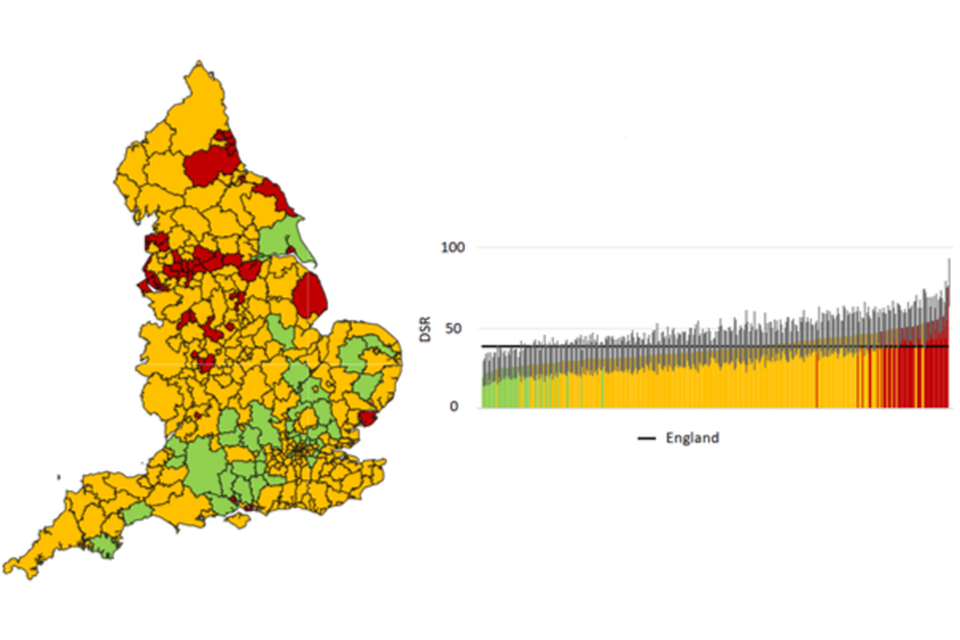
Source: calculated by OHID Population Health Analysis (PHA) team from Office for National Statistics (ONS) death registration data and ONS mid-year population estimates.
In addition, the rate of alcohol-related deaths in the most deprived tenth of lower tier local authorities (48.6 per 100,000 population) was 1.7 times the rate in the least deprived tenth (29.0).
Mortality from chronic liver disease
In 2021, there were 7,872 deaths from chronic liver disease in England, equating to a rate of 14.5 per 100,000 population. All chronic liver disease deaths are included in the definition for alcohol-related mortality, but only a subset (ICD-10 K70 alcoholic liver disease) is included in the definition for alcohol-specific mortality.
The mortality rate was highest in the North East region (21.6 per 100,000 population) and lowest in the East of England region (11.1 per 100,000 population). The mortality rate at upper tier local authority level varied from 35.4 in Blackpool to 4.1 (per 100,000 population) in Barnet.
Figure 3: mortality due to chronic liver disease (all ages), upper tier local authorities, 2021
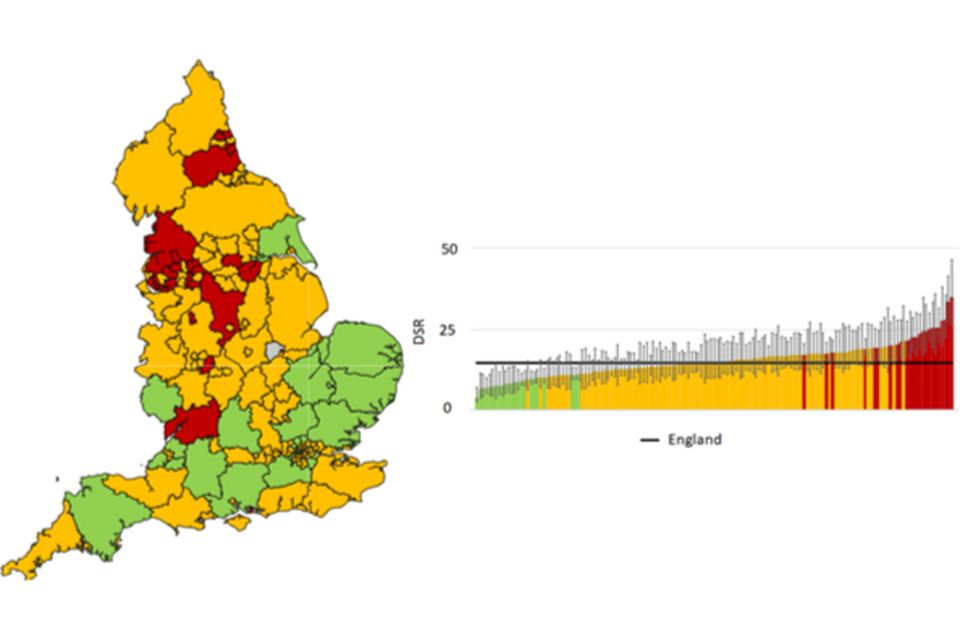
Source: calculated by OHID Population Health Analysis (PHA) team from Office for National Statistics (ONS) death registration data and ONS mid-year population estimates.
In addition, the mortality rate from chronic liver disease in the most deprived tenth of upper tier local authorities (20.3 per 100,000 population) was 1.8 times the rate in the least deprived tenth (11.0).
Alcohol-specific admissions
From 2021 to 2022, there were 342,795 alcohol-specific hospital admissions in England. This equates to a rate of 626 per 100,000 population. The number of alcohol-specific admissions for men during this period was 232,783, equating to a rate of 879 per 100,000 population. This was double that of females where there were 110,012 admissions, equating to a rate of 390 per 100,000 population while the male rate was 879.
The admission rate was highest in the North East region (991 per 100,000 population) and lowest in the East of England region (433 per 100,000 population).
The rate of alcohol-specific admissions in the most deprived tenth of lower tier local authorities (835 per 100,000 population) was significantly higher than the rate in the least deprived tenth (457 per 100,000 population).
Figure 4: alcohol-specific admission rate, lower tier local authority deprivation deciles in England, 2021 to 2022
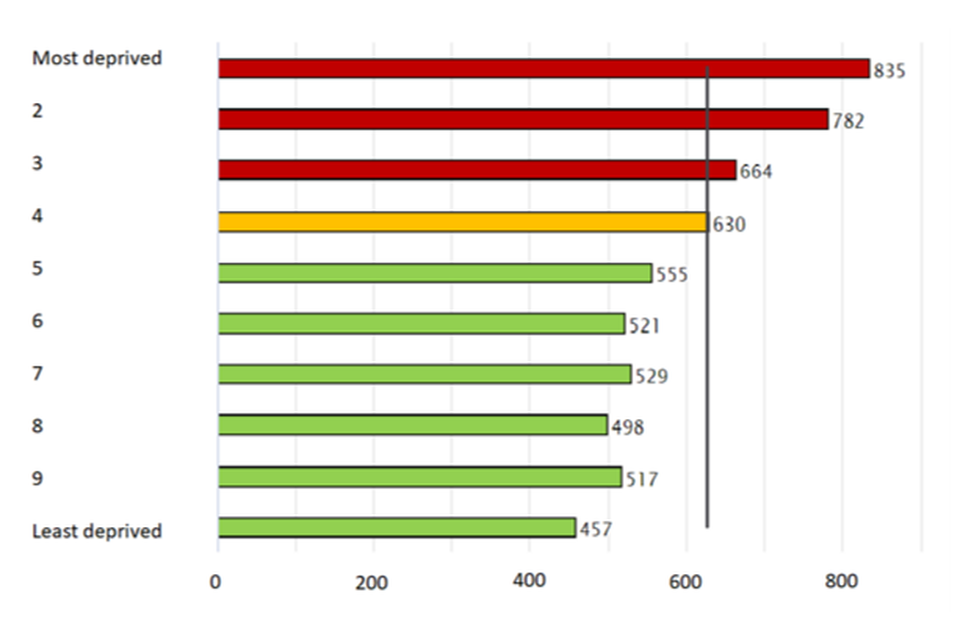
Source: calculated by OHID Population Health Analysis (PHA) team using data from NHS England Hospital Episode Statistics (HES) and Office for National Statistics (ONS) mid-year population estimates.
Alcohol-related admissions (broad)
There were 948,312 alcohol-related admissions under the broad definition in 2021 to 2022. This equates to a rate of 1,734 (per 100,000 population). The female rate was 906 (per 100,000 population) while the male rate was 2,683 (per 100,000 population). Consequently, the number of alcohol-related (broad) admissions in 2021 to 2022 for males (690,658) was 2.7 times the figure for females (257,654).
The admission rate was highest in the North East region (2,323 per 100,000 population) and lowest in the East of England region (1,507 per 100,000 population).
The rate of alcohol-related (broad) admissions in the most deprived tenth of lower tier local authorities (2,125 per 100,000 population) was significantly higher than the rate in the least deprived tenth (1,378 per 100,000 population).
Figure 5: alcohol-related (broad) admissions, lower tier local authority deprivation deciles in England, 2021 to 2022

Source: calculated by OHID Population Health Analysis (PHA) team using data from NHS England Hospital Episode Statistics (HES) and Office for National Statistics (ONS) mid- year population estimates.
Alcohol-related admissions (narrow)
There were 270,774 alcohol-related admissions under the narrow definition in 2021 to 2022. This equates to a rate of 494 (per 100,000 population). The female rate was 341 (per 100,000 population) while the male rate was 664 (per 100,000 population). Consequently, the number of alcohol-related (narrow) admissions in 2021 to 2022 for males (174,544) was 1.8 times the figure for females (96,230).
The admission rate was highest in the North East region (721 per 100,000 population) and lowest in the South East region (411 per 100,000 population).
The rate of alcohol-related (narrow) admissions in the most deprived tenth of lower tier local authorities (562 per 100,000 population) was significantly higher than the rate in the least deprived tenth (373 per 100,000 population).
Figure 6: alcohol-related (narrow) admissions, lower tier local authority deprivation deciles in England, 2021 to 2022
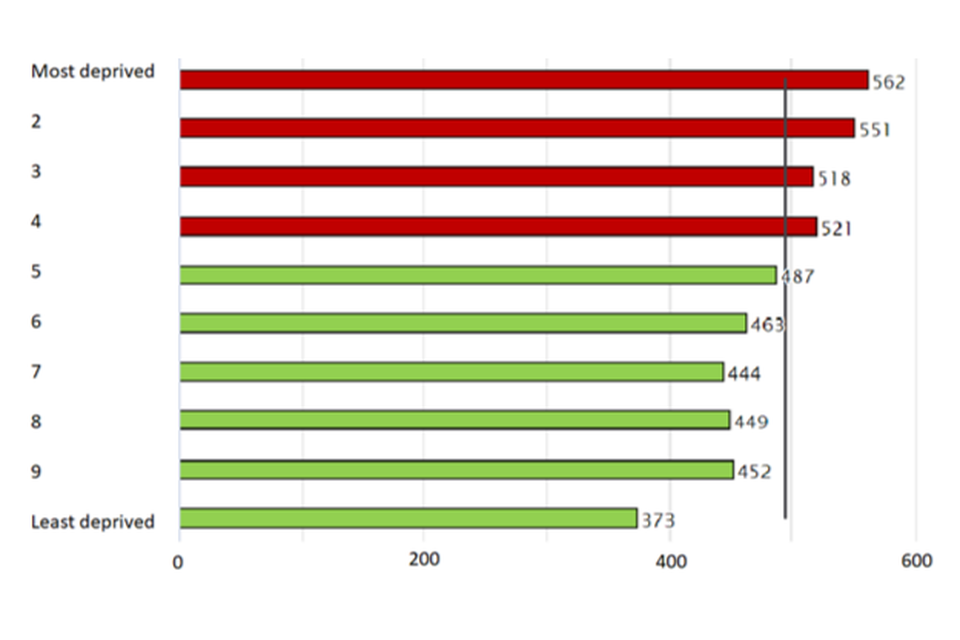
Source: calculated by OHID Population Health Analysis (PHA) team using data from NHS England Hospital Episode Statistics (HES) and Office for National Statistics (ONS) mid-year population estimates.
Further information
The Local Alcohol Profiles for England (LAPE) have been published on an annual basis since 2006. These profiles have been designed to help local government and health services assess the effect of alcohol use on their local populations. They will inform commissioning and planning decisions to tackle alcohol use and improve the health of local communities.
The LAPE data tool helps local areas assess alcohol-related harm and monitor the progress of efforts to reduce this.
View the LAPE Profile.
Responsible statistician, product lead: Mark Cook.
For queries relating to this publication, please contact: profilefeedback@dhsc.gov.uk.