Local Alcohol Profiles for England: short statistical commentary, February 2022
Published 1 February 2022
Applies to England

© Crown copyright 2022
This publication is licensed under the terms of the Open Government Licence v3.0 except where otherwise stated. To view this licence, visit nationalarchives.gov.uk/doc/open-government-licence/version/3 or write to the Information Policy Team, The National Archives, Kew, London TW9 4DU, or email: psi@nationalarchives.gov.uk.
Where we have identified any third party copyright information you will need to obtain permission from the copyright holders concerned.
This publication is available at https://www.gov.uk/government/statistics/local-alcohol-profiles-for-england-lape-february-2022-update/local-alcohol-profiles-for-england-short-statistical-commentary-february-2022
New in this update
New hospital admissions data have been added to the Local Alcohol Profiles for England (LAPE) tool on the Fingertips platform. The following indicators have been updated and are available at local authority level as well as for England, the regions, and various inequality groups:
- alcohol-specific admissions
- alcohol-related admissions (Broad)
- alcohol-related admissions (Narrow)
- alcohol-related admissions (Narrow): <40s
- alcohol-related admissions (Narrow): 40-64
- alcohol-related admissions (Narrow): 65+
- alcohol-related admissions (Narrow) for unintentional injuries
- alcohol-related admissions (Narrow) for mental and behavioural disorders
- alcohol-related admissions (Narrow) for intentional self-poisoning due to exposure to alcohol
- alcohol-related admissions (Broad) for cardiovascular disease
- alcohol-related admissions (Broad) for mental and behavioural disorders
- alcohol-related admissions (Broad) for alcoholic liver disease
Main findings
- there were 318,595 alcohol-specific admissions in 2020 to 2021, a reduction in the rate to 587 (per 100,000 population).
- there were 814,595 alcohol-related hospital admissions under the Broad definition in England in 2020 to 2021, a reduction in the rate to 1,500 (per 100,000).
- there were 247,970 alcohol-related hospital admissions under the Narrow definition in England in 2020 to 2021, a reduction in the rate to 456 (per 100,000).
- the COVID-19 pandemic had a large impact on hospital activity with a general reduction in admissions observed in 2020 to 2021.
Background
Due to the impact of the COVID-19 pandemic there was a general reduction in admission rates for the year 2020 to 2021 compared with previous years. This picture has been seen in the monthly alcohol-specific admission indicators available on OHID’s Wider Impacts of COVID-19 on Health (WICH) monitoring tool. The WICH data shows a significant reduction in alcohol-specific admissions from March 2020, following the introduction of the national lockdown, before returning to expected levels in June 2020. This reduction in activity from March 2020 has resulted in lower than typical alcohol admission rates for the year 2020 to 2021.
Key definitions used in this release
In general, the Broad measure gives an indication of the full impact of alcohol on hospital admissions and the burden placed on the NHS. The Narrow measure estimates the number of hospital admissions which are primarily due to alcohol consumption and provides the best indication of trends in alcohol-related hospital admissions.
Alcohol-specific admissions
Admissions to hospital where the primary diagnosis or any of the secondary diagnoses are an alcohol-specific (wholly attributable) condition.
Alcohol-related admissions (Broad)
A measure of hospital admissions where either the primary diagnosis (main reason for admission) or one of the secondary (contributory) diagnoses is an alcohol-related condition. This represents a Broad measure of alcohol-related admissions but is sensitive to changes in coding practice over time.
Alcohol-related admissions (Narrow)
A measure of hospital admissions where the primary diagnosis (main reason for admission) is an alcohol-related condition. This represents a Narrower measure - since every hospital admission must have a primary diagnosis it is less sensitive to coding practices but may also understate the part alcohol plays in the admission.
Summary of updated indicators
Alcohol-specific admissions
There were 318,595 alcohol-specific admissions in 2020 to 2021. This equates to a rate of 587 (per 100,000 population). The trend has been static before increasing from 2018 to 2019; the most recent decrease will have been impacted by the COVID-19 pandemic.
Figure 1: Age standardised alcohol-specific admission rates by sex, England
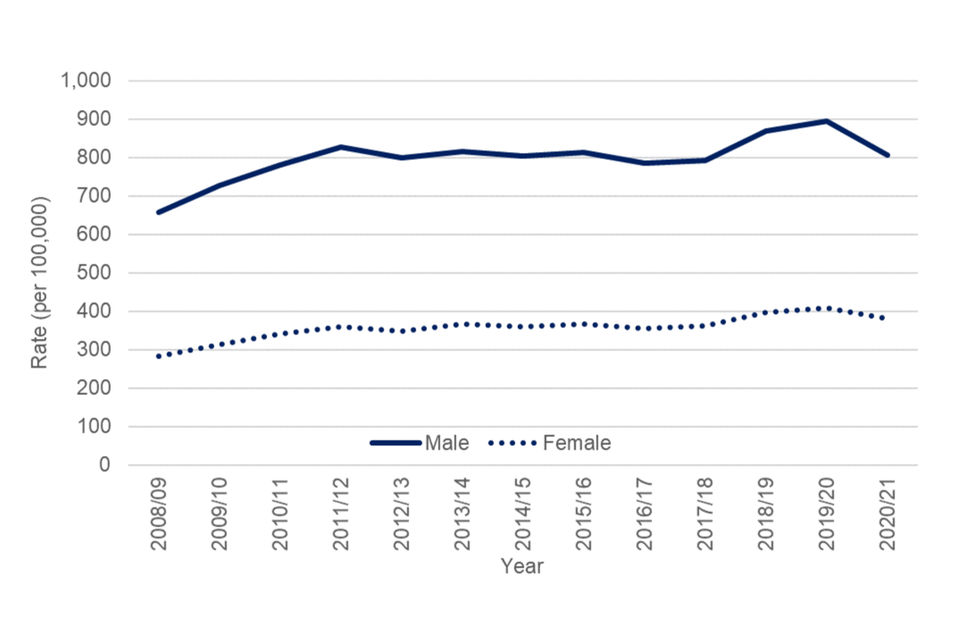
Figure 1 shows that the female rate in 2020 to 2021 was 380 (per 100,000) while the male rate was 806 (per 100,000). The number of alcohol-specific admissions in 2020 to 2021 for men (213,345) was double the figure for women (105,250).
Figure 2: Age standardised alcohol-specific admission rates, district and unitary authorities in England, 2020 to 2021
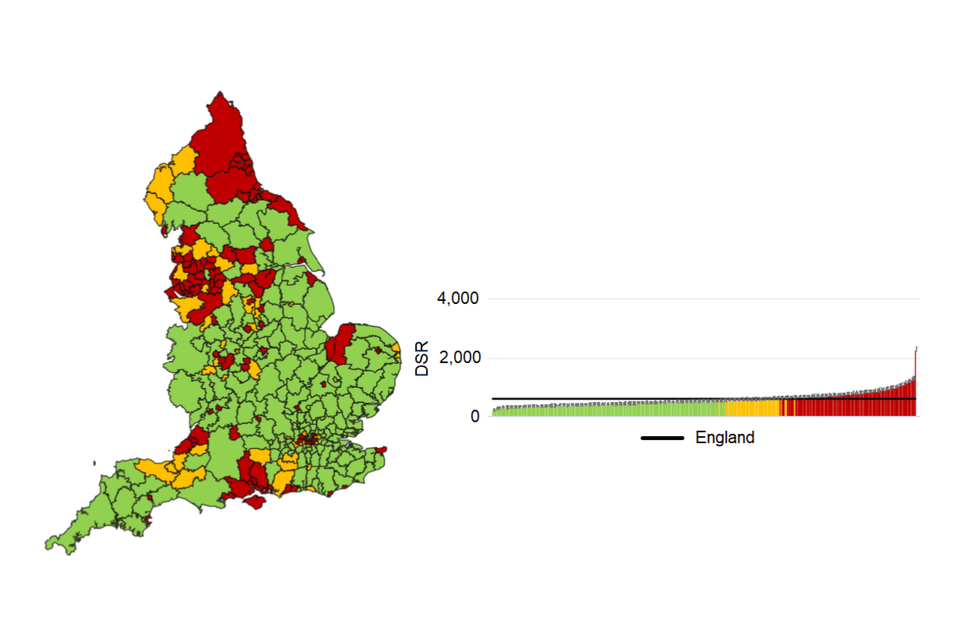
Figure 2 shows that for the most recent period (2020 to 2021) the rate of alcohol-specific admissions in the most deprived tenth of district and unitary authorities (803 per 100,000) was significantly higher than the rate in the least deprived (418 per 100,000).
Figure 2 also shows the variation in alcohol-specific admission rate across district and unitary authorities in England, ranging from 203 (per 100,000) in Eden to 2,276 (per 100,000) in Southampton.
Alcohol-related admissions (Broad)
There were 814,595 alcohol-related admissions under the Broad definition in 2020 to 2021. This equates to a rate of 1,500 (per 100,000 population). The trend has been increasing from 2016 to 2017; the most recent decrease will have been impacted by the COVID-19 pandemic.
Figure 3: Age standardised alcohol-related admission rates (Broad) by sex, England
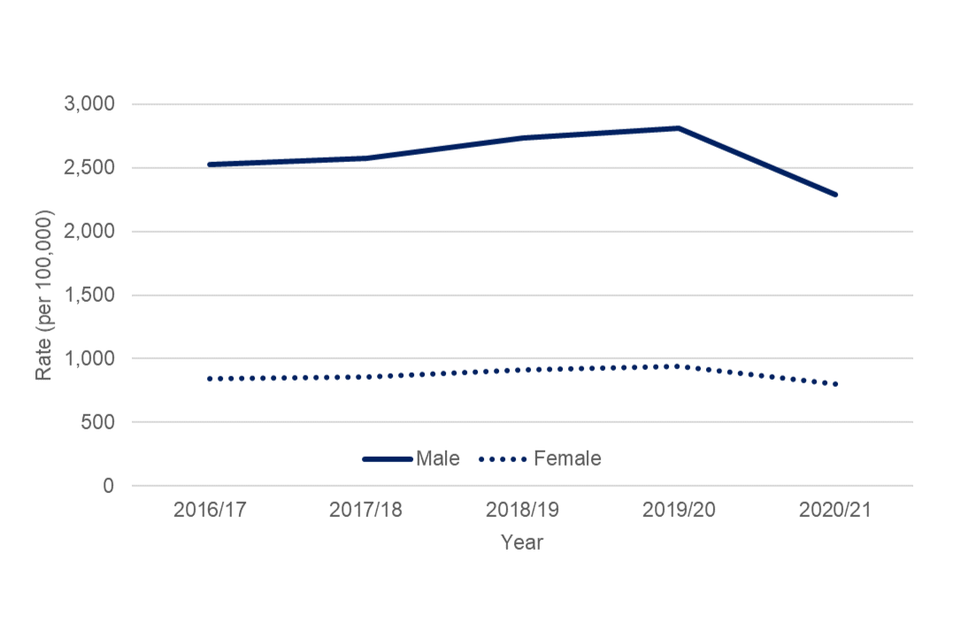
Figure 3 shows that the female rate in 2020 to 2021 was 805 (per 100,000) while the male rate was 2,290 (per 100,000). The number of Broad alcohol-related admissions in 2020 to 2021 for men (588,690) was more than double the figure for women (225,910).
Figure 4: Age standardised alcohol-related admissions (Broad), district and unitary authorities in England, 2020 to 2021
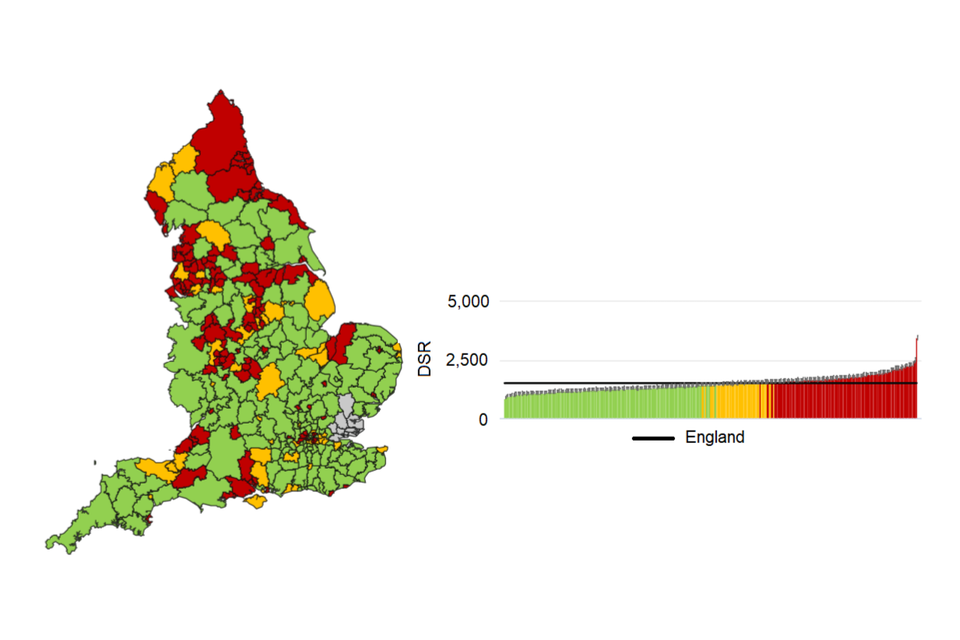
Figure 4 shows that for the most recent period (2020 to 2021) the rate of Broad alcohol-related admissions in the most deprived tenth of district and unitary authorities (1,884 per 100,000) was significantly higher than the rate in the least deprived (1,151 per 100,000).
Figure 4 also shows the variation in Broad alcohol-related admissions across district and unitary authorities in England, ranging from 868 (per 100,000) in Mid Sussex to 3,459 (per 100,000) in Southampton.
Alcohol-related admissions (Narrow)
There were 247,970 alcohol-related admissions under the Narrow definition in 2020 to 2021. This equates to a rate of 456 (per 100,000 population). The trend has been increasing from 2018 to 2019; the most recent decrease will have been impacted by the COVID-19 pandemic.
Figure 5: Age standardised alcohol-related admission rates (Narrow) by sex, England

Figure 5 shows that the female rate in 2020 to 2021 was 322 (per 100,000) while the male rate was 603 (per 100,000). The number of Narrow alcohol-related admissions in 2020 to 2021 for men (158,635) was almost double the figure for women (89,340).
Figure 6: Age standardised alcohol-related admission rates (Narrow), district and unitary authorities in England, 2020 to 2021
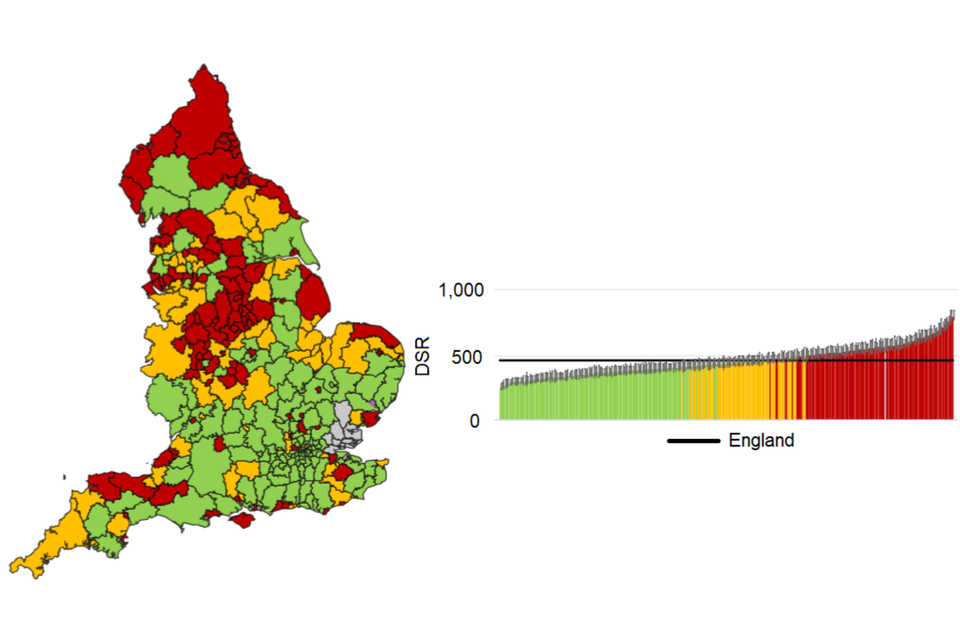
Figure 6 shows that for the most recent period (2020 to 2021) the rate of Narrow alcohol-related admissions in the most deprived tenth of district and unitary authorities (533 per 100,000) was significantly higher than the rate in the least deprived (333 per 100,000).
Figure 6 also shows the variation in Narrow alcohol-related admission rate across district and unitary authorities in England, ranging from 251 (per 100,000) in Kensington and Chelsea to 805 (per 100,000) in Sunderland.
Background and further information
The Local Alcohol Profiles for England (LAPE) have been published on an annual basis since 2006. These profiles have been designed to help local government and health services assess the effect of alcohol use on their local populations. They will inform commissioning and planning decisions to tackle alcohol use and improve the health of local communities.
The LAPE data tool helps local areas assess alcohol-related harm and monitor the progress of efforts to reduce this.
View the LAPE Profile
Responsible statistician, product lead: Mark Cook For queries relating to this publication, please contact: lape@phe.gov.uk