Local Alcohol Profiles for England: short statistical commentary, December 2021
Published 7 December 2021
Applies to England

© Crown copyright 2021
This publication is licensed under the terms of the Open Government Licence v3.0 except where otherwise stated. To view this licence, visit nationalarchives.gov.uk/doc/open-government-licence/version/3 or write to the Information Policy Team, The National Archives, Kew, London TW9 4DU, or email: psi@nationalarchives.gov.uk.
Where we have identified any third party copyright information you will need to obtain permission from the copyright holders concerned.
This publication is available at https://www.gov.uk/government/statistics/local-alcohol-profiles-for-england-lape-december-2021-update/local-alcohol-profiles-for-england-short-statistical-commentary-december-2021
New in this update
New mortality data for 2020 has been added to the Local Alcohol Profiles for England (LAPE) tool on the Fingertips platform. The following indicators have been updated and are available at local authority level as well as for England, the regions, and various inequality groups:
- alcohol-specific mortality
- alcohol-related mortality
- mortality from chronic liver disease
Main findings
-
There were 6,985 alcohol-specific deaths in England in 2020, an increase in the rate to 13.0 per 100,000 population from 10.9 in 2019. The number of alcohol-specific deaths has increased by 20.0% between 2020 (6,985) and 2019 (5,820). This increase has been confirmed in previously published reports from the Office for Health Improvement and Disparities (OHID) (formerly as Public Health England) in the Alcohol consumption and harm during the COVID-19 pandemic report and the Office for National Statistics (ONS) in the Quarterly alcohol specific deaths report
-
There were an estimated 20,470 alcohol-related deaths in England in 2020, an increase in the rate to 37.8 per 100,000 population from 36.4 in 2019. There was a 4.8% increase in the number of alcohol-related deaths in 2020 compared with 2019
-
There were 7,400 deaths due to chronic liver disease in England in 2020, an increase in the rate to 13.7 per 100,000 population from 12.2 in 2019. There was a 13.3% increase in the number of deaths due to chronic liver disease for 2020 (7,400) compared with 2019 (6,530). A similar increase to that seen in alcohol-specific deaths is to be expected as a significant proportion of alcohol-specific deaths are due to alcoholic liver disease
Key definitions used in this release
- Alcohol-specific mortality: Deaths from conditions wholly caused by alcohol. This definition is also used by the ONS in their annual UK data release published in parallel with this OHID release
- Alcohol-related mortality: Deaths from conditions which are wholly or partially caused by alcohol. For partially attributable conditions, a fraction of the deaths are included based on the latest academic evidence about the contribution alcohol makes to the condition
- Mortality from chronic liver disease: Deaths from chronic liver disease, including cirrhosis, classified by an underlying cause of death with ICD10 code K70, K73 or K74
Background
As the latest data point for the mortality indicators cover the calendar year 2020, they will show the initial impact of the COVID-19 pandemic. To accommodate this, data has been presented as single years up to 2020. Comparisons between 2019 and 2020 need to be made with caution. COVID-19 was a new cause of death in 2020 and some who died from it may have died from another cause instead if the pandemic had not occurred. This may have reduced mortality rates from these other causes in 2020.
However, the fact that mortality rates from key causes of death related to alcohol increased in 2020 suggests that an increase in alcohol harm was a wider impact of the pandemic.
There is currently no robust information on the relative risk of COVID-19 death among those who drink alcohol and therefore any COVID-19 deaths that may be related to alcohol are not included in the indicators presented.
Summary of updated indicators
Alcohol-specific mortality
There were 6,985 alcohol-specific deaths in England in 2020, an increase in the rate to 13.0 per 100,000 population from 10.9 in 2019. The number of alcohol-specific deaths has increased by 20.0% between 2020 (6,985) and 2019 (5,820).
The mortality rate was highest in the North East region (20.0 per 100,000 population) and lowest in the East of England region (9.2). The mortality rate at upper-tier local authority level varied from 29.3 in Wolverhampton to 5.5 in Richmond upon Thames.
Figure 1: alcohol-specific mortality (all ages): single year, counties and unitary authorities, 2020
In addition, the rate of alcohol-specific deaths in the most deprived decile (18.9 per 100,000) is double the rate in the least deprived decile (7.8).
Alcohol-related mortality
There were an estimated 20,470 alcohol-related deaths in England in 2020, an increase in the rate to 37.8 per 100,000 population from 36.4 in 2019. There was a 4.8% increase in the number of alcohol-related deaths for 2020 (20,470) compared to 2019 (19,530).
The mortality rate was highest in the North East region (49.0 per 100,000) and lowest in the London region (32.2). The mortality rate at upper-tier local authority level varied from 68.9 in Blackpool to 21.5 in Richmond upon Thames.
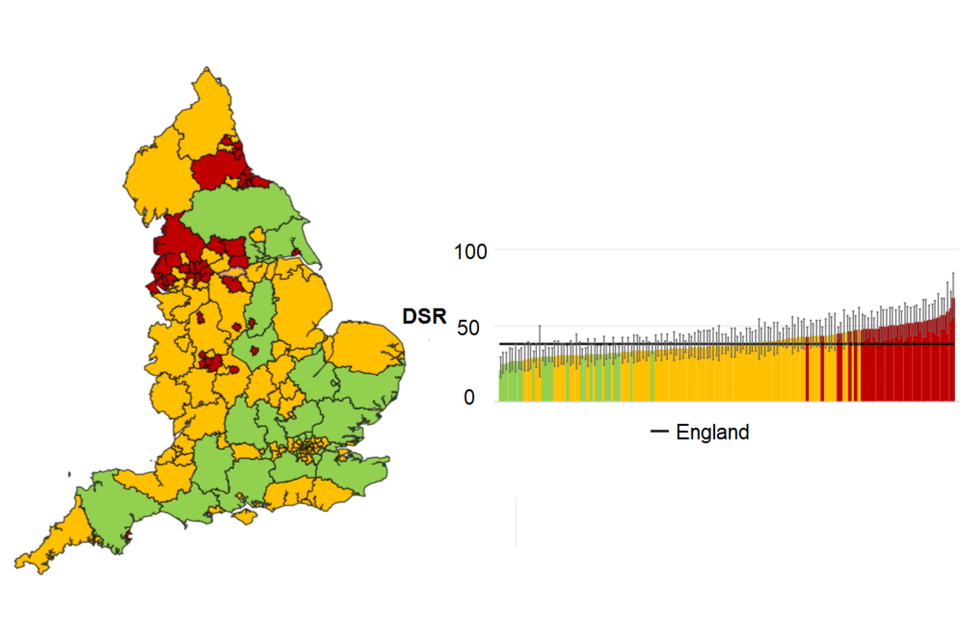
Figure 2: alcohol-related mortality (all ages), counties and unitary authorities, 2020
In addition, the rate of alcohol-related deaths in the most deprived decile (49.1 per 100,000) was significantly higher than the rate observed in the least deprived decile (28.4).
Mortality from chronic liver disease
There were 7,400 deaths due to chronic liver disease in England in 2020, an increase in the rate to 13.7 per 100,000 population from 12.2 in 2019. There was a 13.3% increase in the number of deaths due to chronic liver disease for 2020 (7,400) compared with 2019 (6,530). A similar increase to that seen in alcohol-specific deaths is to be expected as a significant proportion of alcohol-specific deaths are due to alcoholic liver disease.
The mortality rate was highest in the North East region (21.6 per 100,000) and lowest in the London and East of England regions (both 10.5). The mortality rate at upper-tier local authority level varied from 29.5 in Blackpool to 6.0 in Rotherham.
Figure 3: mortality due to chronic liver disease (all ages), counties and unitary authorities, 2020
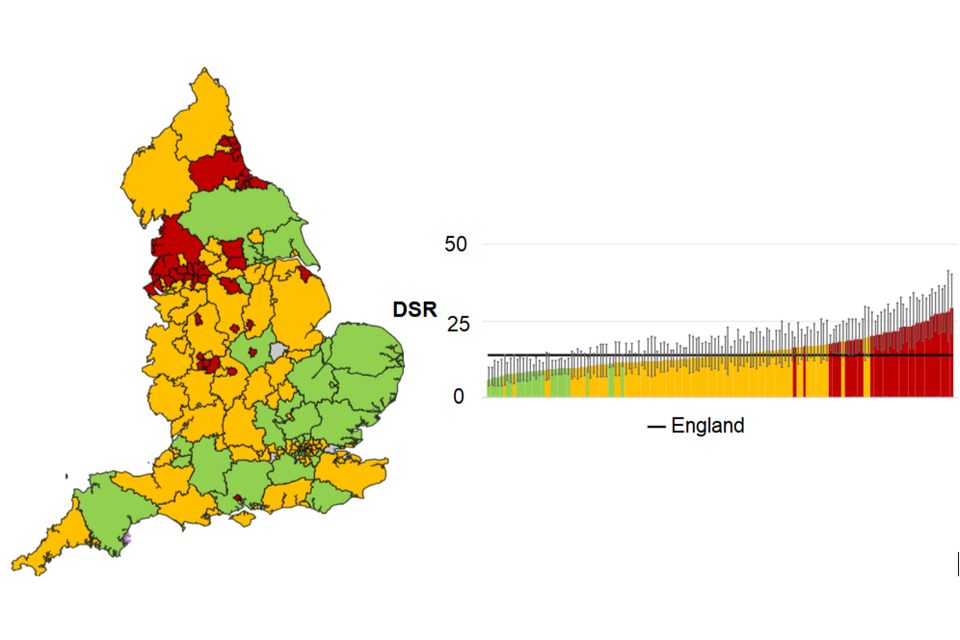
In addition, the rate of deaths due to chronic liver disease in the most deprived decile (19.7 per 100,000) was double the rate observed in the least deprived decile (9.2).
Further information
The Local Alcohol Profiles for England (LAPE) have been published on an annual basis since 2006. These profiles have been designed to help local government and health services assess the effect of alcohol use on their local populations. They will inform commissioning and planning decisions to tackle alcohol use and improve the health of local communities.
The LAPE data tool helps local areas assess alcohol-related harm and monitor the progress of efforts to reduce this.
View the LAPE.
Responsible statistician, product lead: Mark Cook
For queries relating to this publication, please contact: lape@phe.gov.uk.