Liver disease profiles, October 2022 update
Published 4 October 2022
Applies to England

© Crown copyright 2022
This publication is licensed under the terms of the Open Government Licence v3.0 except where otherwise stated. To view this licence, visit nationalarchives.gov.uk/doc/open-government-licence/version/3 or write to the Information Policy Team, The National Archives, Kew, London TW9 4DU, or email: psi@nationalarchives.gov.uk.
Where we have identified any third party copyright information you will need to obtain permission from the copyright holders concerned.
This publication is available at https://www.gov.uk/government/statistics/liver-disease-profiles-october-2022-update/liver-disease-profiles-october-2022-update
1. New in this update
New Integrated Care Board (ICB) data on mortality and hospital admissions has been added to the Liver Disease Profile
The liver disease profile from which this is a summary was developed by the national liver disease intelligence service at PHE following recommendations in March 2014 from the All Party Parliamentary Hepatology Group (APPHG) inquiry into improving outcomes in liver disease chaired by the late Sir David Amess.
This is one of a series of bulletins for liver disease profile updates. Narrative on the data at an England and local authority level is available from previous Liver disease profile bulletins.
This update includes new data for 8 indicators in the liver disease profile for the 42 ICBs:
- hospital admissions for liver disease in persons, males and females
- mortality from liver disease in persons, males and females aged under 75
- hospital admissions for alcoholic liver disease in persons, males and females
- mortality from alcohol related liver disease in persons, males and females aged under 75
- hospital admissions for non-alcoholic fatty liver disease (NAFLD) in persons
- mortality from non-alcoholic fatty liver disease (NAFLD) in persons aged under 75
- mortality from hepatitis B related end-stage liver disease/hepatocellular carcinoma in persons aged under 75
- mortality from hepatitis C related end-stage liver disease/hepatocellular carcinoma in persons aged under 75
Due to the potential impact of COVID-19 on mortality and hospital admissions data, indicators are now being presented in views for both 3-year up to 2017 to 2019 and single-year up to 2020 where numbers allow.
The mortality indicators back series data has been adjusted to also take into account the changes in cause of death coding software and ICD10 coding making data comparable to the most recent 2020 data.
2. Main findings
This update shows:
-
of the 42 ICBs, in the financial year ending 2021, rates of admission to hospital for liver disease were highest in NHS Nottingham and Nottinghamshire ICB (200.1 per 100,000 population). There is a 2.7-fold difference between the ICBs with the highest and lowest rates. However, the highest count occurred in NHS North East and North Cumbria ICB (4,975), 7% of all liver disease admissions
-
rates of mortality from liver disease and alcoholic liver disease are higher in males than females in every ICB in England, however there is more variation across the ICBs in the rate of female hospital admissions than males
-
the hospital admission rate for alcoholic liver disease for males in England was 61.7 per 100,000 population, and for females 30.1 per 100,000 population. Across the ICBs rates ranged from 21.8 per 100,000 population in NHS Mid and South Essex ICB to 91.5 per 100,000 population in NHS Gloucestershire ICB
3. Summary
3.1 Hospital admission rates due to liver disease
This indicator has been updated to present data at ICB geographies for the financial year ending 2021 and back series data for males, females and persons.
During the financial year ending 2021, the rate of hospital admissions due to liver disease in persons ranged from 75.4 (70.5 to 80.5) per 100,000 population in NHS Mid and South Essex ICB to 200.1 (191.8 to 208.6) per 100,000 population in NHS Nottingham and Nottinghamshire ICB. This is a 2.7-fold difference between the ICBs. The England rate was 124.3 (123.4 to 125.3) per 100,000 population.
The box plot in figure 1 shows the distribution of 42 ICB values for the financial year ending 2021.
Figure 1: Single-year hospital admission rate due to liver disease (persons), per 100,000 population, ICB in England, from the year 2010 to 2011 to the year 2020 2021
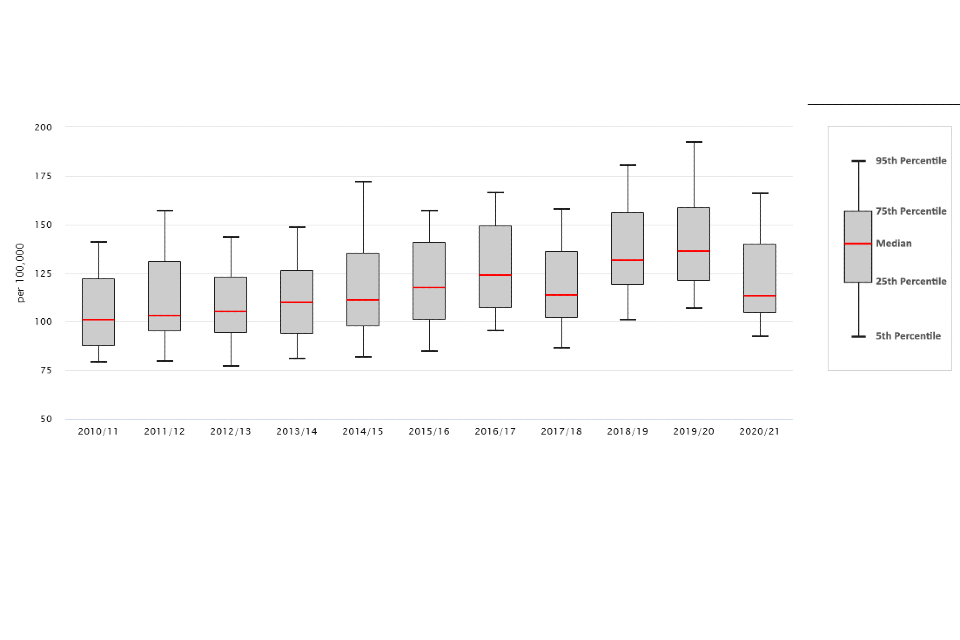
The median ICB rate decreased from 136.4 per 100,000 population in the financial year ending 2020 to 113.4 per 100,000 population in the financial year ending 2021.
During the financial year ending 2021, 67,458 people in England, had a hospital admission for liver disease. 41,091 were male and 26,347 female. The ICB with the highest count for persons was NHS North East and North Cumbria ICB with 4,975 admissions. The lowest count was in NHS Somerset ICB with 645 admissions.
Rates between males and females were significantly different with males having higher rates of 156.4 (154.9 to 157.9) per 100,000, compared to females of 94.4 (93.3 to 95.6) per 100,000 population in England.
3.2 Premature mortality rate due to liver disease
This indicator has been updated with new ICB geographies showing single-year data up to 2020 and 3-year data up to 2017 to 2019 for males, females and persons. This indicator highlights the premature deaths caused by a largely preventable disease in each ICB area.
During 2020 the rate of mortality from liver disease in persons ranged from 13.8 (11.5 to 16.3) per 100,000 population aged under 75 in NHS Surrey Heartlands ICB to 32.0 (29.7 to 34.4) per 100,000 population aged under 75 in NHS Greater Manchester ICB. This represents a 2.3-fold difference in values across the ICBs. The England rate was 20.6 (20.2 to 21.0) per 100,000 population aged under 75.
3.3 Hospital admission rates due to alcoholic liver disease
This indicator has been updated to present data at ICB geographies for the financial year ending 2021 and back series data for males, females and persons.
During the financial year ending 2021, the rate of hospital admissions due to alcoholic liver disease in persons ranged from 21.8 (19.2 to 24.6) per 100,000 population in NHS Mid and South Essex ICB to 91.5 (84.3 to 99.1) per 100,000 population in NHS Gloucestershire ICB. This is a 4.2-fold difference between the ICBs. The England rate was 45.5 (45.0 to 46.1) per 100,000 population.
Counts in the financial year ending 2021 were highest in NHS North East and North Cumbria ICB where there were 2,115 hospital admissions for alcoholic liver disease. NHS Somerset ICB had the fewest with 190 admissions.
11 of the ICB areas had rates that were significantly higher than the England rate.
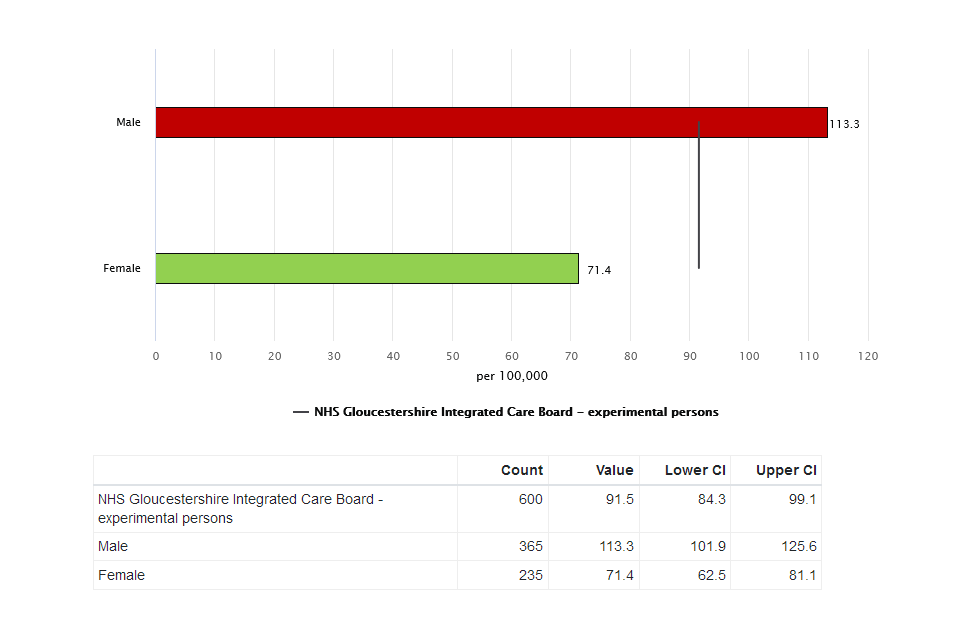
There are differences in the rates for males compared to females. The hospital admission rate for alcoholic liver disease for males in England was 61.7 (60.7 to 62.6) per 100,000 population, and for females 30.1 (29.5 to 30.8) per 100,000 population. Across the ICBs the male values ranged from 28.9 (24.7 to 33.7) to 124.1 (117.5 to 131.0) per 100,000 population, a fold difference of 4.3 whereas females ranged from 14.1 (11.8 to 16.7) to 71.4 (62.5 to 81.1) per 100,000 population a fold difference of 5.1. This suggests that there is more variation across the ICBs in the rate of female hospital admissions than males.
Figure 2: Single-year hospital admission rate due to alcoholic liver disease, per 100,000 population, by males and females for NHS Gloucestershire ICB, 2020 to 2021
3.4 Premature mortality due to alcoholic liver disease
This indicator has been updated to present data at ICB geographies from the 3-year period ending 2003 up to the 3-year period ending 2019 for males, females and persons. Single year data from 2001 to 2020 is also being presented for persons.
During 2020 the rate of premature deaths from alcoholic liver disease ranged from 5.8 (4.4 to 7.6) per 100,000 population aged under 75 in NHS Norfolk and Waveney ICB to 19.9 (17.3 to 22.9) per 100,000 population aged under 75 in NHS Black Country ICB. This represents a 3.4-fold difference across the ICBs. The rate for England was 10.8 (10.5 to 11.1) per 100,000 population aged under 75.
Counts of the number of people who died aged under 75 from alcoholic liver disease in 2020 varied from 44 deaths in NHS Frimley ICB to 445 deaths in North East and North Cumbria ICB. There were 5,285 deaths in England.
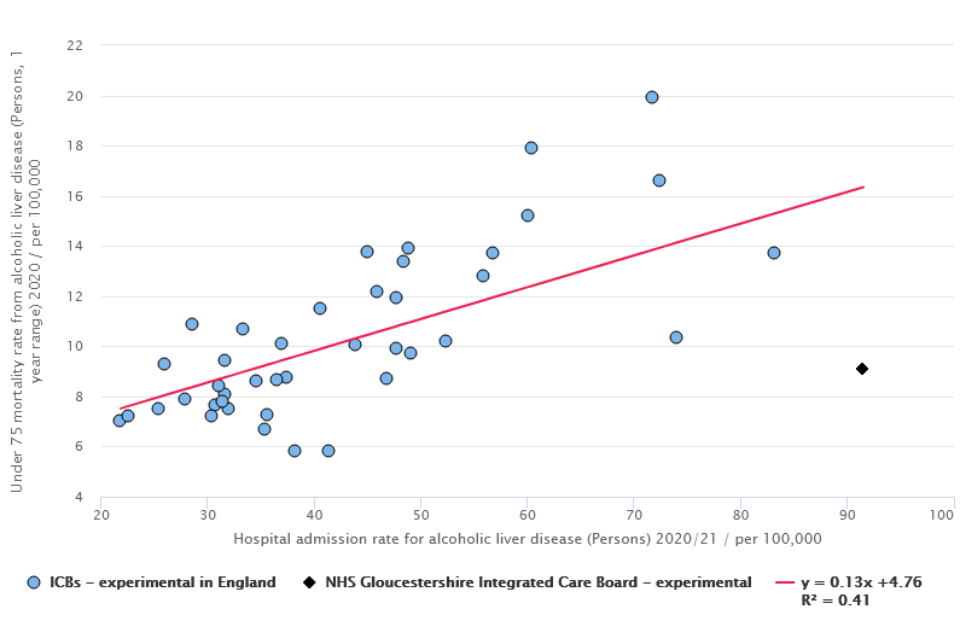
Comparing the rate of hospital admissions with the rate of premature mortality there is a positive correlation between ICBs with a higher rate of hospital admissions and areas with a higher rate of premature deaths. NHS Gloucestershire ICB however has high rates of admission but comparatively lower rates of premature death. (figure 3).
Figure 3: Hospital admission rate from alcoholic liver disease (persons) per 100,000 population, 2020 to 2021 vs Mortality rate from alcoholic liver disease (persons), per 100,000 population aged under 75, 2020, by ICB
The rate of premature mortality from alcoholic liver disease for the 3-year period from 2017 to 2019 for males varied across the ICBs from 7.1 (5.4 to 9.1) per 100,000 population aged under 75 to 20.1 (17.9 to 22.6). This represents a 2.9-fold difference. In females the rates across the ICBs ranged from 2.7 (1.9 to 3.5) per 100,000 population aged under 75 to 11.1 (9.5 to 12.9). This represents a 4.2-fold difference.
3.5 Hospital admission rates due to non-alcoholic fatty liver disease
This indicator has been updated with data at ICB geographies showing single-year data up to 2020 and 3-year data up to 2017 to 2019 for persons.
During the financial year ending 2021, the rate of hospital admissions due to non-alcoholic fatty liver disease in persons ranged from 1.5 (0.9 to 2.7) per 100,000 population in NHS Bristol, North Somerset and South Gloucestershire ICB to 12.0 (10.1 to 4.2) per 100,000 population in NHS Nottingham and Nottinghamshire ICB. This represents a 7.7-fold difference in rates across the ICBs. The England rate was 3.7 (3.5 to 3.8) per 100,000 population.
Looking at the 3-year data from the financial year ending 2018 to 2020 the rate of hospital admissions due to non-alcoholic fatty liver disease in persons ranged from 1.8 (1.2 to 2.6) per 100,000 population in NHS Somerset ICB to 10.5 (9.4 to 11.7) per 100,000 population in NHS Surrey Heartlands ICB. This represents a 5.9-fold difference in rates across the ICBs. The England rate was 4.6 per 100,000 population.
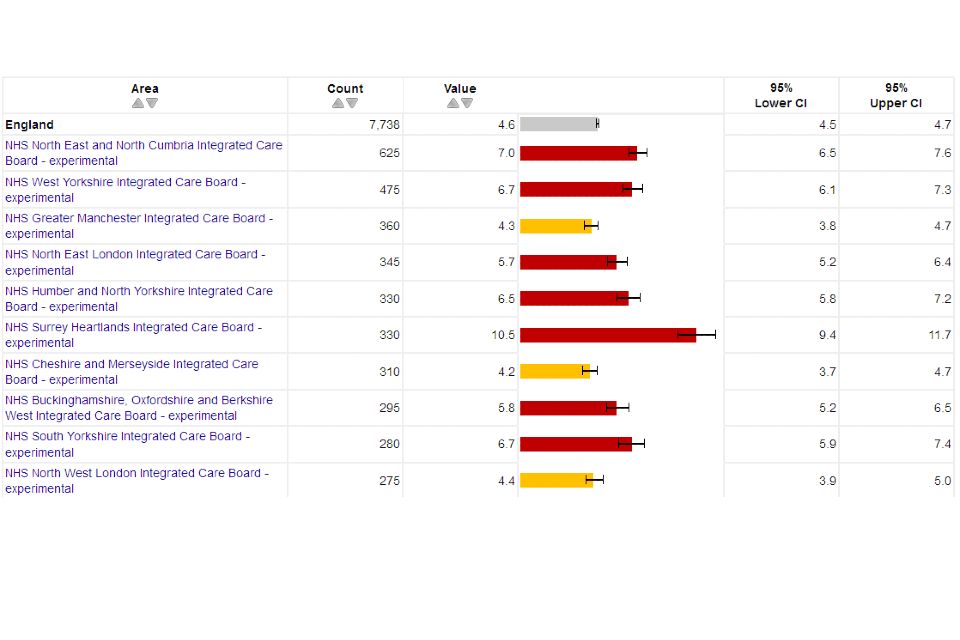
Across England there were 7,738 hospital admissions due to non-alcoholic fatty liver disease in persons over the 3-year period from the financial year ending 2018 to 2020. Counts at an ICB level over the same time period ranged from 30 in NHS Somerset ICB to 625 NHS North East and North Cumbria ICB.
Figure 4: Top 10 areas with the highest counts of hospital admission from non-alcoholic fatty liver disease per 100,000 population, financial year 2017 to 2018 to the financial year 2019 to 2020
3.6 Premature mortality due to non-alcoholic fatty liver disease
This indicator has been updated with new ICB geographies showing 3 -year data up to 2017 to 2019 for persons.
In the 3-year period between 2017 to 2019, the highest rate of premature deaths from non-alcoholic fatty liver disease was in NHS Cheshire and Merseyside ICB with a rate of 1.11 (0.43 to 1.39) per 100,000 people aged under 75 and the lowest was in NHS Buckingham, Oxfordshire, and Berkshire West ICB with a rate of 0.11 (0.03 to 0.25) per 100,000 people aged under 75, (although it should be noted several ICB areas have been suppressed due to low counts). The England rate was 0.47 (0.43 to 0.50) per 100,000 people aged under 75 in the 3-year period 2017 to 2019.
In the 3-year period there were 717 premature deaths from non-alcoholic fatty liver disease across England.
3.7 Premature mortality from hepatitis B related end-stage liver disease or hepatocellular carcinoma
This indicator has been updated with new ICB geographies showing 3-year data up to 2017 to 2019 for persons.
During the 2017 to 2019 time period the rate of premature mortality from Hepatitis B related end-stage liver disease / hepatocellular carcinoma ranged from 0.06 (0.02 to 0.14) per 100,000 population aged under 75 in NHS North East and North Cumbria ICB to 0.40 (0.22 to 0.65) per 100,000 population aged under 75 in NHS Birmingham and Solihull ICB (although it should be noted, 20 ICB areas had suppressed rates due to low counts). The England rate was 0.13 (0.11 to 0.15) per 100,000 population aged under 75 in the 3-year period 2017 to 2019.
In the 3-year period there were 203 premature deaths from hepatitis B related end-stage liver disease or hepatocellular carcinoma across England.
3.8 Premature mortality from hepatitis C related end-stage liver disease or hepatocellular carcinoma
This indicator has been updated with new ICB geographies showing 3-year data up to 2017 to 2019 for persons.
During the 2017 to 2019 time period rates of premature deaths from hepatitis C related end stage liver disease or liver cancer ranged from 0.15 (0.05 to 0.36) per 100,000 population aged under 75 in NHS Mid and South Essex ICB to 0.89 (0.69 to 1.13) per 100,000 population aged under 75 in NHS Greater Manchester ICB. This represents a 5.8-fold difference between the highest and lowest ICB rates. The England rate was 0.53 (0.19 to 0.56) per 100,000 population aged under 75 in the 3-year period 2017 to 2019.
In the 3-year period there were 809 premature deaths from hepatitis C related end-stage liver disease or hepatocellular carcinoma across England.
4. Background and further information
Liver disease is almost entirely preventable with the major risk factors: alcohol, obesity and hepatitis B and C accounting for up to 90% of cases.
The liver disease profile provides an invaluable resource relating to one of the main causes of premature mortality nationally; a disease whose mortality rates are increasing in England, while decreasing in most EU countries. The local authority profiles will support the development of Joint Strategic Needs Assessments and work of health and wellbeing boards presenting local key statistics and highlighting questions to ask locally about current action to prevent liver disease.
The website contains data for upper tier local authorities, NHS Integrated Care Boards, former Government Office regions, England and where available lower tier local authorities.
Further details about the profile methodology are available within the definitions section of the online version of the liver disease profile.
Responsible statistician, product lead: Liz Rolfe, Julia Verne
For queries relating to this document, please contact: liverdisease@phe.gov.uk